GCSE Tutoring Programme
Our chosen students improved 1.19 of a grade on average - 0.45 more than those who didn't have the tutoring.
In order to access this I need to be confident with:
Combined events probability Probability notation Fractions, decimals and percentages Venn diagramThis topic is relevant for:

Probability Symbol
Here we will learn about probability symbols, including union, intersection and complement notation.
There are also probability symbols worksheets based on Edexcel, AQA and OCR exam questions, along with further guidance on where to go next if you’re still stuck.
What are probability symbols?
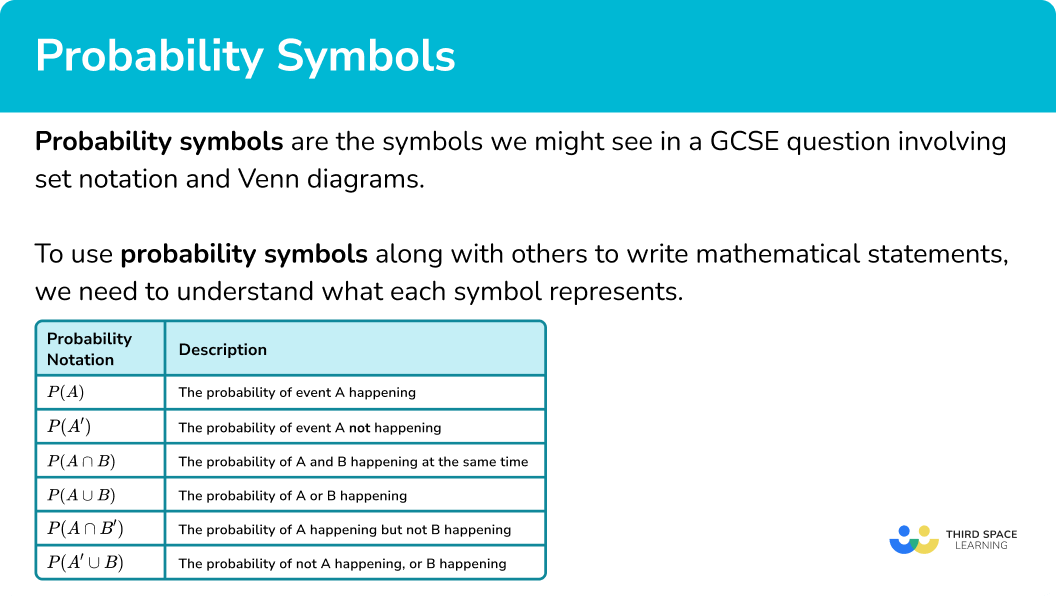
Probability symbols are the symbols we might see in a GCSE question involving set notation and Venn diagrams.
To use probability symbols along with others to write mathematical statements, we need to understand what each symbol represents.
For example, below is a Venn diagram (a joint probability distribution) showing the following information,
- \xi = \{1,2,3,4,5,6,7,8,9,10\}
- A = \{ even numbers \}
- B = \{ multiples of 3\}
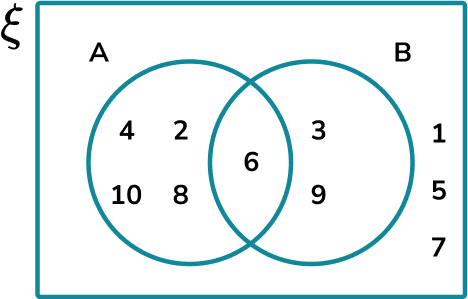
The probability of an even number that is also a multiple of 3 in the Venn diagram above is \frac{1}{10}. This is because there is only 1 value (or element) in the intersection of the Venn diagram, out of a total of 10 values (or elements).
Step-by-step guide: Venn diagrams
In probability theory, probability symbols allow the reader to shorten a mathematical statement so that it is more clear and concise.
If we used probability symbols to represent the previous probability in the Venn diagram above (the probability of selecting an even number and a multiple of 3 ), we would write P(A\cap{B})=\frac{1}{10}. This also reads as the probability of A intersection B is equal to one tenth.
The table below outlines key set notation that is used within probability theory; the next table outlines key probability symbols alongside their description.
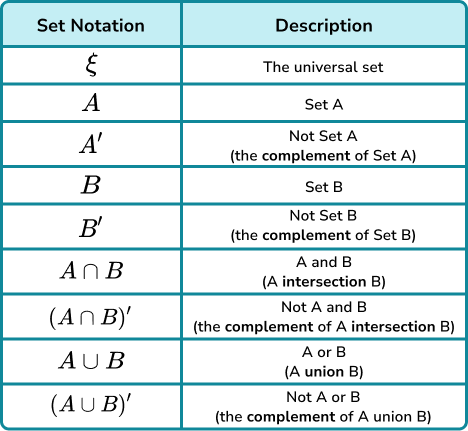
We can use these symbols for probability purposes.
Here is what each symbol means in the context of probability.
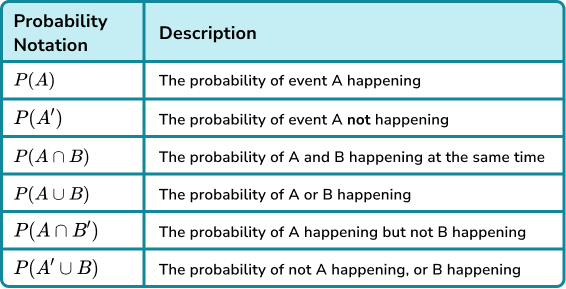
Note: P(x) is the probability of the random variable x occurring. The P is a capital letter.
What are probability symbols?
How to answer questions with probability symbols
In order to answer questions with probability symbols:
- Identify the probability description from the symbols being used.
- Identify the frequency of the event required.
- Divide the frequency of the event by the total number of outcomes.
Explain how to answer questions with probability symbols
Probability symbol worksheet
Get your free probability symbol worksheet of 20+ questions and answers. Includes reasoning and applied questions.
COMING SOONProbability symbol worksheet
Get your free probability symbol worksheet of 20+ questions and answers. Includes reasoning and applied questions.
COMING SOONRelated lessons on describing probability
Probability symbol is part of our series of lessons to support revision on describing probability. You may find it helpful to start with the main describing probability lesson for a summary of what to expect, or use the step by step guides below for further detail on individual topics. Other lessons in this series include:
Probability symbol examples
Example 1: calculating the probability of event A happening
Let \xi = \{1,2,3,4,5,6,7,8,9,10\} and A = \{ prime number \}. A number is selected at random from \xi. Calculate P(A).
- Identify the probability description of the symbols being used.
As A = \{ prime number \}, the set of A contains the items 2, 3, 5, and 7. This is written as A= \{2,3,5,7\}.
2Identify the frequency of the event required.
There are four numbers in the set of A and so A has a frequency of 4.
3Divide the frequency of the event by the total number of outcomes.
There are 10 numbers in the universal set, \xi. Therefore,
P(A)=\frac{4}{10}=\frac{2}{5}.
Example 2: calculating the probability of event A not happening
Let \xi = \{1,2,3,4,5,6,7,8,9,10,11,12,13,14,15\} and A = \{ multiple of 4\}. A number is selected at random. Calculate P(A’)
As A = \{ multiple of 4\}, \ A’ will therefore be the numbers that are not multiples of 4 and so A’ = \{1,2,3,5,6,7,9,10,11,13,14,15\}.
A’ has a frequency of 12.
There are 15 numbers in \xi. Therefore,
P(A')=\frac{12}{15}=\frac{4}{5}.
Example 3: calculating the probability of event A and B happening
Let \xi = \{1,2,3,4,5,6,7,8,9,10\}, \ A = \{ prime number \} and B = \{ even number\}. Determine the value of P(A\cap{B}). Express your solution as a decimal.
As A = \{ prime number \}, we therefore know that A = \{2,3,5,7\}.
As B = \{ even number \}, we therefore know that B = \{2,4,6,8,10\}.
This means that A\cap{B} = \{ prime and even \} = \{2\}.
A\cap{B} has a frequency of 1.
There are 10 numbers in \xi therefore,
P(A\cap{B})=\frac{1}{10}=0.1.
Example 4: calculating the probability of event A or B happening
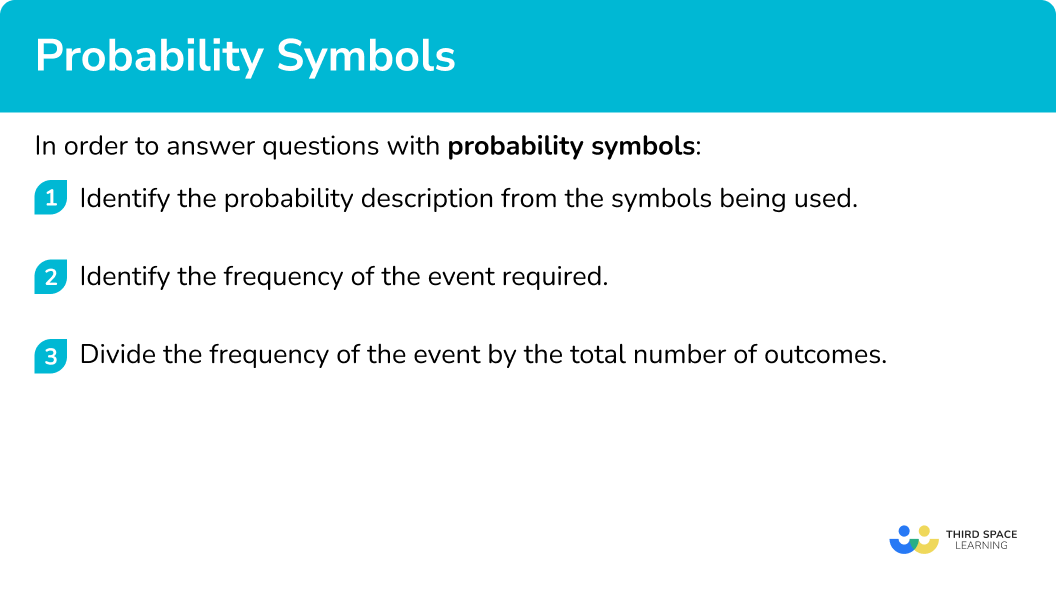
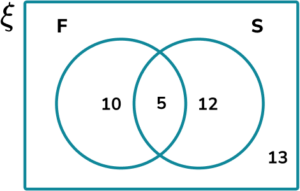
The Venn diagram shows the frequency of 40 students who study two subjects,
F=\{ Students studying French \}, and S=\{ Students studying Spanish \}.
Calculate P(F\cup{S}).
Given that F = \{ Students studying French \} and S = \{ Students studying Spanish \} where \cup represents the union of two sets, we have F\cup{S} = \{ Students studying French or Spanish \}.
F\cup{S} has a frequency of 10+5+12=27.
There are 40 students in \xi. Therefore,
P(F\cup{S})=\frac{27}{40}.
Example 5: calculating the probability of event A happening and B not happening
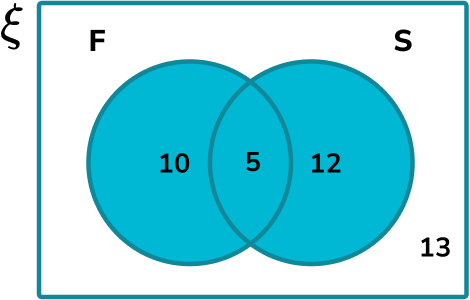
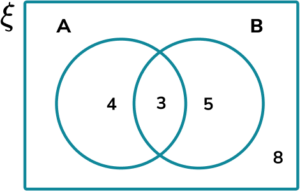
The Venn diagram shows information about two sets A and B.
Calculate P(A\cap{B}’).
A\cap{B’} = \{ elements in set A but not set B\}.
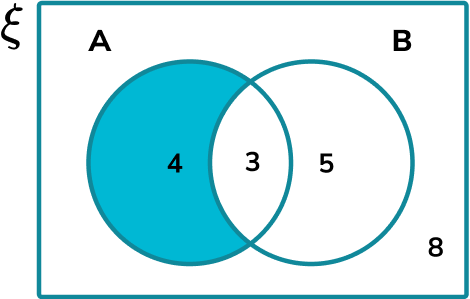
A\cap{B’} has a frequency of 4.
There are 20 elements in \xi. Therefore,
P(A\cap{B’})=\frac{4}{20}=\frac{1}{5}.
Example 6: calculating the probability of event B not happening or C happening
65 students were asked whether they liked B=\{ Banana} and C=\{ Custard \}. The results are represented in the Venn diagram below.
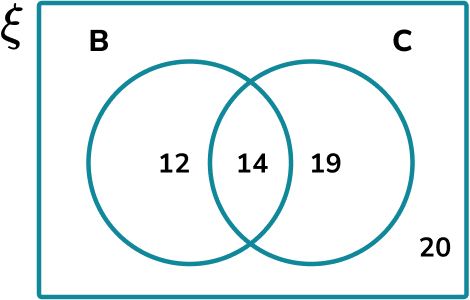
Calculate the probability P(B’\cup{C}).
The symbols B’\cup{C} is the set of elements not in set B, or the elements in set C. Contextually, we want to calculate the probability that a student likes banana and custard, custard only, or neither.
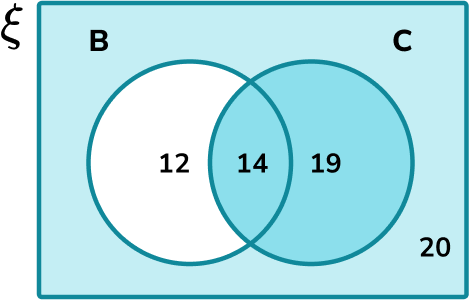
B’\cup{C} has a frequency of 14+19+20=53.
There are 65 elements in \xi. Therefore,
P(B’\cup{C})=\frac{53}{65}.
Common misconceptions
- Confusing the intersection symbol with the union symbol
The two symbols ∪ and ∩ have two different meanings. The intersection of two sets means that the item is in both of these sets, whereas the union of two sets, the item can be in one or the other, or both.
It is common for students to forget that elements in the union (U) of two sets can be excluded from the description of one of the sets in the union.
Practice probability symbol questions
1. Let \xi = \{1,2,3,4,5,6,7,8,9,10,11,12,13\} and A = \{ multiples of 3\}. A number is selected at random. Find P(A).


There are 4 elements in set A and 13 in \xi and so P(A)=\frac{4}{13}.
2. Let \xi = \{1 \leq x \leq 15 \} and A = \{x is a multiple of 5\}. A number is selected at random. Find P(A').
3. Let \xi = \{1,2,3,4,5,6,7,8,9,10,11,12,13,14,15\} with A = \{ multiples of 3\} and B = \{ odd numbers \}. A number is selected at random. Calculate the value of P(A\cap{B}).
4. Let \xi = \{1,2,3,4,5,6,7,8,9,10\} where A = \{ multiples of 4\} and B = \{ prime numbers \}. A number is selected at random. Find P(A\cup{B}).
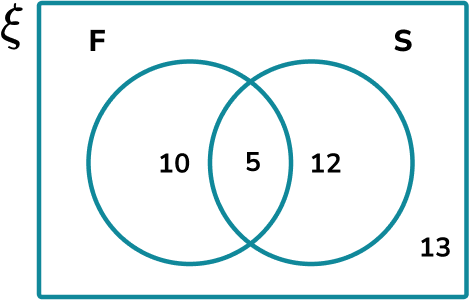
5. The Venn diagram shows the frequency of students who are studying F=\{ French \} and S=\{ Spanish \}.
Find P(F \cap S’).
The frequency of F\cap{S’} is 10 \ (F but not S).
6. The Venn diagram shows information about two sets A and B.
Calculate P(A\cup{B’}).
The frequency of A\cup{B’} is 3 + 4 + 8 = 15.
Probability symbol GCSE questions
1. Cards numbered 1 to 100 are shuffled and one is selected at random.
If A = \{ square numbers \} and B = \{ cube numbers \}.
(a) Write the numbers in sets A and B.
(b) Calculate the value of P(A\cup{B}).
(c) Calculate the value of P(A\cap{B}).
(4 marks)
(a)
A = \{1,4,9,16,25,36,49,64,81,100\}.
(1)
B = \{1,8,27,64\}.(1)
(b)
\frac{12}{100}
(1)
(c)
\frac{2}{100}
(1)
2. The Venn diagram shows the number of students in a class of 30 who wish to study creative subjects for A level.
M = \{ students wishing to study Music \}
D = \{ students wishing to study Drama \}
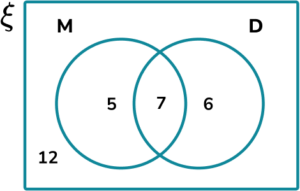
(a) Calculate the value of P(M\cap{D’}). Write your answer as a fraction in the simplest form.
(b) Calculate P({M’}\cup{D’}).
(5 marks)
(a)
Fraction out of 30.
(1)
\frac{5}{30}(1)
\frac{1}{6}(1)
(b)
Fraction out of 30.
(1)
\frac{23}{30}(1)
3. The Venn diagram shows information about pets owned by a class of 25 students.
D = \{ own a dog \}
C = \{ own a cat \}
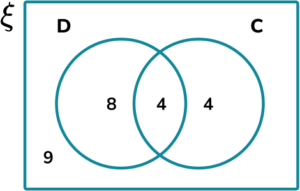
(a) Find P(D’\cap{C’}).
(b) Find P(C’\cup{D}).
(4 marks)
(a)
Fraction out of 25.
(1)
\frac{9}{25}(1)
(b)
Fraction out of 25.
(1)
\frac{21}{25}(1)
Learning checklist
You have now learned how to:
The next lessons are
Beyond GCSE
The study of probability theory and statistics is covered much more in depth at A level. This is because there are certain situations where the probability of an event cannot be given and so we have to define a probability from a range.
This in turn means that there are an increasing number of probability and statistics symbols covered, including the use of greek letters.
Probability theory studies at A level include,
- Probability distributions including their geometric distribution,
◌ The normal distribution
◌ The binomial distribution
◌ The poisson distribution - Probability density functions
- Cumulative distribution functions (cdf)
- Correlation (corr) and regression
- Sample standard deviation (std), variance and covariance (cov)
- Degrees of freedom
- Factorials
- Permutations
- Probability mass function (pmf)
- Population mean and sample mean
- Set theory
- Summation
Still stuck?
Prepare your KS4 students for maths GCSEs success with Third Space Learning. Weekly online one to one GCSE maths revision lessons delivered by expert maths tutors.

Find out more about our GCSE maths tuition programme.