
SATs Results 2022: What You Need To Know
This page was updated with all the results, SATs data and analysis on Wednesday 6th July 2022, including commentary from our author Sophie Bartlett.
It’s 7.25am on SATs results 2022, you’re sitting at your laptop with your hot beverage of choice, and you’re ready to hit refresh incessantly on the Primary Assessment Gateway from 7.30am. Little do you know you’ll be there over an hour later with the error message branded into your eyes as you’ve had to look at it for so long!
Ah, the pleasures of SATs results morning. Come midday, most primary schools had their results (and the national averages) and were most likely sitting furiously analysing them.
So, three years on since we last endured this together… What does Year 6 look like right now, after over two years of pandemic disruption?
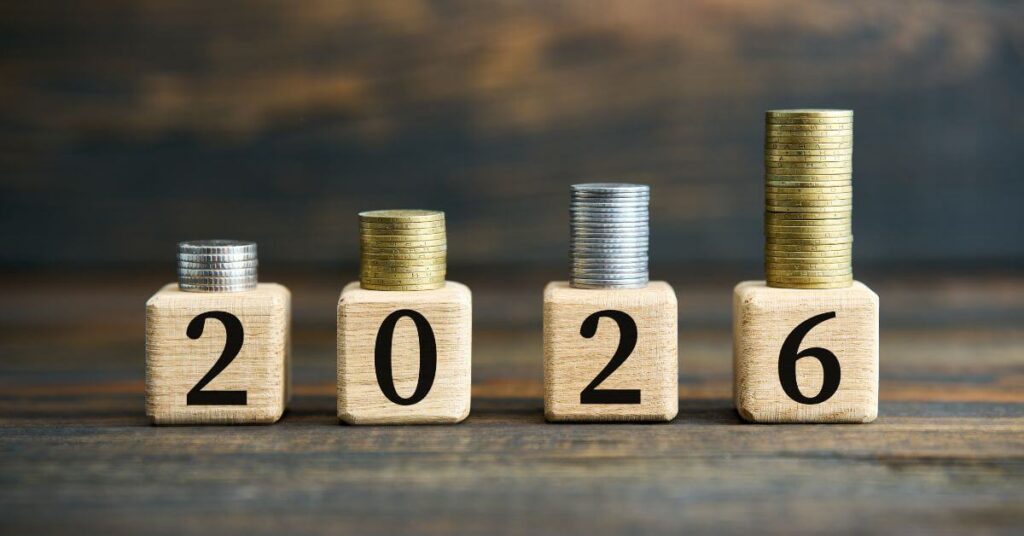
SATS 2026: STAY UP TO DATE
Join our email list to stay up to date with the latest news and free resources for SATs 2026. As usual our expert teachers will be on hand to provide one to one tuition support, revision resources, expert paper analysis, SATs teacher survey results and the SATs results 2026.

KS2 SATs Maths Preparation Pack
Help your pupils prepare for their KS2 SATs math exams with this SATs preparation pack.
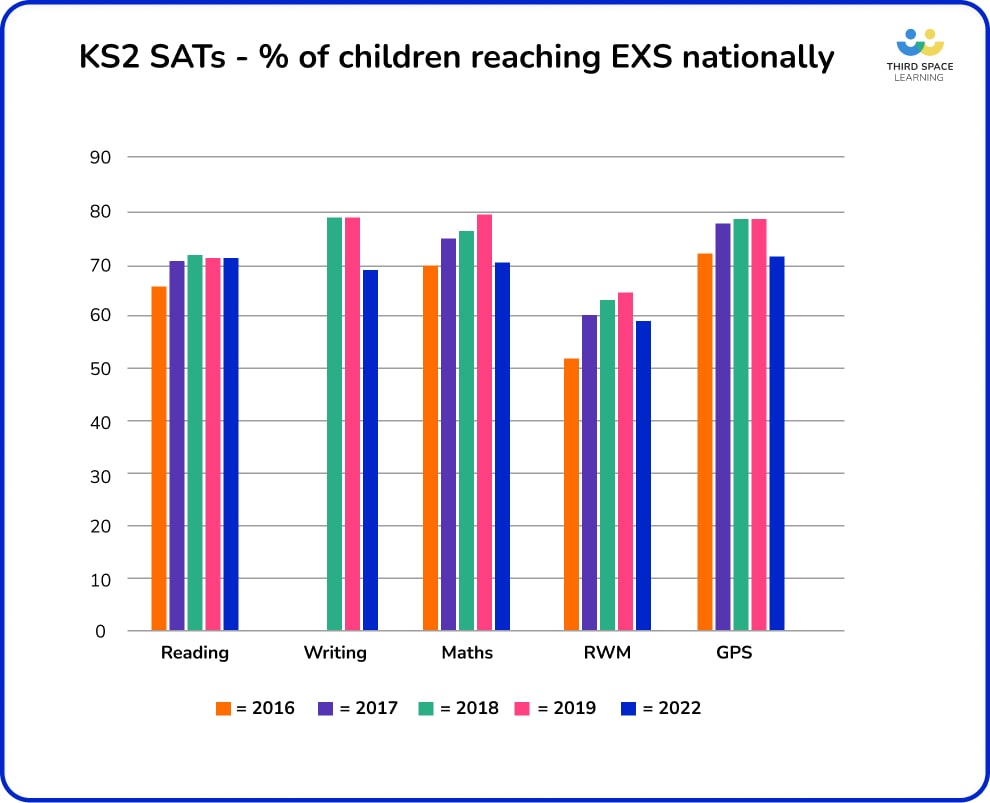
Download Free Now!National attainment was notably down from 2019 (as expected)
Let’s start by looking at the national picture for SATs 2022.
- 74% of pupils met the expected standard in reading, up by 1% from 73% in 2019.
- 71% of pupils met the expected standard in maths, down by 8% from 79% in 2019.
- 69% of pupils met the expected standard in writing, down by 9% from 78% in 2019.
- 59% of pupils reached the expected standard in all of reading, writing and maths, down by 6% from 65% in 2019.
- 72% of pupils met the expected standard in English grammar, punctuation and spelling, down by 6% from 78% in 2019 (remember, however, that grammar, punctuation and spelling test (GPS) results do not count towards the school accountability measures).
Apart from English reading, national attainment in all other areas dropped from 2019. Of course, you’d assume that this is to be expected considering the turbulent time children have had in school over the past couple of years.
There is missing data for writing in 2016 and 2017 as changes made within the 2017/18 writing TA frameworks mean that judgements in 2018 are not directly comparable to those made using the previous interim frameworks in 2016 and 2017.
While reading results are the second highest they’ve ever been (narrowly beaten by 2018, with a national attainment of 75%), it’s a different story for the rest.
Writing and GPS are both the lowest they’ve ever been, with only 69% and 72% of pupils achieving EXS respectively.
Maths is the second lowest it’s ever been at 71% – it was its lowest in 2016 with 70% of children achieving EXS.
The combined reading, writing and maths attainment is also the second lowest it’s ever been at 59% – again at its lowest in 2016 with only 53% of children achieving EXS across all 3 subjects.
From a series of polls on Twitter with nearly 2,000 respondents, most teachers (41.9%) reported that writing was their lowest scoring subject this year and reading their highest (49.3% of teachers).
This pattern followed through with GDS, with most teachers reporting their lowest greater depth result in writing (62.3% of respondents) and highest in reading (54.9%).
Most teachers (47.9%) said their results were similar to what they had expected, with 38.5% reporting that they had done better than expected, and 13.7% saying they had done worse.
Read more from SATs 2022:
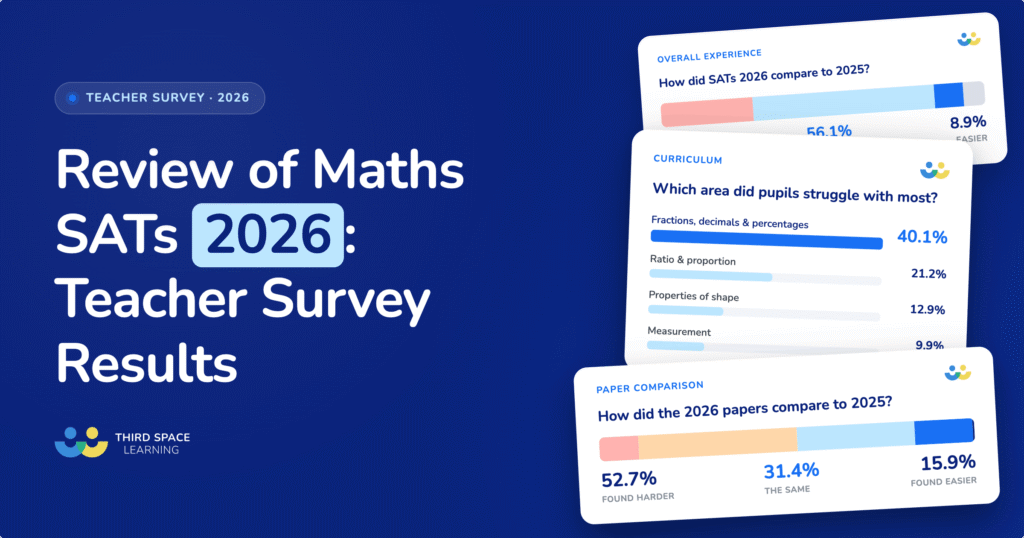
- Review Of Maths SATs 2022: Results Of Our Teacher Survey
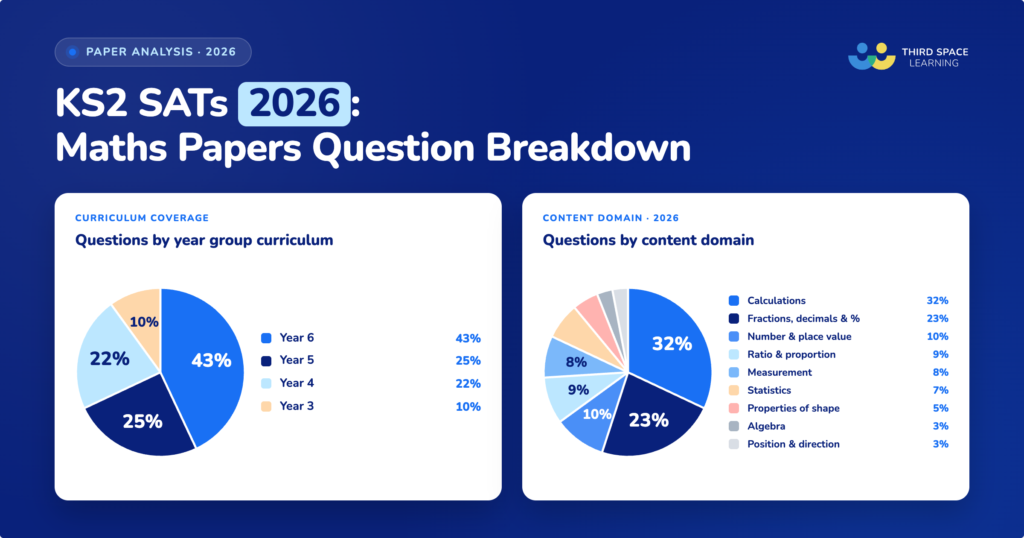
- KS2 SATs 2022: Maths Papers Question Breakdown
- What Are SATs: A Comprehensive Guide
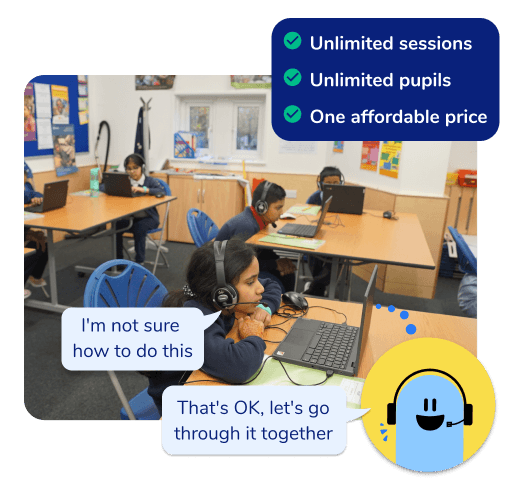
Unlimited primary maths tutoring with Skye, the spoken AI maths tutor.
Built on the same principles, pedagogy and curriculum as our traditional tutoring, but with more flexibility, reach and lower cost.
Join the schools already helping hundreds of primary pupils nationwide with Skye’s one to one maths tutoring.
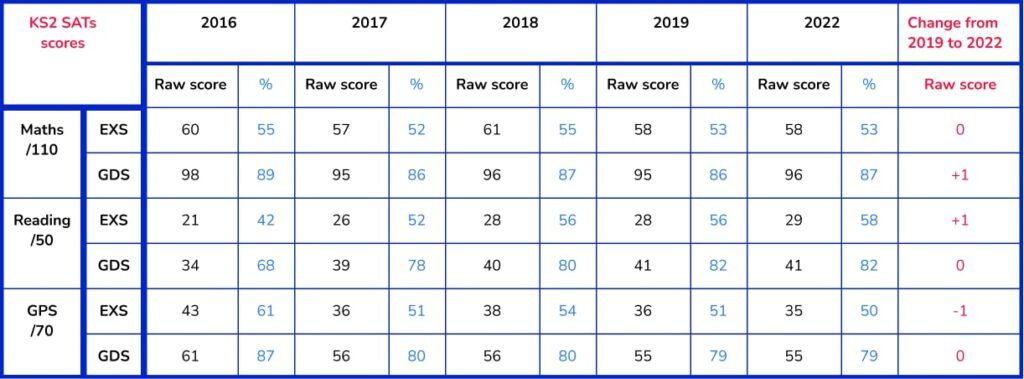
Watch Skye in actionWhat were the raw and scaled scores for SATs 2022?
The raw scores required to reach expected standard (EXS – a scaled score of 100) and ‘greater depth’ (GDS – generally accepted to be a scaled score of 110) can be seen below.
Read More: Standardised Scores: What Do They Mean?
Drop in attainment for all subjects except reading
There were minor changes to raw scores this year, which surprised some, assuming that perhaps the impact of the disrupted few years would be taken into account by lowering the raw scores required to pass.
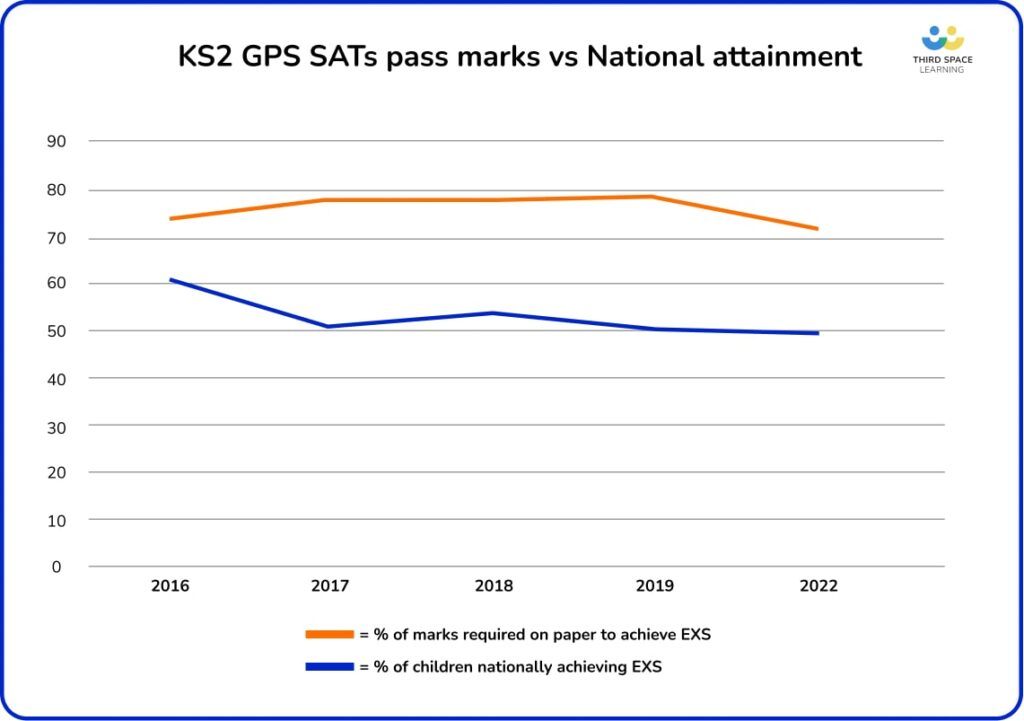
Whilst the raw score required to achieve EXS for the GPS paper is the lowest it’s ever been (35/70), it’s the complete opposite for the reading paper, where the raw score required to achieve EXS was its highest at 29/50.
Maths sat somewhere in the middle. 58/110 was required to ‘pass’ the maths this year, which was the same as 2019, lower than both 2016 and 2018, but higher than 2017.
The pattern follows for raw scores required to achieve GDS: for GPS, one of the lowest it’s been (55/70, the same as 2019); for reading, one of the highest it’s been (41/50, the same as 2019); and for maths, somewhere in the middle (96/110 – the same as 2018, lower than 2016, but higher than both 2017 and 2019).
The drop in attainment for all subjects except reading (where there was a rise) had lots of people speculating. It makes sense why Covid disruption would have negatively impacted maths, writing and grammar – but why has it seemingly had the opposite effect on reading?
Reading continued to buck the trend in average scaled scores
The average scaled scores for each test have also been released.
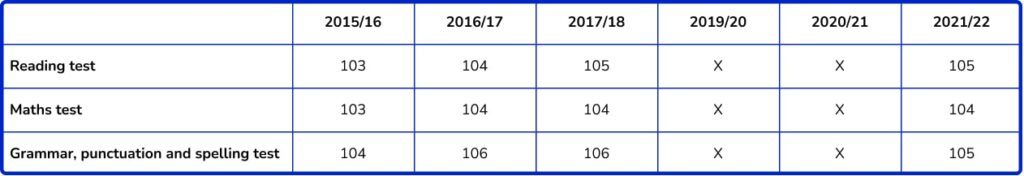
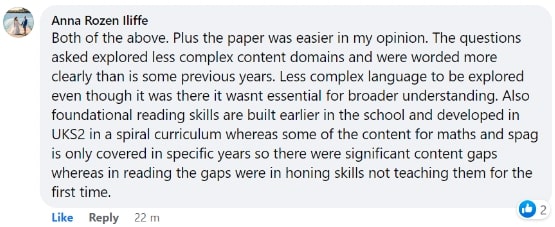
This is another example where reading is the highest it’s ever been, the same as in 2018. Not only was the pass mark increased, but the average scaled score and proportion of children ‘passing’ improved too. Is this a reflection of the difficulty of the paper (easier than in previous years) or, as the national averages would suggest, are our Year 6s getting more skilled at the reading comprehension paper?
The average scaled scores for both maths and GPS this year are median scores of 104 and 105 respectively. Each subject’s national attainment dropped by 8% (maths) and 6% (GPS) from 2019, which would also explain a drop of 1 scaled score point each.
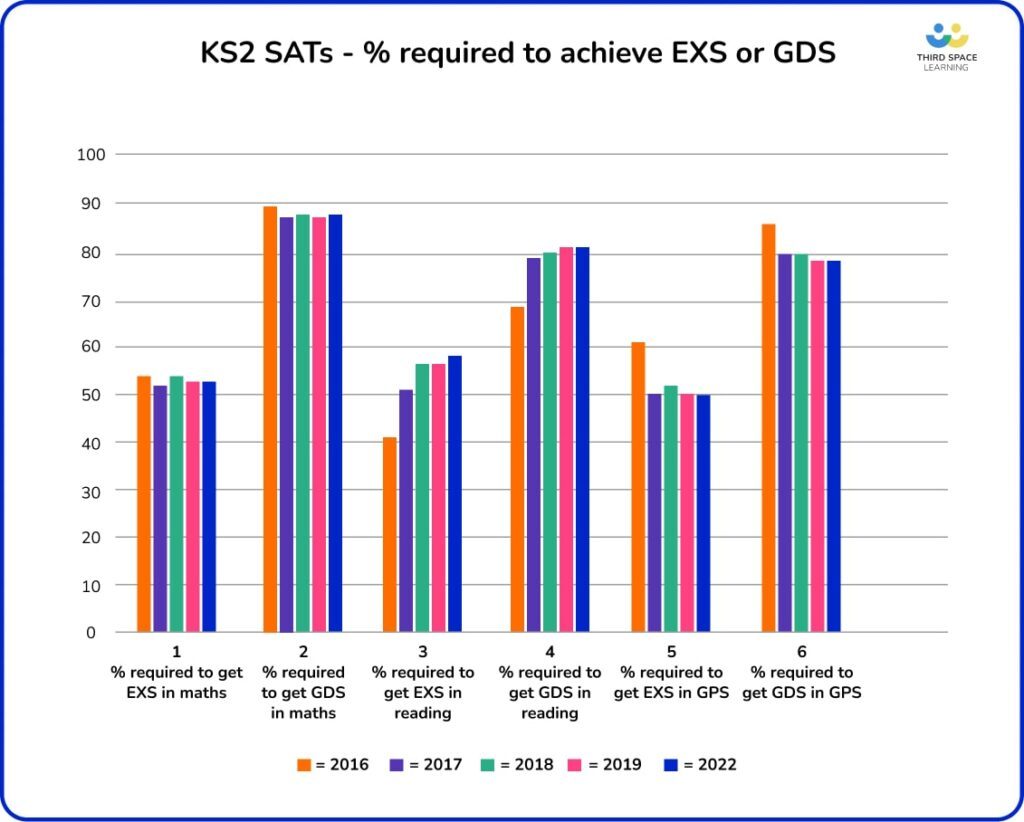
No definite patterns between raw scores and national attainment
I thought it seemed sensible to explore the relationship between the raw scores (or at least those that have been decided to equate to a scaled score of 100, or EXS, or a ‘pass’) and the proportion of children ‘passing’ nationally. As it turns out, there aren’t any definite patterns, but there are some things worth pointing out.
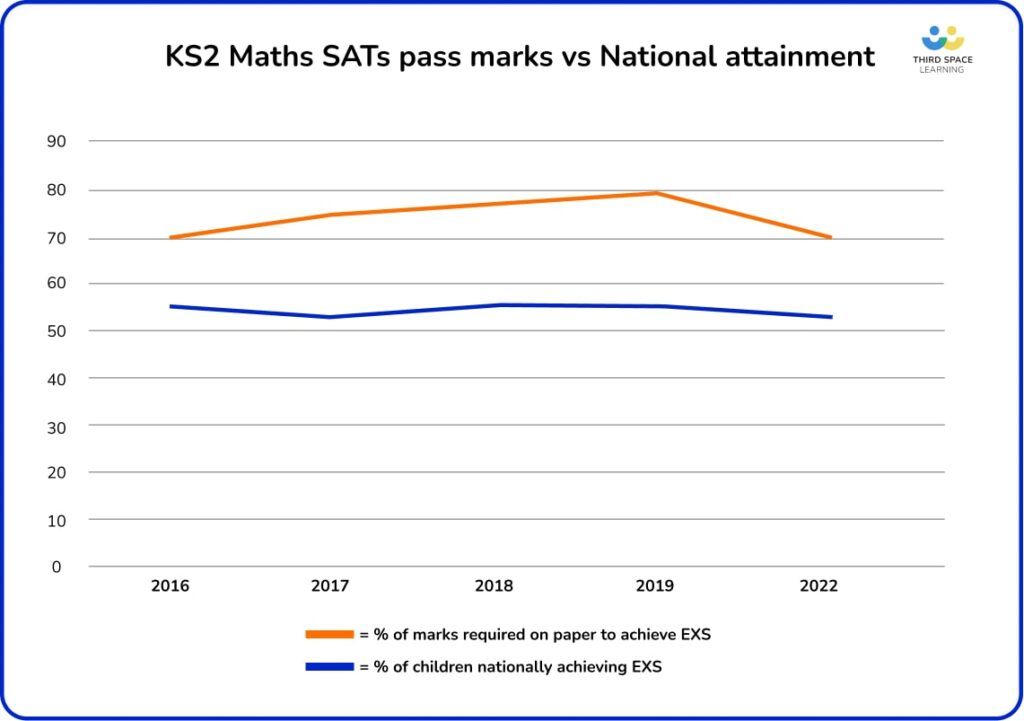
Where the pass mark in maths was one of the highest (55%, or 60/110), the national EXS was the lowest (70%). Seemingly, the more difficult it was to pass, the fewer children passed. There isn’t much else of a trend here, but it’s possibly worth noting that even with one of the lower pass marks (53%, or 58/110), still only 71% of children ‘passed’ – which is, as previously mentioned, the second lowest national attainment to date.
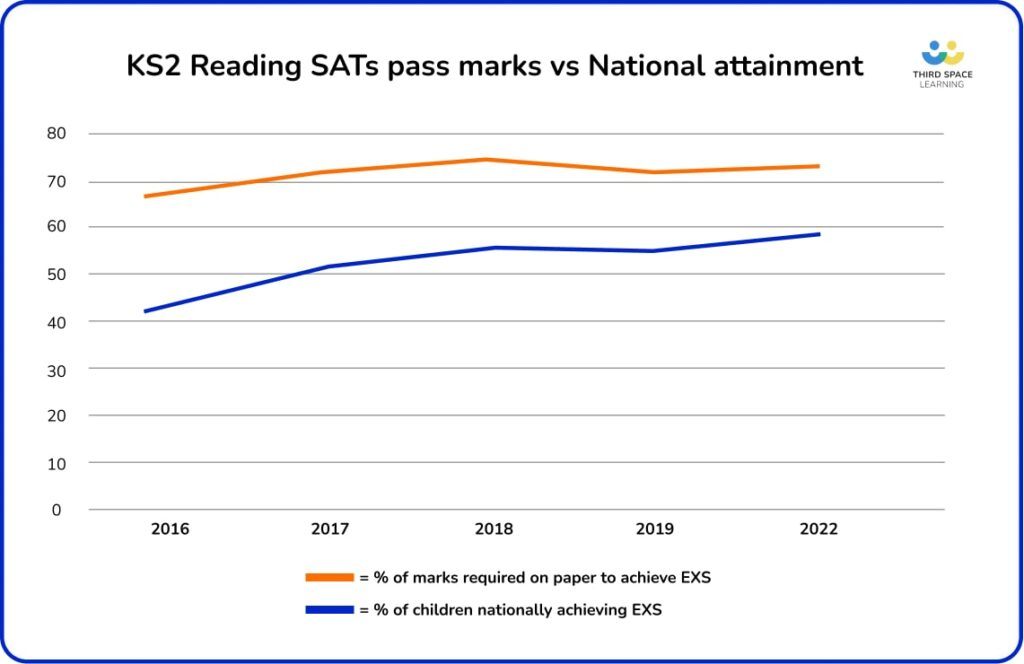
As the pass mark has gradually risen in reading, so (on the whole) has the proportion of children achieving EXS nationally. Are we rising to the continually increasing standards here?
No real trend here, except perhaps noting that in 2019, one of the lowest pass number of marks (51%, or 36/70) produced one of the highest proportions of children achieving EXS nationally (78%) – the easier it was to pass, the more children passed?
Paper analysis: how did content domains relate to marks?
Maths: more Year 3 to Year 5 content than ever
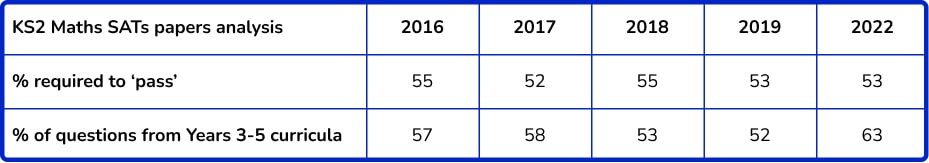
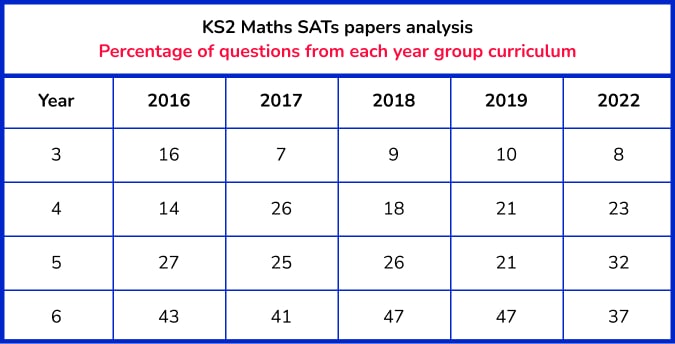
Although the maths papers are still weighted towards Year 6 maths content, in previous years, we have seen it be possible to ‘pass’ – or almost pass – without knowing the Year 6 maths curriculum at all.
The same can be said for this year, as the content from Years 3-5 is higher than ever before and the pass mark has remained at 53%. (It is worth mentioning that these papers were originally intended for 2020, and therefore, it could not be possible for the test writers to make any adjustments because of Covid ‘gaps’).
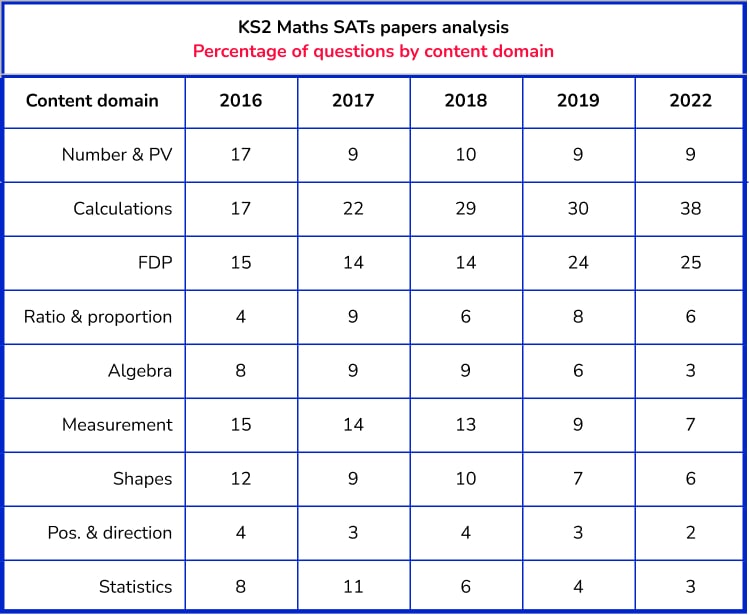
The two most content-heavy domains have pretty much almost been calculations and fractions, decimals and percentages (FDP). So much so that, with a pass mark this year of 53%, children could have passed the 2022 maths paper by just answering questions related to calculations and FDP alone.
Reading: highest pass mark for fewest words
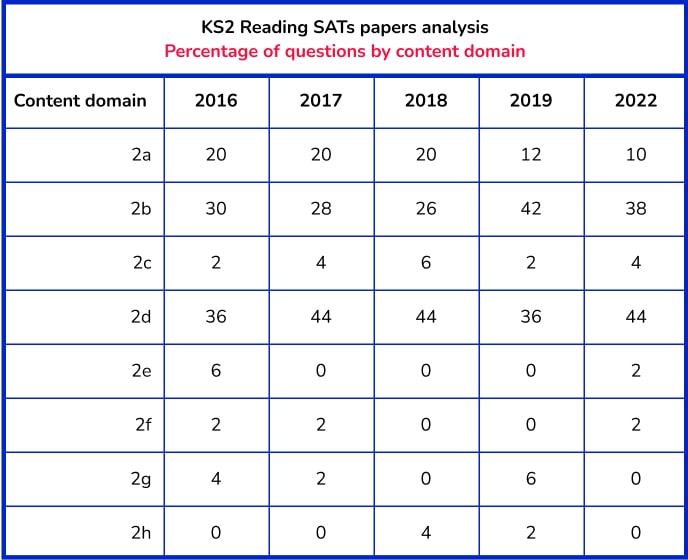
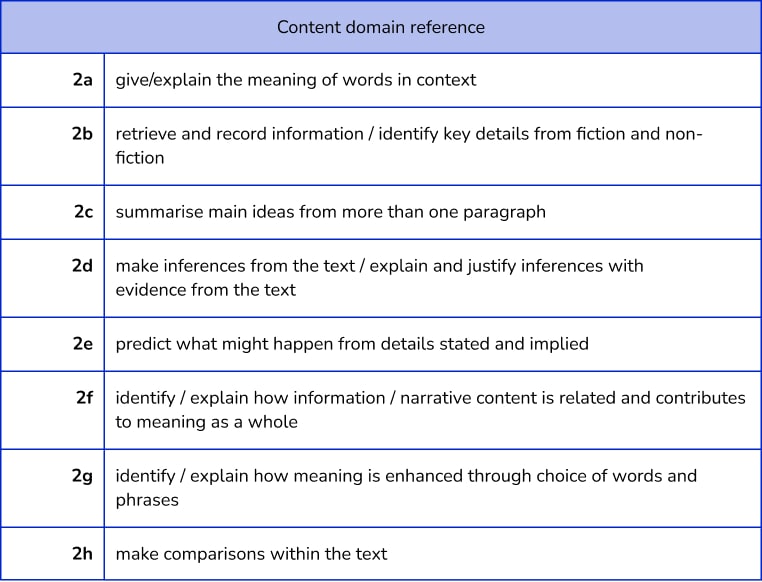
The two most content-heavy domains in the reading papers have always been 2b (commonly known as ‘retrieval’) and 2d (inference) – this is even more so the case this year.
The word counts for the papers this year are smaller than in most previous years. In fact, there is a significant difference between 2019 and 2022.
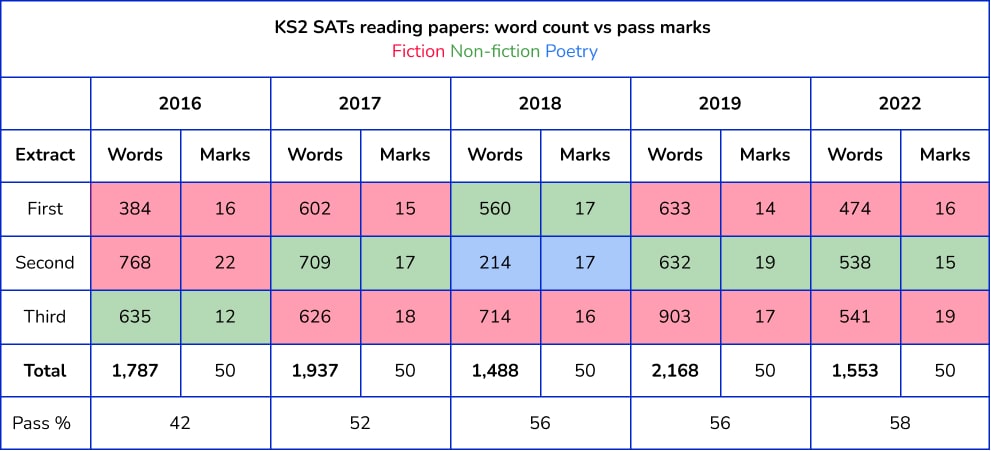
This year, we have the highest pass mark for a paper with one of the fewest amounts of words, perhaps a reflection of its difficulty. The fewer the words, generally the ‘easier’ a reading test could be considered: could this be one reason why the pass mark was higher this year?
Grammar: pass possible with just G1 and G5 questions
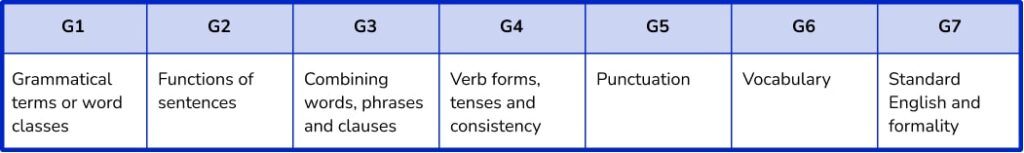
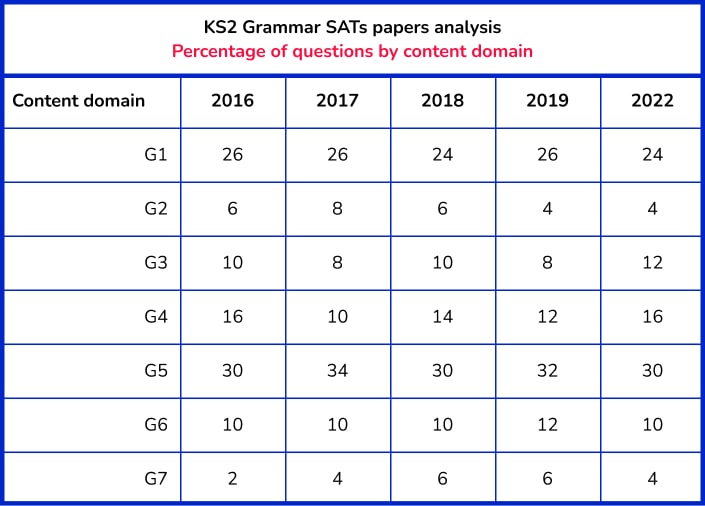
The two most content-heavy domains in the grammar papers have always been G1 (grammatical terms or word classes) and G5 (verb forms, tenses and consistency). So much so that, with a pass mark this year of 50%, children could have passed the 2022 maths paper by just answering questions related to solely these two content domains. In fact, this is the case every year since 2017.
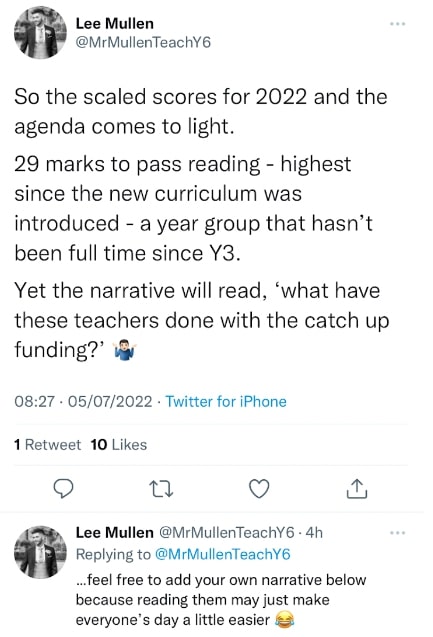
Some teachers will be appealing and requesting remarking
In a poll of almost 800 teachers on Twitter, 71.5% said they were going to appeal at least one of their papers. 4.6% reported that they were going to send over 10% of their papers back for remarking.
There have also been a few teachers finding what they consider to be marking errors and discrepancies amongst their papers too – a reminder to check yours carefully!
What does all of this mean for SATs 2023?
As mentioned by the Twitter user above, the current Year 6s haven’t had a full year of schooling since Year 3.
It seems to make sense, then, that the national averages would drop in all subjects from 2019.
The question remains about the reading. Not only did the raw score required to pass increase, but so did the proportion of children achieving EXS nationally. In fact, there has been a consistent increase in pass marks for the reading paper since 2016, from 42% then to 58% this year. Does this mean we are expecting it to go up again in SATs 2023?
Since 2016, the pass mark for maths has stayed consistently between 52-55%, and for GPS between 50-54% (assuming that the first GPS paper in 2016 was an anomaly here with a pass mark of 61%!)
Next year, using past SATs papers should therefore still be a good measure of how children might perform in next year’s SATs. Although, it would be sensible to employ higher standards for the reading paper, for the reasons mentioned above!
Third Space Learning’s SATs revision programme can help prepare students for Year 6 SATs. Take a look at some of our Third Space Learning SATs success stories.
KS2 SATs results 2022: the next steps for your school
Before you start comparing your 2022 SATs results to national data, go through these steps to make sure the data you are comparing is accurate:
1. Small schools – check if the school-level results will be published
If you have less than 11 pupils who took the KS2 assessments, then the school-level data will not be published publicly, and won’t form part of any decisions for any intervention or coasting school definition.
2. Add on any special consideration uplift that you were granted
If you applied for special consideration at the end of SATs week for any of your pupils and were successful, it’s important to note that the scores reported on NCA tools do not take this into account.
Any children whose special consideration application was granted need 3 added to their scaled score.
3. Look closely to see if you need to submit any marking reviews
It’s only natural that during the massive task of marking hundreds of thousands of test scripts, some mistakes will happen.
To help address this, schools can apply for pupils’ scripts for a particular subject to be reviewed and marked again if they feel there is an error in the marking that will impact the pupils scaled score.
It’s certainly worthwhile looking in detail at the scripts (which can be downloaded from NCA tools) of any pupil who has a scaled score of 99.
Go through their papers against the published mark scheme, making sure you agree with the marking decisions.
Especially make sure that all of the page has been taken into account, including workings that are outside the answer area, as this is the most common reason for marking mistakes.
Don’t forget: SATs paper marking errors can go either way!
You should also note any marking errors that go in your favour (these do happen!). These need to be a part of your decision-making process for whether to submit a pupil’s paper for review.
If you feel you have found mistakes that would make a difference to a pupil’s scaled score you should know that if you submit it, all 3 papers will be remarked, and this can, in rare cases, lead to the marks going down! Being aware of the points you may lose as well as win is key here!
There is also a cost associated with the review if there has been no change to the marking decisions.
Results for any remarks will be published at the start of September.
4. Make sure you know how you compare to the national data
It almost goes without saying that you then need to look at how your school level percentages for the combined reading/writing/maths expected standard, alongside the expected standard levels for each individual subject, compared to the national results.
Remember there is not any national data for greater depth at this stage (this will be published in September).
Of course, whilst it is important to see how you compare nationally, remember the smaller your cohort, the less statistically relevant the national data is.
SATs key stage 2 results by school are available from the government’s school comparison service.
Predicting progress scores from your KS2 SATs results 2022
After you’ve looked at attainment, you may want to begin to attempt to predict what your school-level progress scores will be.
School progress scores are calculated based on an average of pupil progress scores, but the progress score measure is only statistically reliable as a school average, so individual scores should not be reported to parents.
A brief reminder about the methodology for calculating progress scores can be found below.
Each pupil is put into a Prior Attainment Group (PAG) based on their Key Stage 1 average point scores. It’s important to make sure you are calculating these correctly, understanding that it is not simply a case of adding up the three-point scores and dividing by 3.
To calculate the child’s average point score (and therefore their PAG), the calculation you need to do is:
- Add the child’s point score for reading and writing together from the English and reading tests.
- Divide this by 2.
- Add the child’s point score for maths to this total.
- Divide this new total by 2.
What is the next step when predicting progress scores?
After the calculation above, each PAG is then given an average scaled score.
This is the actual average of the scaled scores of all children nationally who fit into the PAG. Therefore, it is likely to be slightly different year on year, however, given the change in scaled scores, we can expect that these will be roughly the same.
The individual progress scores for all children who have KS1 assessment data available (meaning children were in the UK in state education at the end of KS1, even if they weren’t in your school) are all totalled per subject, and divided by the number of eligible pupils (i.e removing those that have been disapplied and those that don’t have KS1 assessment data) to give the school average.
You can only make a rough prediction at this stage, as the tables which give the average scaled scores for each PAG will not be published until at least October. You can find the latest tables and data here.
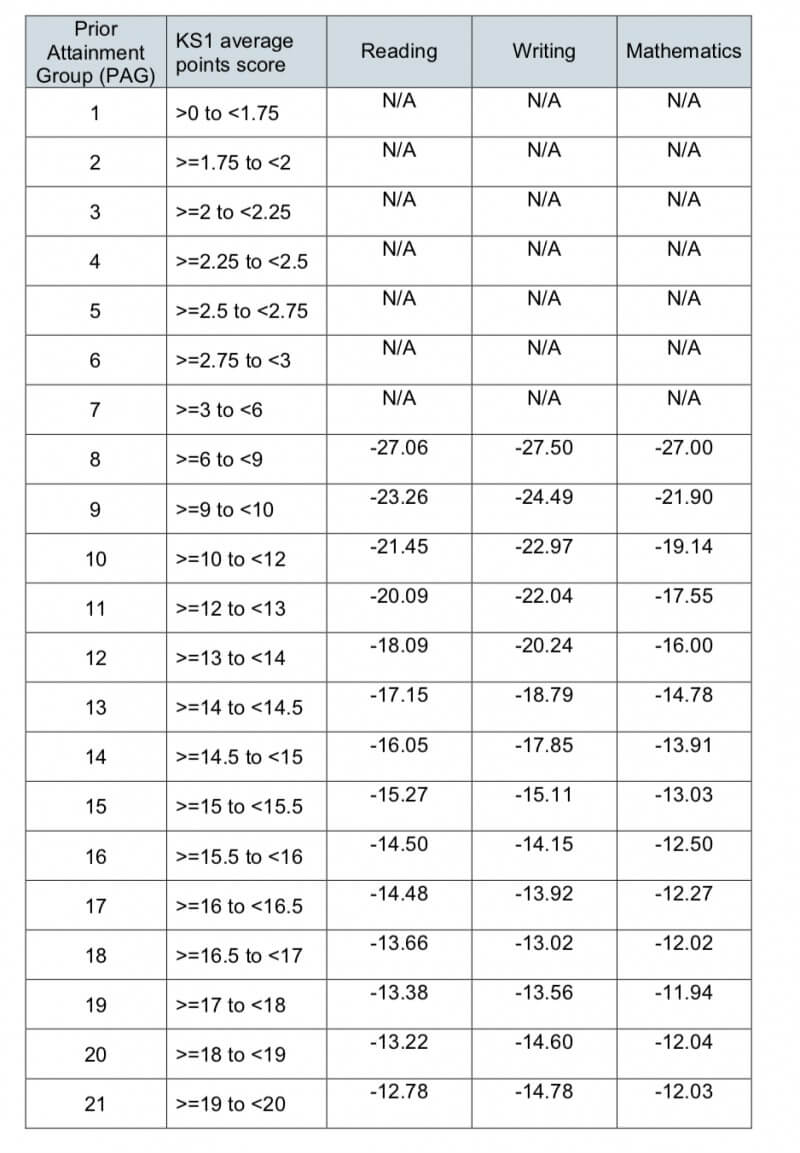
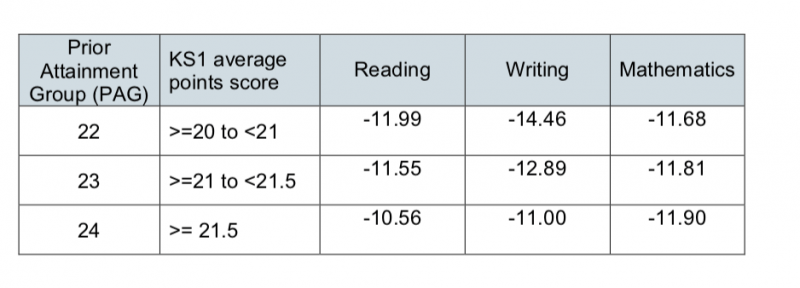
What about pupils with extremely negative progress scores in KS2 SATs?
The DfE puts measures in place to help reduce the impact of pupils with disproportionately negative progress scores (i.e. those who scored highly at KS1 but significantly below national standard in 2022 KS2 SATs).
However, before you get too excited, these only apply in very rare circumstances.
As an example, the table below was taken from the 2018 technical guidance and shows the lowest progress measure for each prior attainment group.
If a child’s progress is BELOW the figures in the table, their progress score is REPLACED by the figure in the table below.
What should school leaders be doing next?
Look for patterns and ‘messages’ from your Key Stage 2 SATs results data
It goes without saying that it is then important to look at your school performance data, including any progress predictions you may have made, and see what ‘messages’ they are sending.
Three key questions to ask:
- Is there only one subject where your results do not meet or exceed national averages?
- If so, is this a pattern from previous years, or something new for this year?
- Is there one subject which is impacting children gaining expected standard across all 3 subjects?
For example, do you have a disproportionate number of children who gained expected standard in reading and writing but not in maths? If so, consider how you will track this for your 2022-23 cohort to make sure this does not become a pattern.
Is there a gap between attainment of any key groups? If so, how can these effectively be addressed?
NB: ‘key groups’ could include pupil premium, non-pupil premium, EAL and non-EAL.
Once you’ve analysed your data and have looked for patterns, make sure you learn from it!
Consider what you need to put in place to help improve (or maintain) your results for future years.
Remember, the KS2 SATs are only a measure, but they are a measure of the whole of KS2, not just Year 6. So, any issues you have identified, and/or changes you make, need to take place across all of the school to have a real impact at the end of KS2. This is also the sort of thing that Ofsted will look for during inspections.
Headteachers, support your staff regardless of your KS2 SATs results in 2022
Remember, before thoughts turn to reporting to parents and letting children know their test scores, key staff members will need their school leaders’ support.
If the 2022 SATs results are good, then there is cause to celebrate. Your Year 6 team deserves a pat on the back, at the very least!
If the results are not as expected or desired then, putting aside personal thoughts and feelings, it is a leader’s responsibility to help staff come to terms with disappointment first and foremost.
Remember, KS2 SATs are a whole-school effort and the responsibility for results should not fall solely on the shoulders of the Year 6 teachers. So that you can make any follow-up productive, teachers will need to feel trusted and supported by their leaders – try to avoid any ‘knee-jerk’ reactions.
Don’t forget to report KS2 SATs results to children and parents
Naturally, children will want to know their scores. Remember that schools are legally required to provide a written report, which includes results of national curriculum tests (including the scaled score and measure of if they have met the expected standard or not) alongside teacher assessment judgements.
It is also a legal requirement that you provide enough time for parents to have the opportunity to discuss the results if they wish.
What else can you do for your Year 6 pupils?
Beyond the statutory letter, it is up to individual schools what else they do. Some send a more detailed letter, often explaining the role SATs tests have and how they are only part of the picture.
In some schools, Year 6 teachers release time to sit with each child and explain their test results alongside teacher assessment data. This gives staff an opportunity to show their children that the test is not the be-all-and-end-all.
It also lets them show the child that their full year of progress, not just the scores from the SATs, matters too. However, it is important that this is done on the same day (not before) that the results go out to parents.
Look on the bright side of your 2022 KS2 SATs results!
When results come out, especially if they are less than ideal, it’s easy to forget to look for the positives. However, positives will be there! Look at successes for particular individuals or pupil groups, or certain complete tests that have gone well for your cohort – these will all provide reasons to celebrate.
Remember, any more negative trends can begin to form part of your plan for next year. It’s important not to just focus and dwell on what went wrong, but to think forward to how things could be improved next time.
It’s also worth remembering that your children are more than a score.
What should Year 6 teachers be doing next?
The children will have worked their socks off this year, and even though they should hopefully know by now that SATs aren’t the be-all-and-end-all, they deserve to know how they got on.
Your SLT will decide how exactly this is done. However this happens, ensure the children know that the most important thing is that they tried their best – and that these numbers are arbitrary and mean nothing to them!
Whilst these scores are used for Progress 8 to predict their GCSE targets, most secondary schools seem to re-test children themselves in September to check they are placed in the correct set for each lesson. This might be a good question to ask your local secondary schools to let the children know what they should expect.
So, you’ve had the results, you’ve analysed them, they’ve been shared with governors, children, parents… now what?
There are still two weeks of the academic year left (for most of us!)
I know as well as anyone how jam-packed this time is with transition days, SRE lessons, play practices, Year 6 leavers bits… and that’s just the beginning! Hopefully, though, there is still some time to squeeze in a bit of maths before our Year 6s leave us for their secondary schools.
Whether this is recapping key concepts they should know for Year 7 or having them experiment with different maths puzzles and challenges, it’s important to keep their maths brains ‘ticking over’. Some secondary schools I know have even offered challenges to the children, to either complete in school or at home over the summer.
Before you know it, September will roll around and we will start this whole rigmarole again with the lovely current Year 5s. We mustn’t forget that the whole of their Lower Key Stage 2 experience has been disrupted, and it should be considered that this could still have a negative impact on their SATs results when they get there.
But that’s a while away. For now, rest and relax… summer is in sight!
How can Third Space Learning improve SATs results in maths?
We have a proven track record of providing Year 6 pupils with a targeted revision programme that combines a focus on the individual’s gaps with the key topics they need to know.
Our SATs revision lessons have been designed around a maths mastery approach building fluency, reasoning and problem-solving.
Schools often use Third Space Learning to support their target pupils who would otherwise not be securely on track to achieve the expected standard; with the support of Skye, the AI maths tutor, most of them are able to turn around their SATs results.
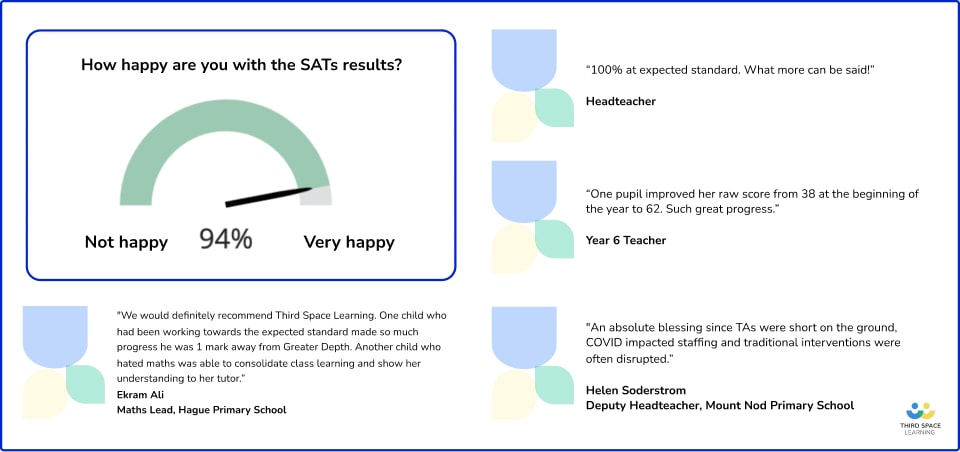
The high impact previously achieved by human tutors is the foundation for the new AI model. A 2022 post-SATs survey, delivered when a team of human tutors provided the service, highlighted the success that the underlying methodology brought to schools:
- Keeping in mind expectations, targets, and the impact of the last 2 years on learning, of those who were surveyed, 94% were happy with the SATs results.
- 93% of teachers surveyed said the weekly one-to-one sessions with their tutors helped their pupils achieve a higher score than they otherwise would have.
- All those that were surveyed agreed that Third Space Learning had a positive impact on this cohort’s overall engagement and confidence in maths
Skye is built on the same curriculum and pedagogical principles used by the human tutors, ensuring that the AI tutoring delivers effective, high-quality, and personalised support.
Read more about SATs results:
- KS2 SATs Results 2018: Next Steps For Your School
- KS2 SATs Results 2017: What To Do Next
- KS2 SATs Results 2016 Are In… What Next?
- How Hague Primary Took Pupils From Single-Digit Scores To Reaching Expected Standards In Their 2022 Maths SATs
Any score above 100 means that the student has met or exceeded the expected standard. However, all children and circumstances are unique and parents and teachers should also consider a student’s progress, not just a final SATs score.
A school will first receive SATs results and parents will shortly after be given their child’s results.
SATs can play a part in assigning students into sets in secondary school and are sometimes used to predict a student’s grades going forward to GCSEs. However, SATs results are not the be-all and end-all.
DO YOU HAVE STUDENTS WHO NEED MORE SUPPORT IN MATHS?
Skye – our AI maths tutor built by teachers – gives students personalised one-to-one lessons that address learning gaps and build confidence.
Since 2013 we’ve taught over 2 million hours of maths lessons to more than 170,000 students to help them become fluent, able mathematicians.
Explore our AI maths tutoring or find out about year 6 SATs for your school.


![The Top 20 SATs Revision Topics For 2026 [Video]](https://thirdspacelearning.com/wp-content/uploads/2026/01/SATs-webinar-2025-social-image-6-1024x576.png)