

KS2 Sats Results 2018: Next Steps For Your School
Originally published on 10th July 2018
Here’s what you need to know about the national KS2 SATs results 2018, what they mean for your school, what to do next, and how to explain and discuss them with teachers, parents and children.
As Maths specialists, we focus especially on the impact that the Maths Arithmetic and Reasoning papers have on the KS2 SATS results in 2018 what it means for 2019 SATs preparation.
So, the KS2 SATs results 2018 are now out and according to the official data, attainment in reading, writing and Maths has increased for the second year on the run. Didn’t we think it might!
KS2 SATs results 2019 now available here.
The National KS2 SATS Results 2018
In case you need it, here is a reminder of the headline national statistics for the 2018 National Curriculum Assessments.
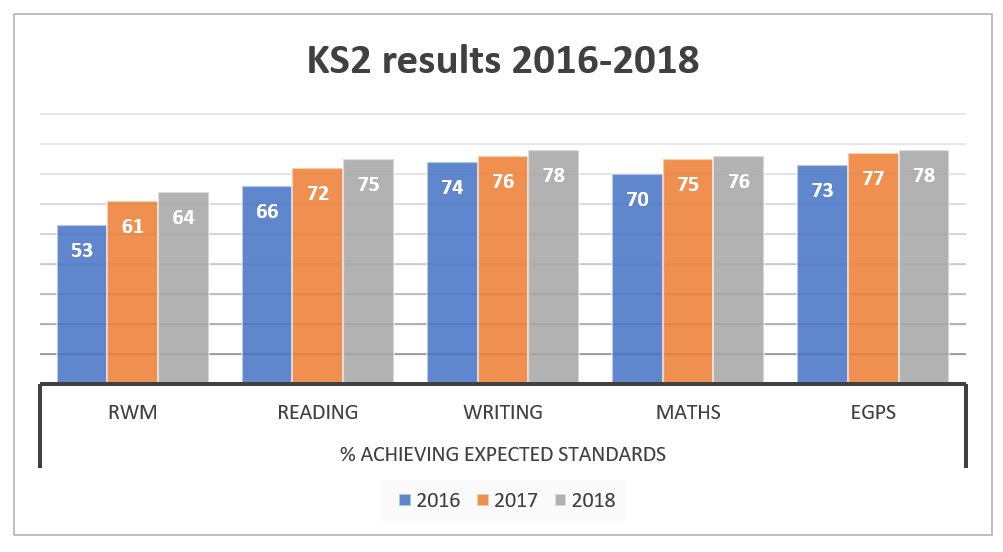
• 64% of pupils met the expected standard in reading, writing and maths combined – an increase of 3 percentage points from 2017
• 75% of pupils achieved the expected standard in reading – an increase of 4 percentage points from 2017
• 78% of pupils achieved the expected standard in writing, which is teacher assessed – an increase of 2 percentage points from 2017
• 76% of pupils achieved the expected standard in mathematics – an increase of 1 percentage point from 2017
• 78% of pupils achieved the expected standard in spelling, punctuation and grammar (SPAG), which as a reminder, does not count towards the school accountability measures.
Scaled Score Conversion Tables for the KS2 SATs Results
The conversion tables convert a pupils raw score in each of their SATs papers to the infamous scaled score. This year’s tables were released alongside the 2018 KS2 SATS results.
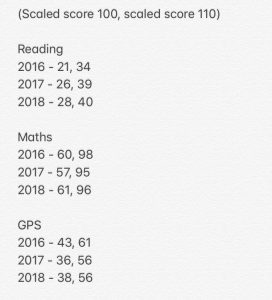
From these tables, we can see that the raw score needed to gain a scaled score of 100 (i.e the expected standard) for Maths in 2018 is 61. This compares to 57 in 2017 and 60 in 2016.
This means that children only need to gain an overall percentage of 55.4% across all three papers to be judged at working at the expected standard in Maths at KS2.
Read More: Standardised Scores: What Do They Mean?

2018 SATs Question Breakdown - Teacher Resource
Share this at a staff meeting or part of your next Maths CPD - the 15 lessons you should take from the 2018 KS2 SATs papers & what may come up in the 2019
Download Free Now!Trends from the KS2 SATS 2018 results
We are now in the third year of the ‘new style’ KS2 national assessments, so what trends are emerging?
1. First of all, it is worth noting that the DfE state that the results are not directly comparable to previous years due to the changes to the writing teacher assessment framework. We feel that the change to the framework made very little difference in practice and therefore the results still directly comparable.
2. The percentage of pupils gaining the expected standard on all measures has increased, but this increase has been less marked in Maths than in the other measures.
3. The scaled score required to gain the expected standard (100) in Maths has increased compared to both 2017 and 2016. This is to be expected, as the scaled scores are set each year based on the performance of each cohort on the tests that year. It does suggest that, overall, children scored better on the 2018 tests in Maths than in 2017 or 2016.
Both these trends are to be expected, and are probably a result of teachers and schools being more aware of what is tested and the test frameworks, and the new national curriculum now being taught for the whole of of KS2.
4. Although it looks like children have performed better than in 2016 and 2017 higher attaining pupils did not increase their score on the papers by as much as those who achieved the expected standard (or just above/below it).
Overall, the changes in the conversion tables compared to 2017 become less marked as the higher the raw score.
Detailed SATS papers 2018 question breakdown is now available.
Of course, the national data released is very broad at this stage. More detailed breakdowns will be released on the 4th September, which is also when schools will get their first view of their official progress measures from their 2018 KS2 SATs results (more on this below).
It will be interesting to see what the national picture is on where the marks came from in the individual Maths Reasoning and Arithmetic Papers.
Take a look at our question level analysis on the KS2 SATS papers 2017 to see how this can inform your Year 6 SATs revision, and also at the Year 6 SATs Maths revision programme that we created for 7,000 pupils in 2018.
Arithmetic remains key to great KS2 SATs results
The arithmetic test is now in its third year, and many schools are starting to appreciate how key this is to the overall success in Maths KS2 SATs.
This year, only 61 marks were required to gain the expected standard. If pupils gained 30 out of the 40 marks (which is easily achievable by most) on the arithmetic paper, this means they only need to gain 31 marks combined on the reasoning papers, meaning that they only need to get 44% of the reasoning papers correct.
If you work hard to keep children’s knowledge, skill and fluency in arithmetic current throughout Key Stage 2 it will become second nature, almost automatic by Year 6 and this gives them huge advantages.
Unlimited primary maths tutoring with Skye, the spoken AI maths tutor.
Built on the same principles, pedagogy and curriculum as our traditional tutoring, but with more flexibility, reach and lower cost.
Join the schools already helping hundreds of primary pupils nationwide with Skye’s one to one maths tutoring.
Watch Skye in actionNext steps for your own school’s 2018 KS2 SATs data
Before you start comparing your 2018 SATs results to national data, go through these steps to make sure the data you are comparing is accurate:
1. Small schools – check if the school level results will be published
If you have less than 11 pupils who took the KS2 assessments, then the school level data will not be published publicly, and won’t form part of any decisions for any intervention or coasting school definition.
2. Add on any special consideration uplift that you were granted
If you applied for special consideration at the end of SATs week for any of your pupils, and were successful, it’s important to note that the scores reported on NCA tools do not take this into account. The + next to a pupil’s name reminds you of who qualified for special consideration, and these children need 3 added to their scaled score before calculating what that is.
3. Look closely to see if you need to submit any marking reviews
It’s only natural that during the massive task of marking hundreds of thousands of test scripts, some mistakes will happen. To help address this, schools can apply for pupils scripts for a particular subject to be reviewed and marked again, if they feel there is an error in the marking that will impact the pupils scaled score.
It’s certainly worthwhile looking in detail at the scripts (which can be downloaded from NCA tools) of any pupil who has a scaled score of 98 or higher.
Go through their papers against the published mark scheme, making sure you agree with the marking decisions.
Especially make sure that all of the page has been taken into account, including working etc. that is outside the answer area as this is the most common reason for marking mistakes.
Don’t forget: SATs papers marking errors can go either way!
You should also note any marking errors that go in your favour (these do happen!). These need to part of your decision making process for whether to submit a pupil’s paper for review.
If you feel you have found mistakes that would make a difference to a pupil’s scaled score you should know that if you submit it, all 3 papers will be remarked, and this can, in rare cases, lead to the marks going down! Being aware of the points you may lose as well as win is key here!
There is also a cost associated with the review if there has been no change to the marking decisions.
Results for any remarks will be published at the start of September.
4. Make sure you know how you compare to the national data
It almost goes without saying that you then need to look at how your school level percentages for the combined reading/writing/maths expected standard, alongside the expected standard levels for each individual subject, compare to the national figures.
Remember to take into account any special consideration and children who will be disapplied into account when calculating your percentages.
Of course, whilst it is important to see how you compare nationally, remember the smaller your cohort, the less statistically relevant the national data is.
Predicting progress scores from your KS2 SATS results 2018
After you’ve looked at attainment, you may want to begin to attempt to predict what your school level progress scores will be. School progress scores are calculated based on an average of each pupil’s progress scores, but the progress score measure is only statistically reliable as a school average, so individual scores should not be reported to parents.
The methodology for calculating progress scores is a subject for another blog post, but in brief remember:
• Each pupil is put into a Prior Attainment Group (PAG) based on their KS1 point scores. The way KS1 point scores are calculated remains the same each year. The PAGs themselves changed in 2017 (they added more PAGs in to make it more reliable) but are likely to stay the same for 2018.
• Each PAG is then given an average scaled score. This is the actual average of the scaled scores of all children nationally who fit into the PAG.
• The individual progress scores are all totaled per subject, and divided by the number of eligible pupils (i.e removing those that have been disapplied) to give the school average.
• You can only make a rough prediction at this stage, as the tables which give the average scaled scores for each PAG will not be published until at least October. You can find the latest tables and data here.
• There has been some variance between the 2016 and 2017 averages for each PAG, but when taken as an average across the school, it is likely that predictions made based on 2017 average scaled scores can be made with a fair degree of accuracy.
What about pupils with negative progress scores in KS2 SATS?
Earlier this year that the DfE mentioned that they are putting in steps measures to help reduce the impact of pupils with disproportionately negative progress scores (i.e. those who scored highly at KS1 but significantly below national standard at in 2018 KS2 SATs). This will be in the form of ‘cap’ on how negative an individual progress score will be.
The exact details of this cap will be revealed when the 2018 Technical Guidance is updated to include the average scores per PAG. For the time being, it’s worthwhile remembering that this will exist, but know that it is likely to only apply to a small number of pupils.
The two important measures in KS2 SATs – Floor Level and Coasting
Once you’ve got a handle on your school data, it’s likely that school leaders at least will want to look at these in relation to the two ‘important’ measures for school accountability – the floor level and coasting school definition.
Is your school above the floor standard?
The definition of what makes a school is liable to change each year, but has remained constant in 2016 and 2017, so it is likely that any change will be minimal.
In 2016 and 2017, schools were ‘above’ the floor standard if:-
• At least 65% of pupils meet the expected standard in English reading, English writing and mathematics (combined); or
• The school achieves sufficient progress scores in all three subjects. Sufficient progress has been defined in the past as at least – 5 in English reading , – 5 in mathematics and – 7 in English writing
If you school doesn’t meet either of the criteria above, they will be classed as ‘below floor’, which will flag the school to the local authority (if they are a marinated school) and/or regional schools commissioner. Remember, despite what it may seem like, intervention based on being below the floor is meant to designed to help and support schools.
Are you likely to meet the coasting school definition?
The 2018 definition for a ‘coasting’ school is due to be published in October, however for the past 2 years it has remained unchanged, so it is a fairly safe bet that there will be very little change to this definition this year.
Remember schools are only classed as ‘coasting’ based on three years of data.
In the 2016 and 2017 assessments schools were classed as meeting the coasting definition if:
Fewer than 85% of pupils achieved the expected standard at the end of primary schools and average progress made by pupils was less than -2.5 in English reading, -2.5 in mathematics or -3.5 in English writing.
How to interpret the data from the 2018 KS2 SATs results for your school
So have a look at your 2018 attainment data, and any predictions you have made for your progress data. Does this mean that, when taken into account with your 2016 and 2017 results you will be classed as ‘coasting’?
If your 2016 results were fine, but your 2017 results met the definition and you predict you will meet the definition in 2018, you must now consider what steps you will put in place to make sure you do not meet the coasting definition in 2019.
At this point you need to either take a complete overhaul of your whole school maths strategy or seek an effective intervention. Many schools in this situation use Third Space Learning’s maths intervention to make an immediate dramatic impact on their SATs results for the following year, particularly with the borderline and below ARE pupils.
Likewise, if you were fine in 2016 and 2017, but your results mean that you will likely meet the definition in 2018 then you need to consider if this was a one off ‘blip’ in a cohort, or a wider school issues, and then what steps you need to put in place.
Schools in this situation effectively have two years to pull the results around ie both 2019 and 2020 results need to fit the coasting criteria for the school to be classed as coasting in 2020.
Look for patterns and ‘messages’ from your KS2 SATs results data
It goes without saying that it is then important to look at your school level data, including any progress predictions you may have made, and see what ‘messages’ they are sending.
Three key questions to ask:
1. Is there only one subject where your results do not meet or exceed national averages? If so, if this a pattern from previous years, or something new for this year?
2. Is there one subject which is impacting on children gaining expected standard across all 3 subjects? For example, do you have a disproportionate number of children who gained expected standard in Reading and Writing but not in Maths? If so, consider how you will track this for your 2019 cohort to make sure this does not become a pattern.
2. Is there a gap between attainment of any key groups? (i.e. boys/girls, Pupil Premium/Non Pupil Premium, Girls/Boys). If so, how can these effectively be addressed?
Once you’ve analysed your data and have looked for patterns, make sure you learn from it!
Consider what you need to put in place to help improve (or maintain) your results for future years.
Remember, the KS2 SATs are a measure of the whole of KS2, not just Year 6 – so any issues you have identified, and/or changes you make, need to take place across all of the school to have a real impact at the end of KS2.
Support your staff regardless of your KS2 SATs results in 2018
Remember, before thoughts turn to reporting to parents and letting children know their test scores, key staff members will need their school leaders’ support. If the 2018 SATs results are good, then there is cause to celebrate. Your Year 6 team deserve a pat on the back, at the very least!
If the results are not as expected or desired then, putting aside personal thoughts and feelings, it is a leader’s responsibility to help staff come to terms with disappointment first and foremost.
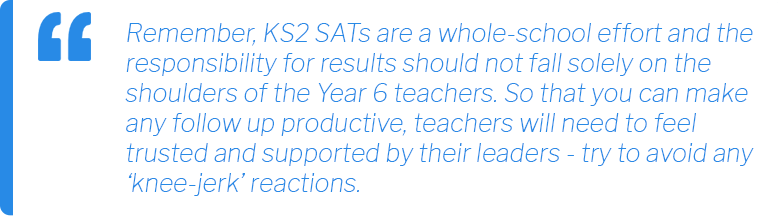
Remember, KS2 SATs are a whole-school effort and the responsibility for results should not fall solely on the shoulders of the Year 6 teachers. So that you can make any follow up productive, teachers will need to feel trusted and supported by their leaders – try to avoid any ‘knee-jerk’ reactions.
Download our free wellbeing SATS resource for teachers, pupils and parents for advice on taking a positive emotionally healthy approach to SATs.
Reporting KS2 SATs results to children and parents
Naturally, children will want to know their scores, and remember that schools are legally required to provide a written report which includes results of national curriculum tests (including the scaled score and measure of if they have met the expected standard or not) alongside teacher assessment judgments.
It is also a legal requirement that you provide enough time for parent to have the opportunity to discuss the results if they wish, meaning in reality that the results need to be sent out by the end of the week they are released.
For more guidance on the legal obligations see section 9 of the 2018 Assessment and Reporting Arrangements.
What else can you do for your Year 6 pupils?
Beyond the statutory letter, it is up to individual schools what else they do. Some send a more detailed letter, often explaining the role SATs tests have and how they are only part of the picture.
In other schools Year 6 teachers release time to sit with each child and explain their test results alongside teacher assessment data. This gives staff an opportunity to show their children that the test is not the be-all-and-end-all. It also lets them show them how what they know of the child throughout the year matters too – but it is important that this is done on the same day (not before) that the results go out to parents.
And finally – look on the bright side of your 2018 KS2 SATs results!
When results come out, especially if they are less than ideal, It’s easy to forget to look for the positives. However, positives will be there! Look at successes for particular individuals or pupil groups, or certain complete tests that have gone well for your cohort – these will all provide reasons to celebrate.
Remember, any more negative trends can begin to form part of your plan for next year. It’s an important not to just focus and dwell on what went wrong, but to think forward to how to do it right next time.
Of course, if your results are fantastic, then make sure you shout from the rooftops about them!
DO YOU HAVE STUDENTS WHO NEED MORE SUPPORT IN MATHS?
Skye – our AI maths tutor built by teachers – gives students personalised one-to-one lessons that address learning gaps and build confidence.
Since 2013 we’ve taught over 2 million hours of maths lessons to more than 170,000 students to help them become fluent, able mathematicians.
Explore our AI maths tutoring or find out about year 6 SATs for your school.


![The Top 20 SATs Revision Topics For 2026 [Video]](https://thirdspacelearning.com/wp-content/uploads/2026/01/SATs-webinar-2025-social-image-6-1024x576.png)