
What The PISA Results Tell Us About Maths In England And The Rest Of The UK

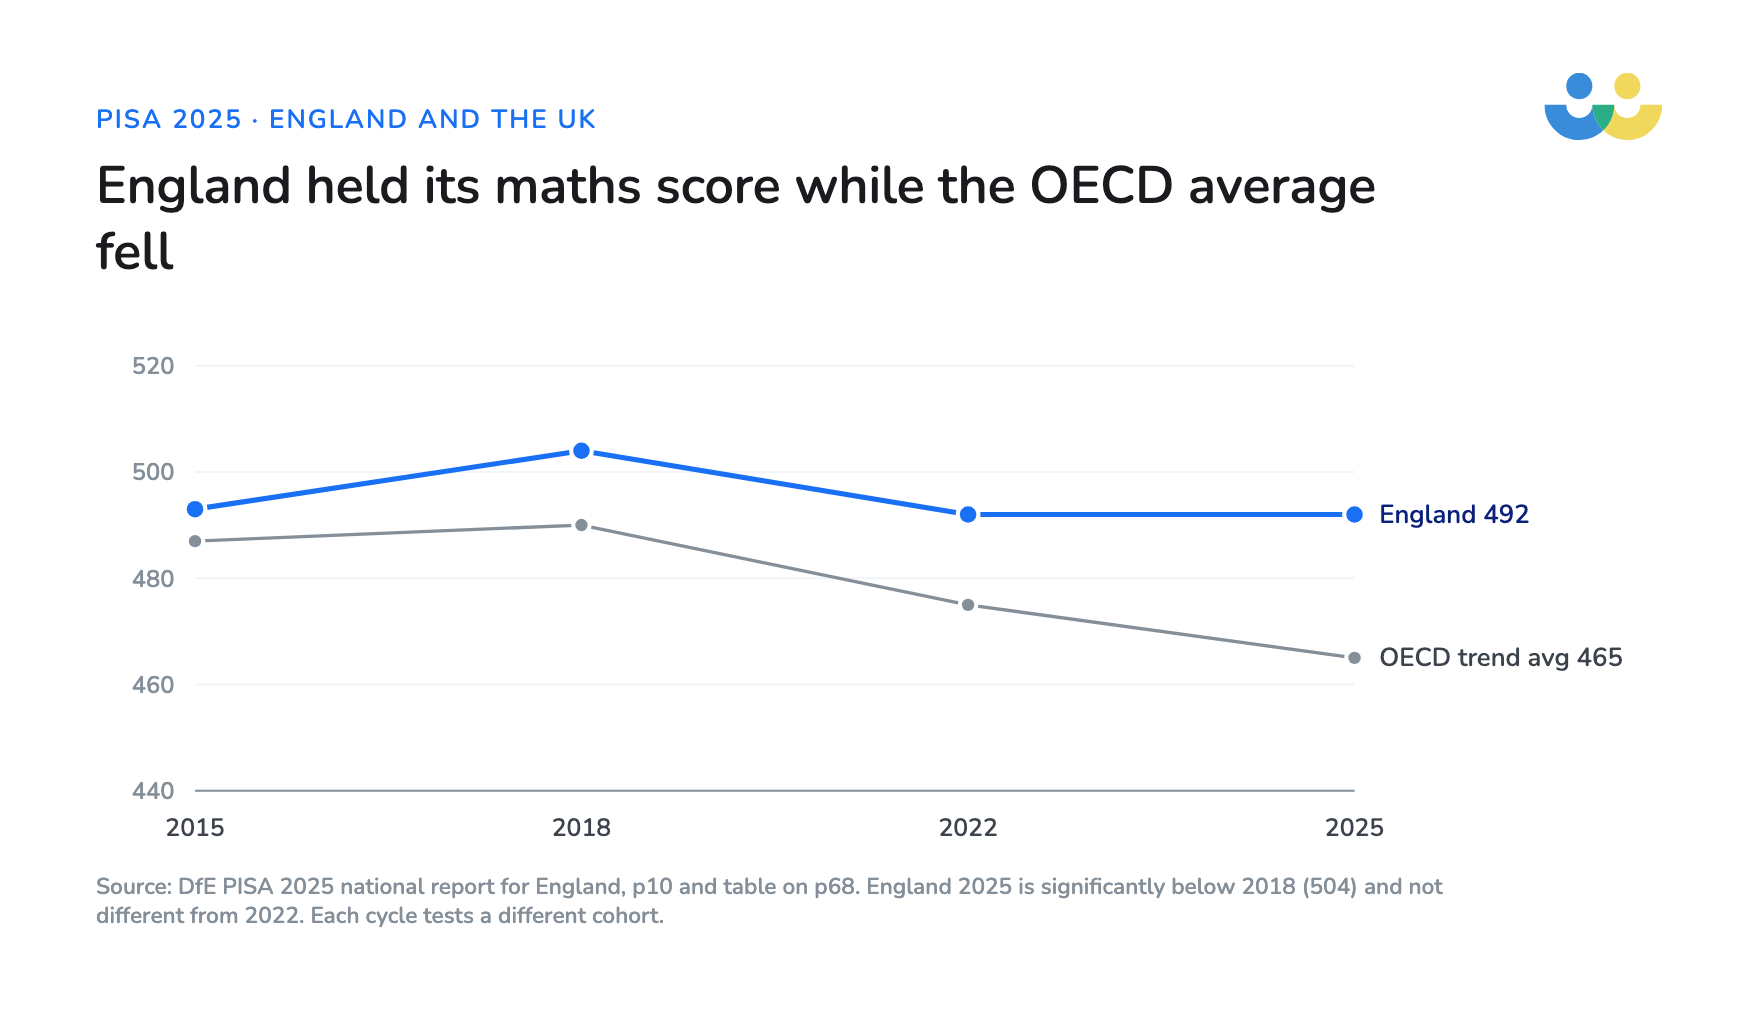
In the PISA 2025 results, published in September 2026, the UK came 10th of 91 education systems in maths. England’s 15-year-olds scored 492, against an OECD average of 463.
As most schools will know by now, what actually happened wasn’t that our maths results got demonstrably better, but while scores fell in most of the places we compare ourselves with we held steady.
Given what teachers and schools have been through with a pandemic and several years of tight budgets this is still a result to be proud of. Credit goes to the maths departments and primary schools that kept it all together and kept pupils learning.
However when we start looking in more detail at the data, we see that there are still some improvements to make: the distance between our highest and lowest attaining 15-year-olds is now the widest for England in PISA since 2015, and the pupils at the bottom have fallen further behind since 2018.
As the founder of a tutoring company, I am not a neutral reader of this data, but I think it is the gap that is most revealing about education in the UK at the moment, rather than our ranking in the table.
Key takeaways
- The UK came 10th of 91 in maths. England held its score at 492 while most systems fell, so we rose up the table.
- The gap between England’s top and bottom tenth of pupils is 268 points, the widest since 2015. Since 2018 the bottom tenth has fallen 24 points while the top tenth has held steady.
- England’s most disadvantaged pupils outscore the equivalent group in most other countries. Our gap is wide because our most advantaged pupils do even better.
- England’s most disadvantaged quarter of pupils scored about the same as the average pupil in Wales.
- One in four 15-year-olds in England is below the baseline level for using maths in everyday life.
First, a bit of background.
What is PISA?
PISA, the Programme for International Student Assessment, is an international test of reading, mathematics and science for 15-year-olds. It ran every three years up to 2025, with the 2021 round put back to 2022 because of the pandemic. The next round is PISA 2029. In maths, the average score across the 38 member countries in 2025 was 463.
Where does the UK rank in the PISA results?
Professor Jenni Ingram, who led the national report for England, opened with: “Congratulations and thanks to the pupils and teachers whose hard work sits behind these results.”
England’s schools worked hard to hold the maths score steady through these years.
England scored 492 in mathematics, 497 in reading and 516 in science, with science significantly up on 2022. Nine systems scored significantly higher than England in maths, seven of them in East Asia, and Canada’s score was not significantly different.
| System | Maths score, PISA 2025 |
|---|---|
| B-S-J-Z (China) | 612 |
| Singapore | 563 |
| Macao | 549 |
| Taiwan | 546 |
| Japan | 525 |
| South Korea | 522 |
| Hong Kong | 522 |
| Estonia | 508 |
| Switzerland | 499 |
| England | 492 |
| United Kingdom | 488 |
| Canada | 485 |
| Northern Ireland | 473 |
| Scotland | 467 |
| OECD average | 463 |
| Wales | 456 |
England’s score is the same as in 2022 and significantly below its 504 in 2018. Across the countries tested in every round since 2015, the average fell from 490 in 2018 to 465, so England rose up the table without its score improving. The DfE said as much: “We don’t want to go up in the international league tables solely because other countries are declining.”
How far can we trust the PISA results?
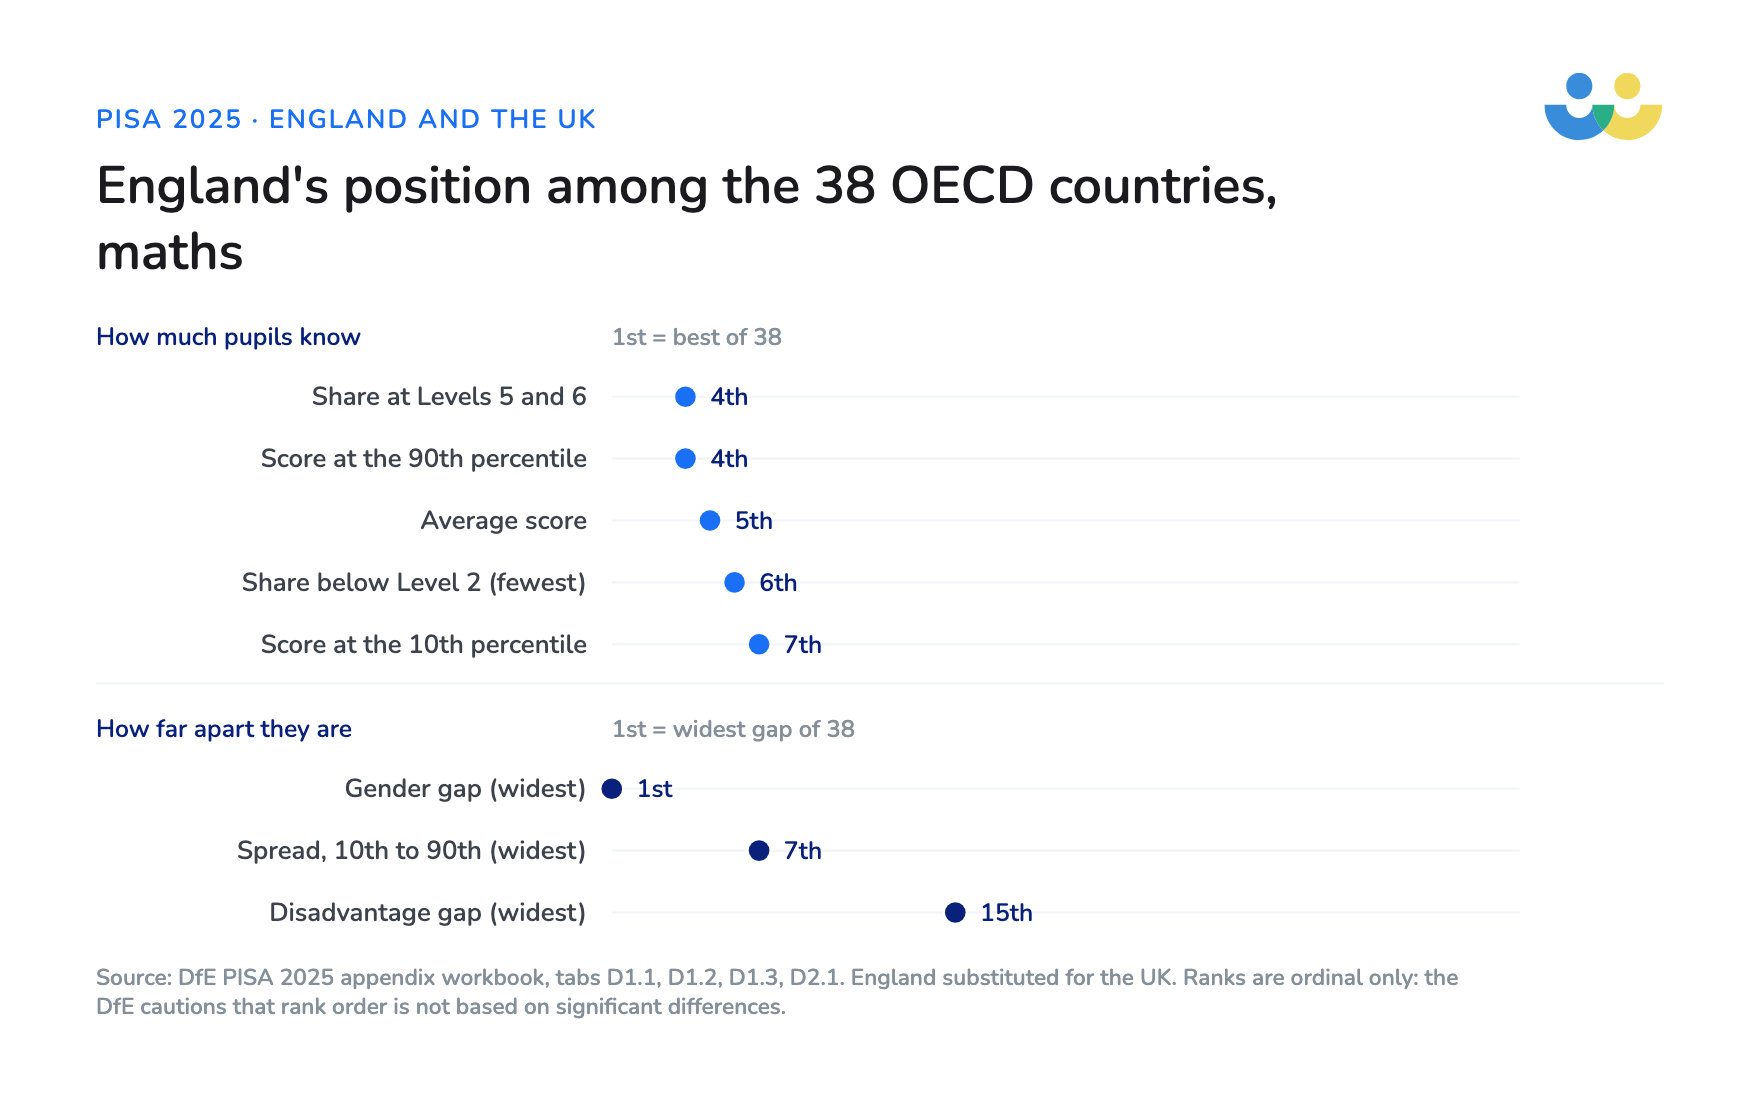
A different group of 15-year-olds sits each round, so any trend line compares different children, and the DfE’s national report says that rank order is not a statistically meaningful measure. The family background index also changed this cycle, so nobody can verify whether England’s disadvantage gap has widened or narrowed since 2022.
The bigger caveat is about who took the test. It skewed slightly towards pupils with fewer academic challenges to overcome.
Some of the pupils chosen to sit the test did not take it, and they were more likely than those who did to have been eligible for free school meals at some point in the past six years (39.6% against 23.8%), to be on SEN support (25.0% against 10.7%) or to have an EHC plan (7.1% against 1.4%). Special schools were not included at all.
This means the pupils who sat the test were a slightly more advantaged group than England as a whole, so the real gap between our highest and lowest attainers may well be wider than the one we see in PISA.
Has the gap between England’s highest and lowest attainers widened?
Yes, it has: in 2025 the top tenth of England’s 15-year-olds scored 627 and the bottom tenth 359, a gap of 268 points, against an OECD average of 244. That is significantly wider than in 2015, 2018 or 2022.
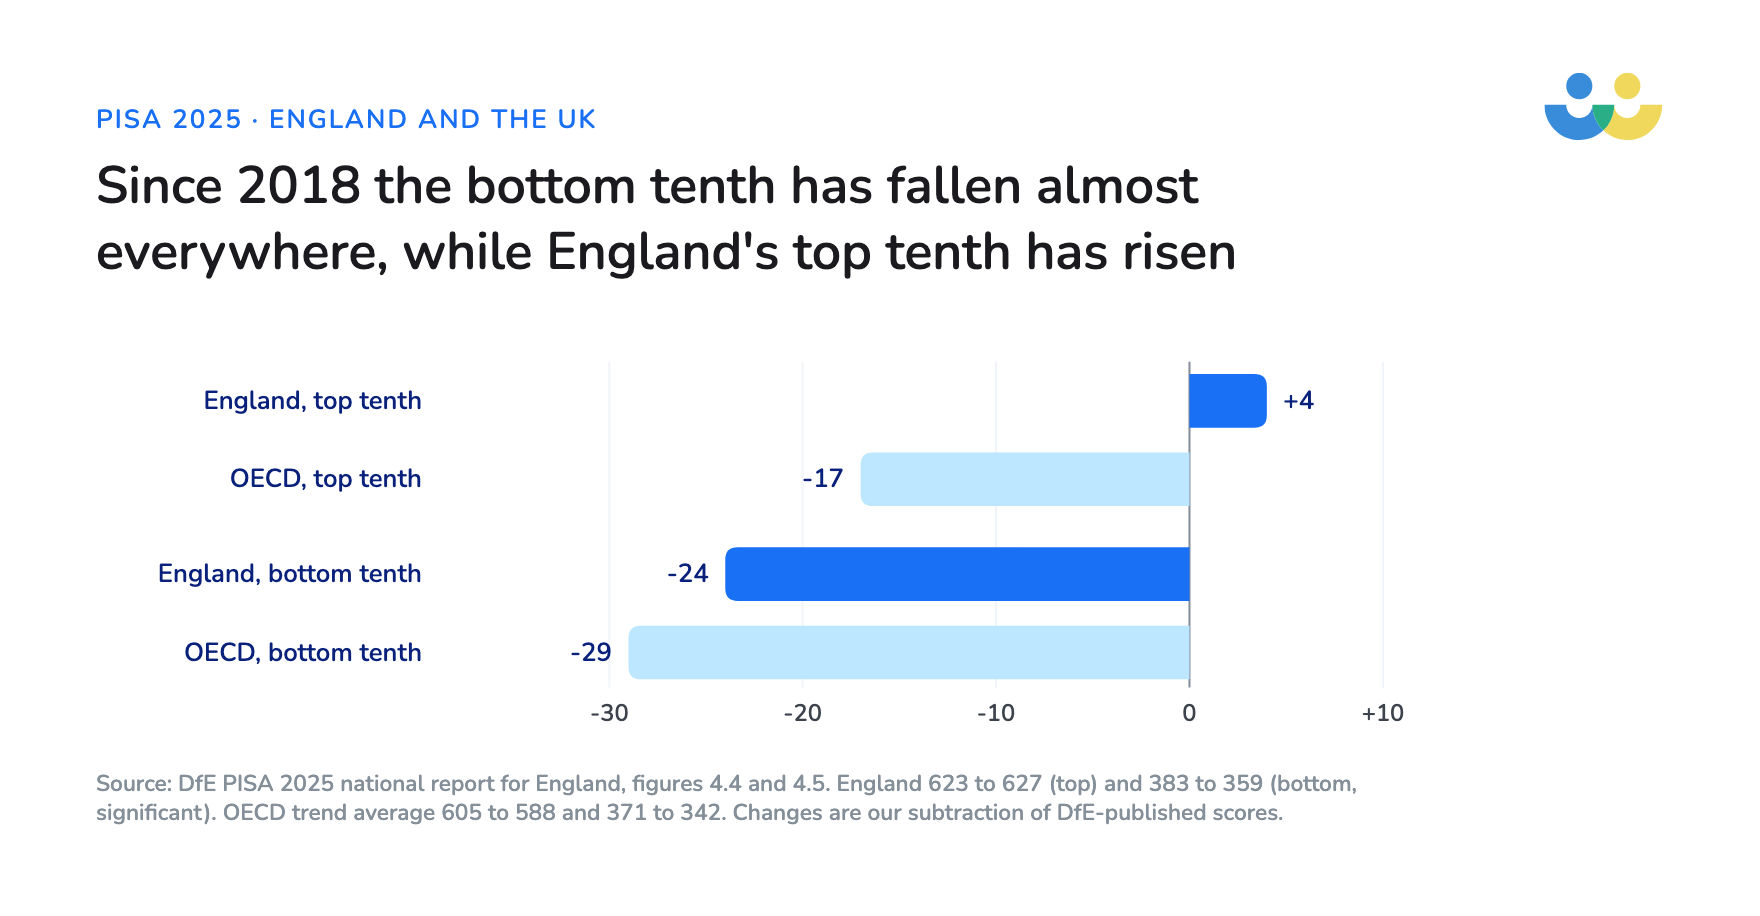
Whether the top rose or the bottom fell depends on the year you start from. Since 2018 the bottom tenth has fallen from 383 to 359, a significant drop, while the top tenth moved from 623 to 627, which is not a significant change. Since 2015 the top has risen significantly, from 613. Since 2022 neither end has moved significantly on its own, but the gap between them has still widened, from 252 to 268 points.
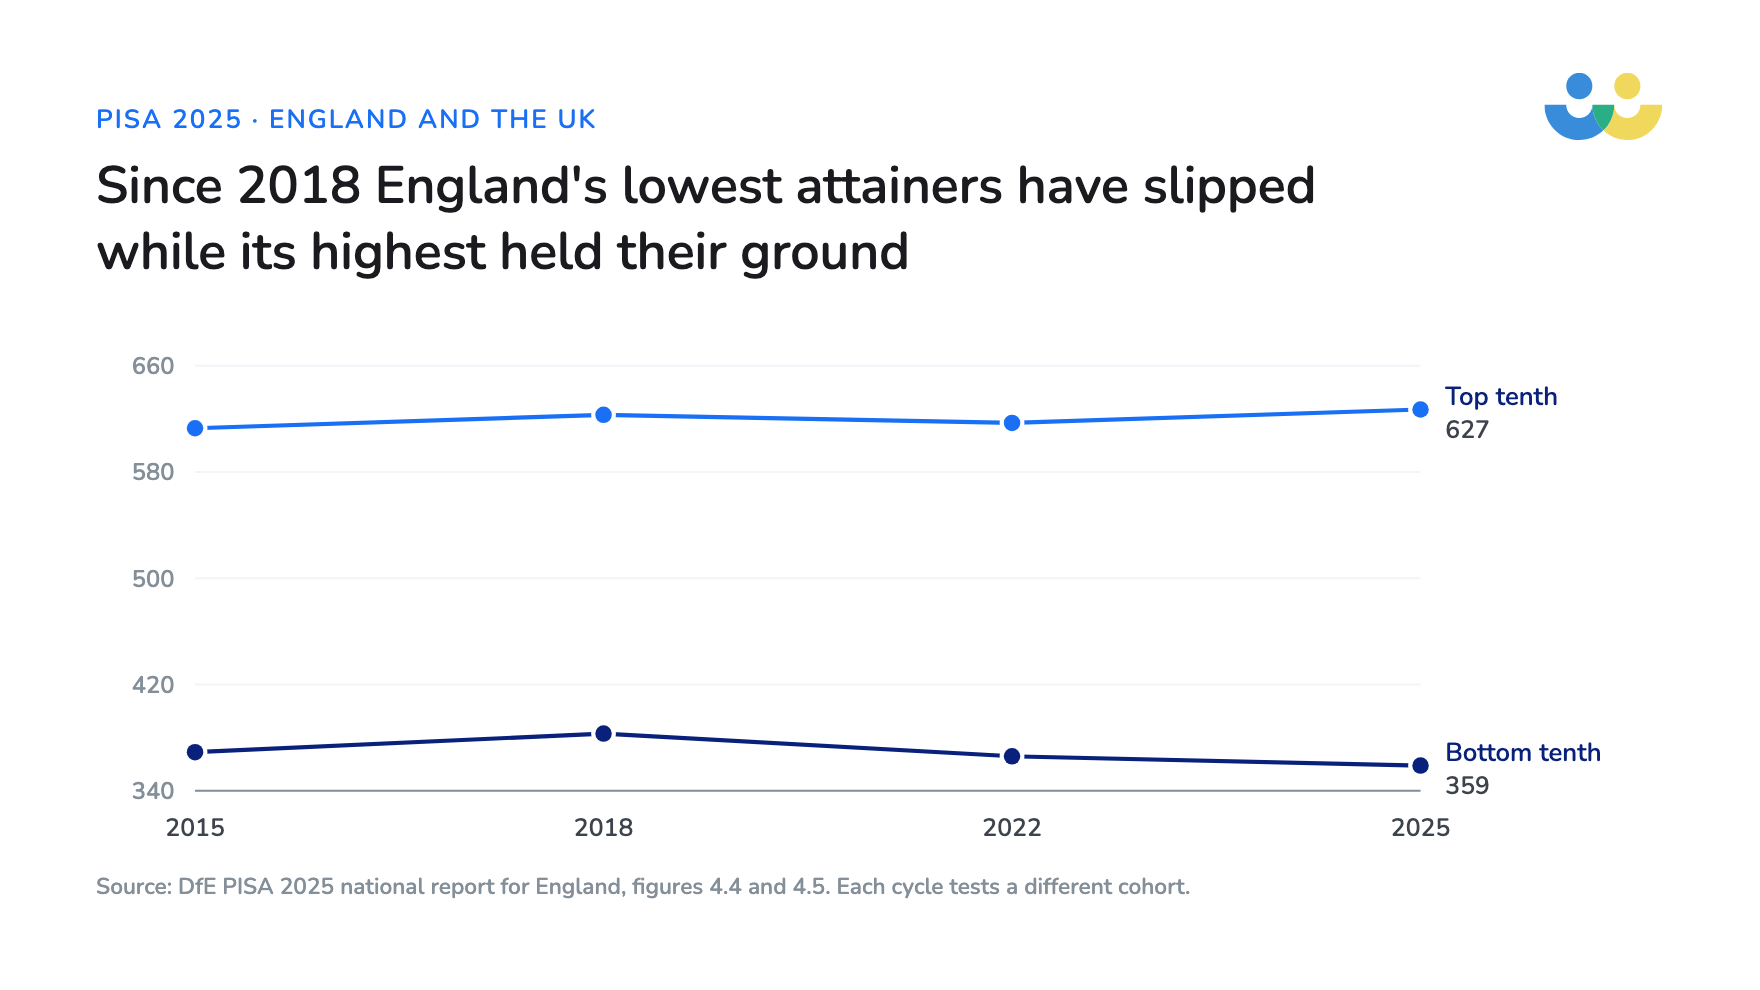
The bottom tenth has fallen almost everywhere: across the systems tested every round, it dropped from 371 to 342 between 2018 and 2025, further than ours. England is more unusual at the top, where our highest attainers rose 4 points when the international average fell 17.
On the rough estimate from the OECD that a 15-year-old in England learns about 27 points of maths a year, the distance between the strongest and weakest 15-year-olds in England amounts to several years of maths disparity.
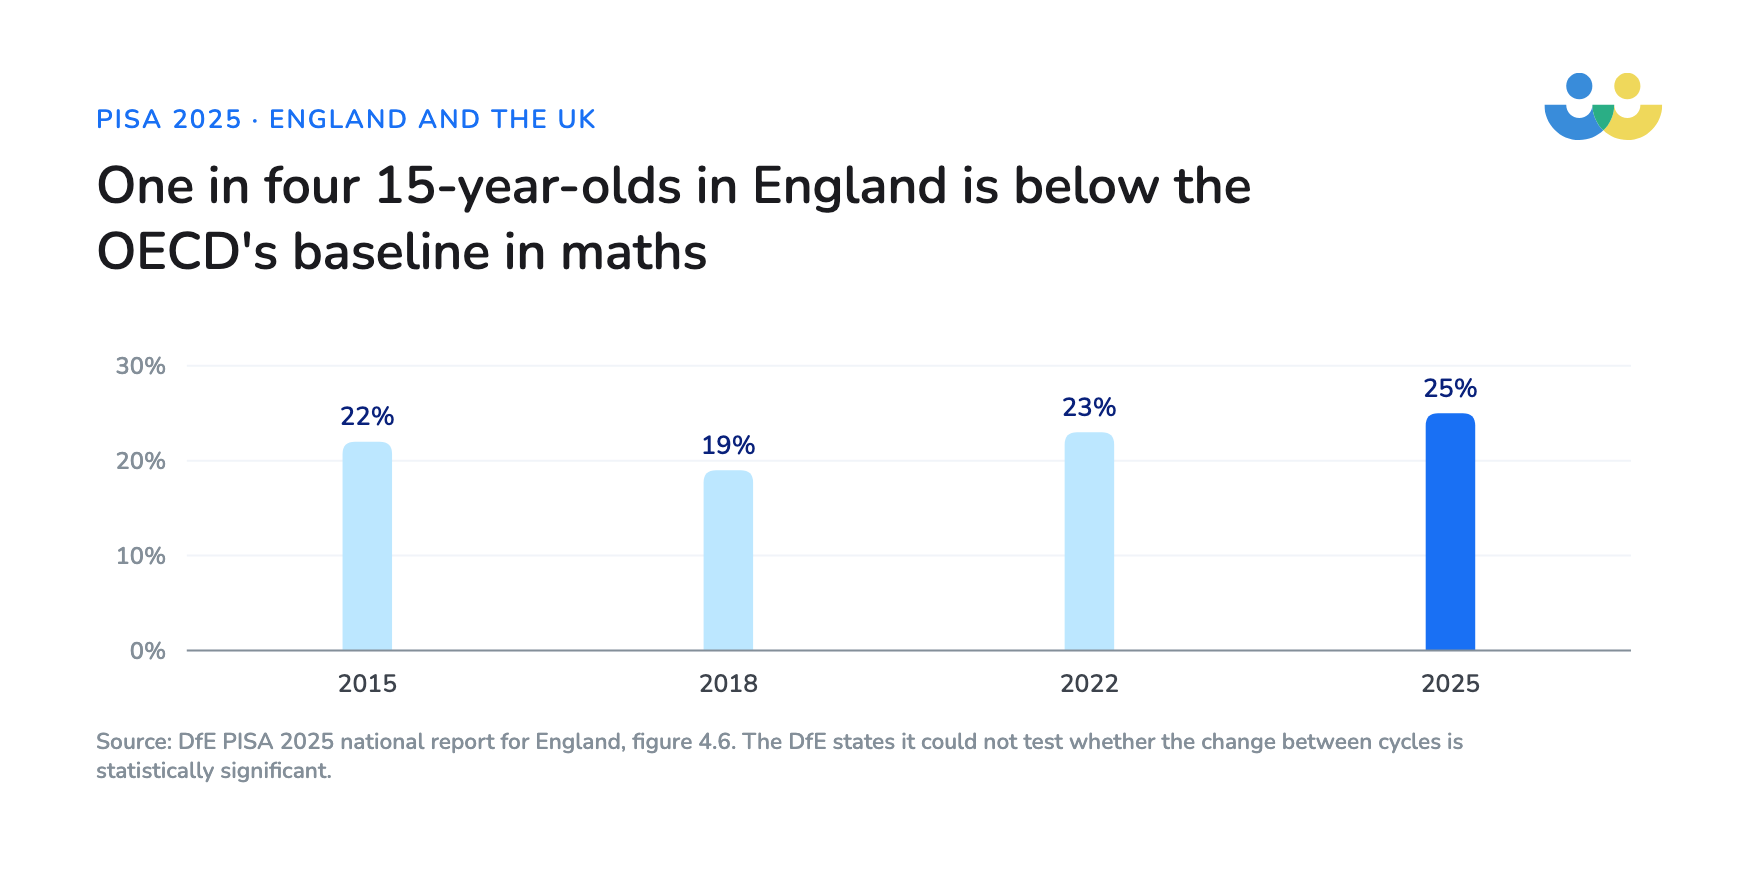
A quarter of 15-year-olds (25%, up from 19% in 2018) are below Level 2, the point at which a pupil can begin to use maths in simple real-life situations. Pupils in that position at 15 usually have gaps in their maths that go back a long way.
How do disadvantaged pupils in England compare internationally?
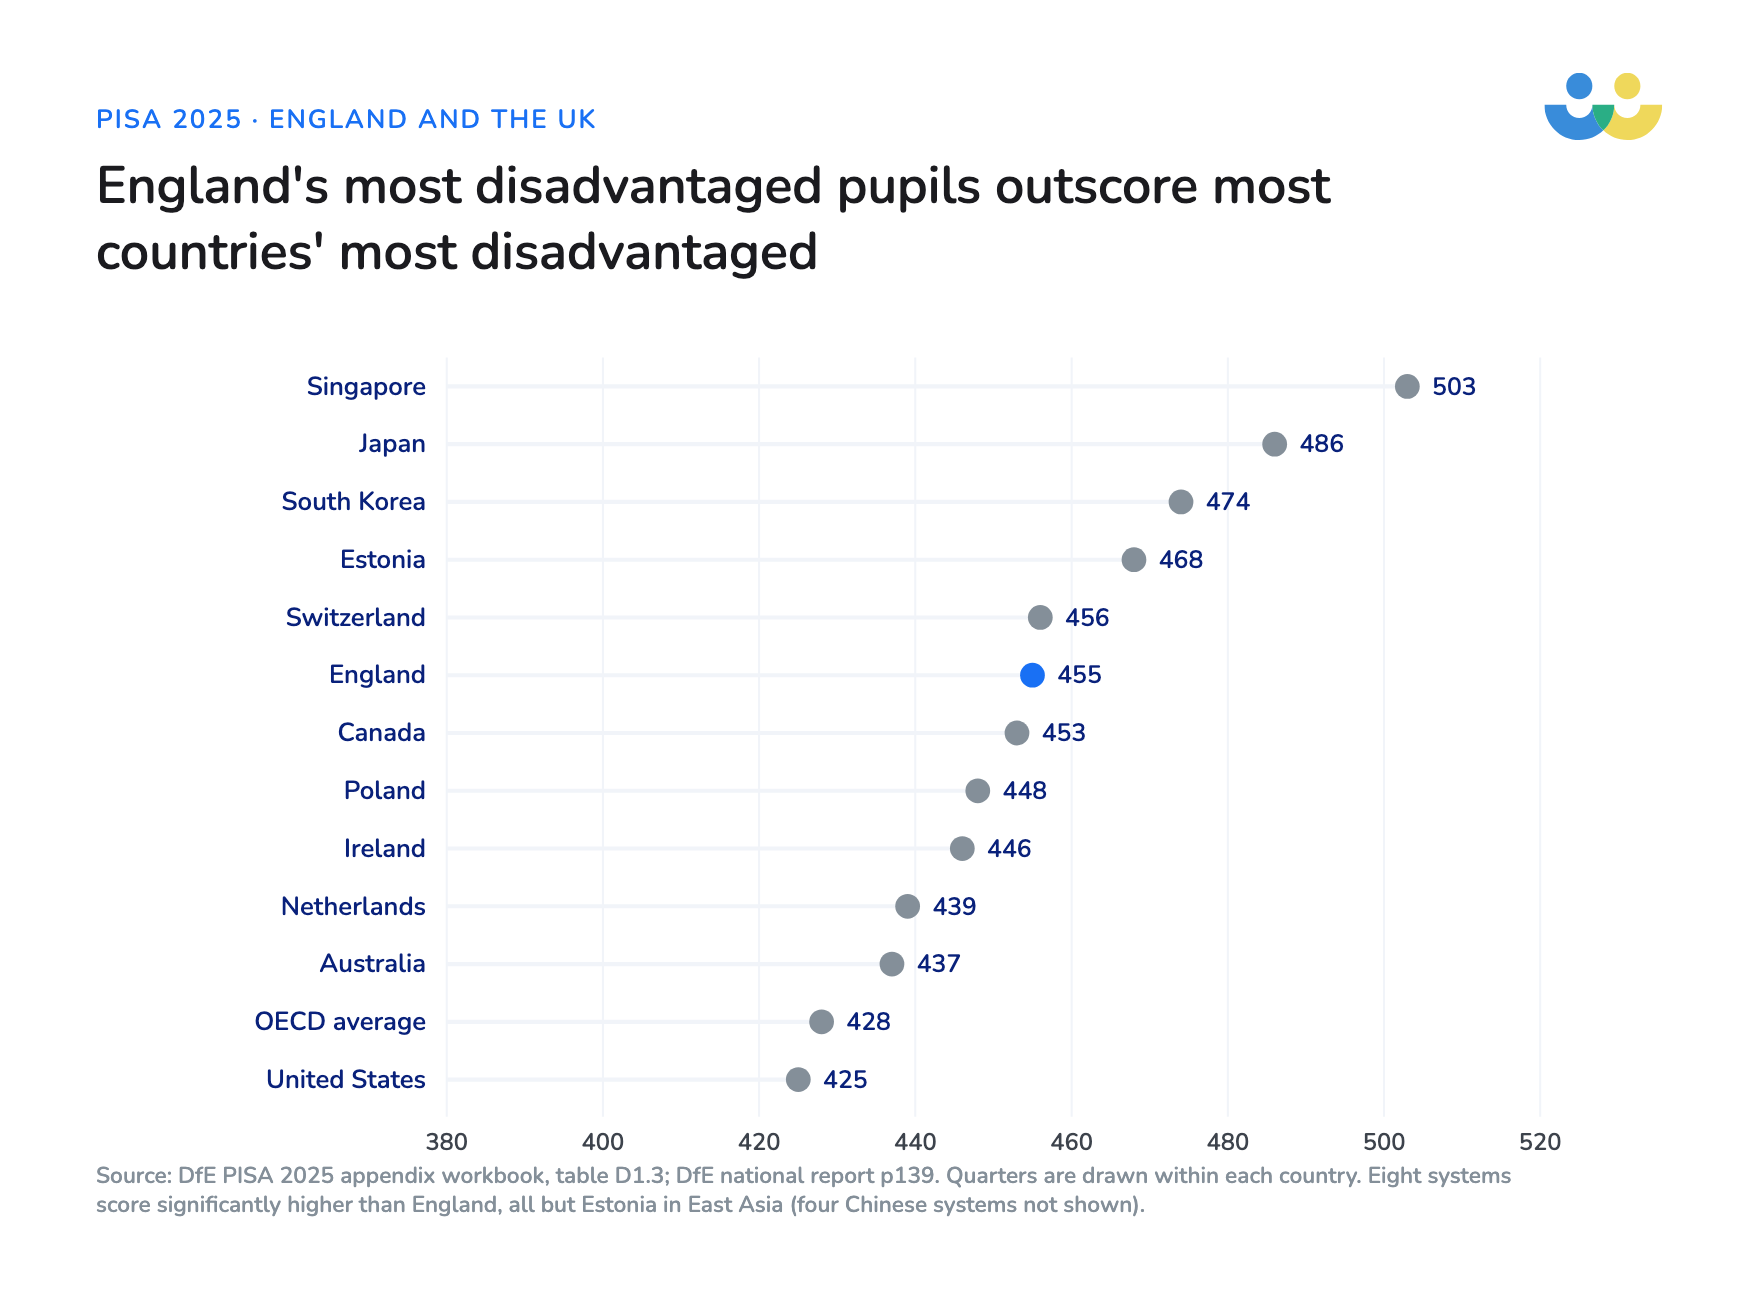
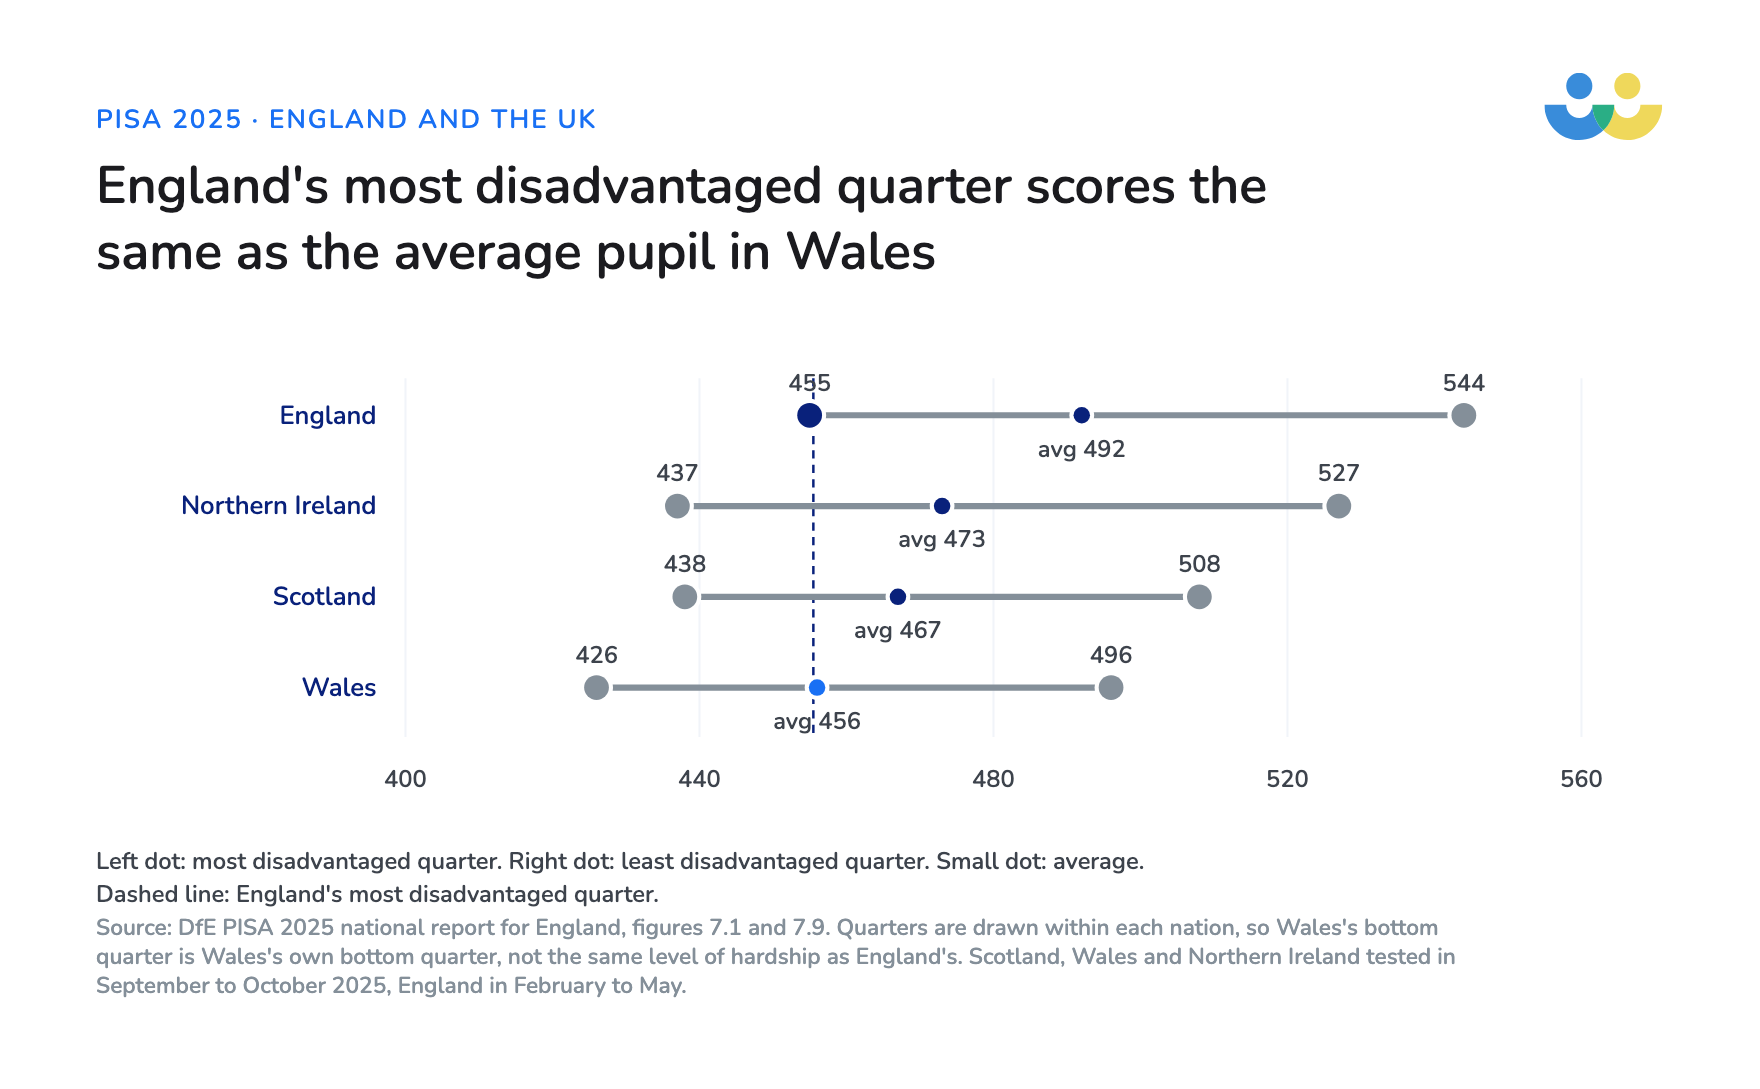
England’s disadvantaged pupils do better than those in most countries. If you split each country’s pupils into quarters by family background, as the OECD does, England’s most disadvantaged quarter scored 455 in maths, 27 points above the OECD equivalent of 428. Only eight systems had a disadvantaged quarter that scored significantly higher, and seven of them are in East Asia.
The eighth is Estonia, and it is the comparison I find most useful. Estonia’s most advantaged quarter scores exactly what ours does, 544. Estonia is 16 points ahead of England because of its pupils further down: its most disadvantaged quarter scores 468 against our 455, and 17% of its pupils are below Level 2 against our 25%.
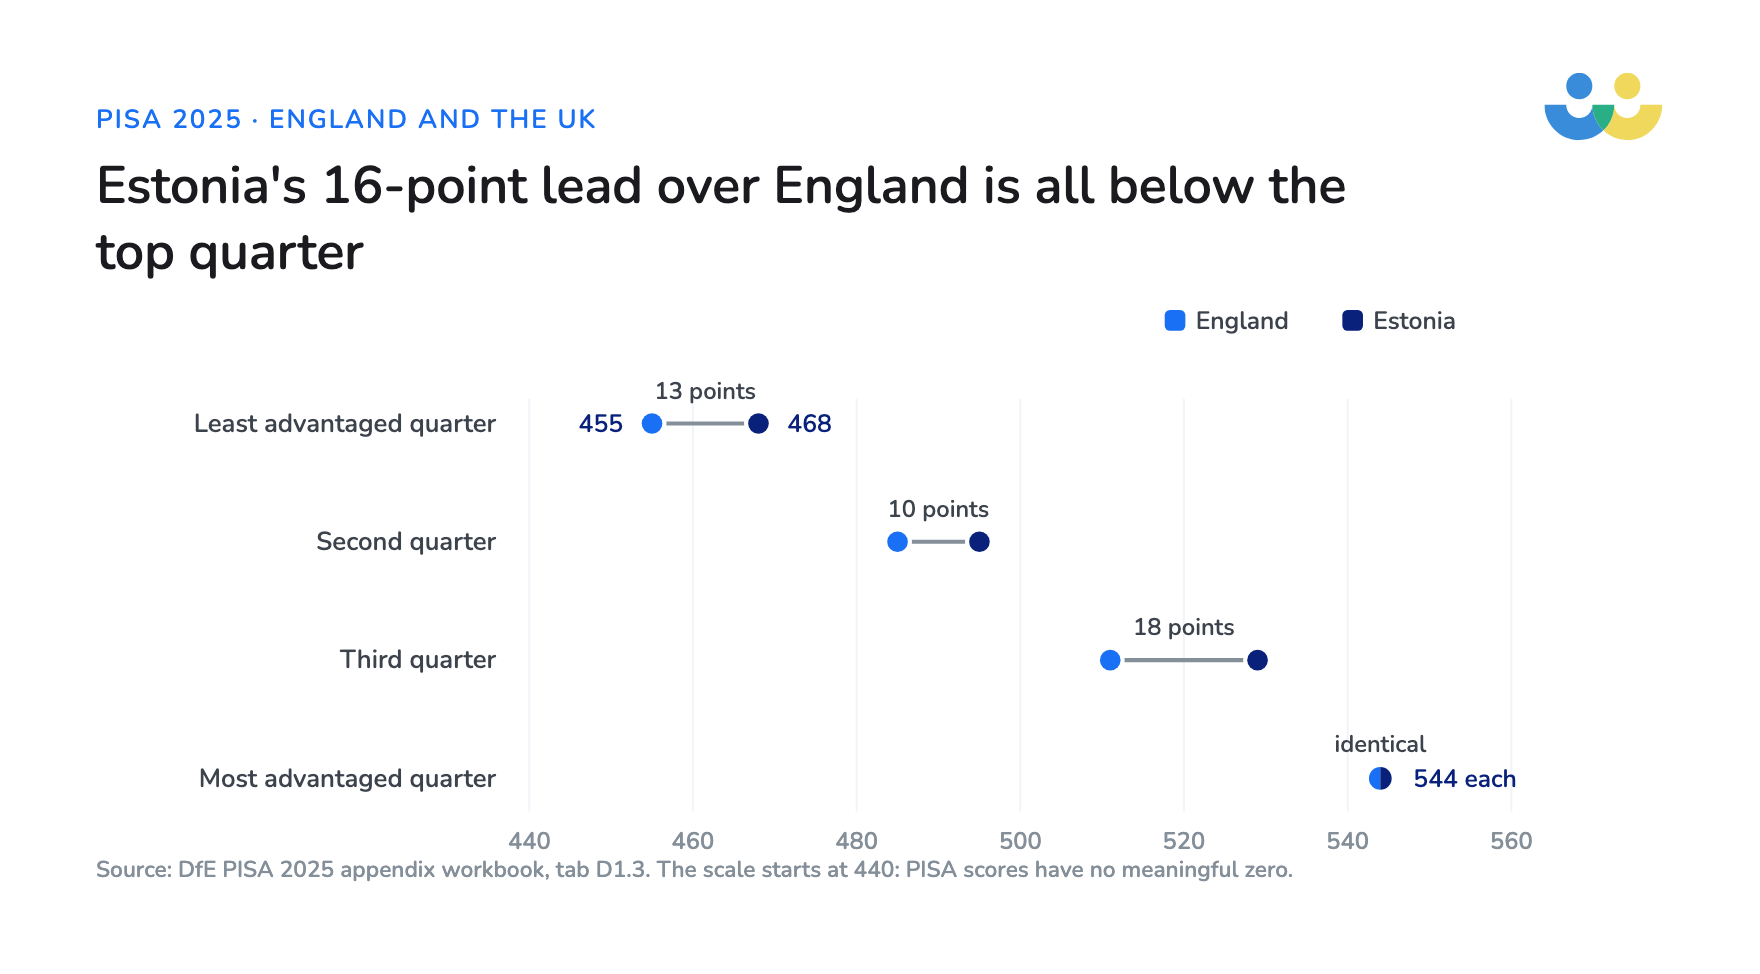
So England’s 89-point gap between its most and least advantaged quarters is wide because our advantaged pupils do so well. That is no comfort if you lead a school where most pupils sit in the bottom quarter. We see the same gap at every stage in England’s own data, which has no sampling problem.
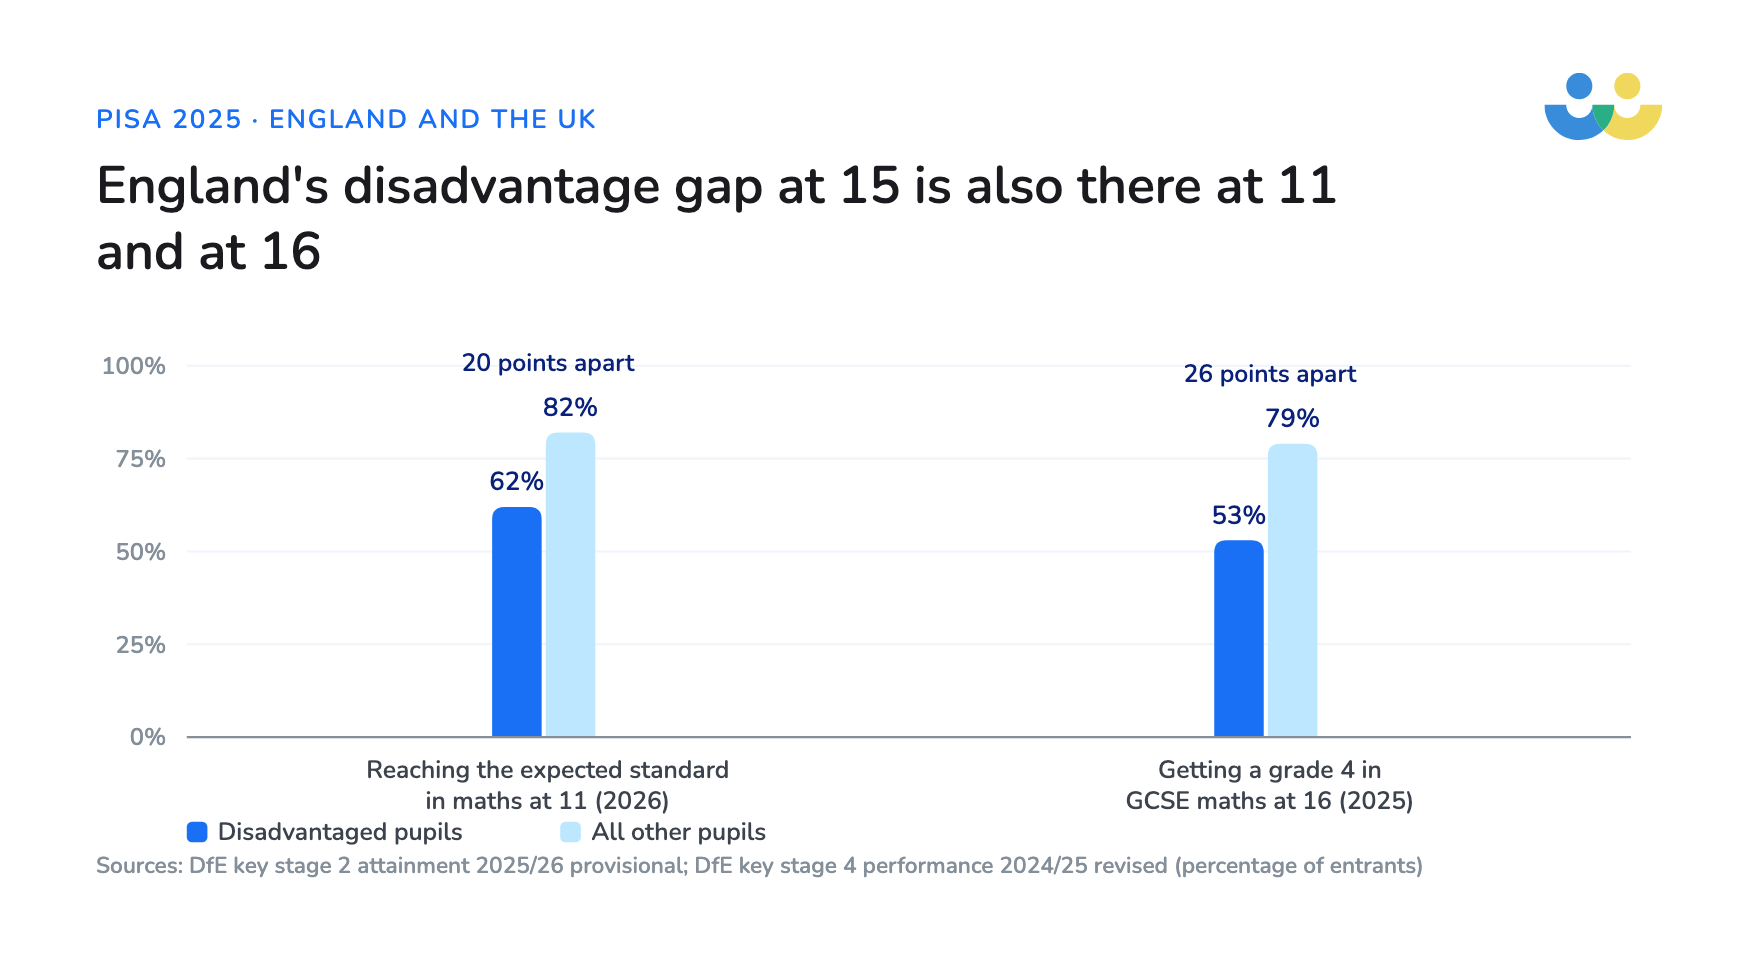
When considering where your intervention need is, it’s worth considering the following:
- At 11, in 2025/26, 62% of disadvantaged pupils reached the expected standard in maths against 82% of their peers, and the gap index widened for the second year running.
- At 16, 53% of disadvantaged pupils entering GCSE maths achieved grade 4, against 79% of other pupils.
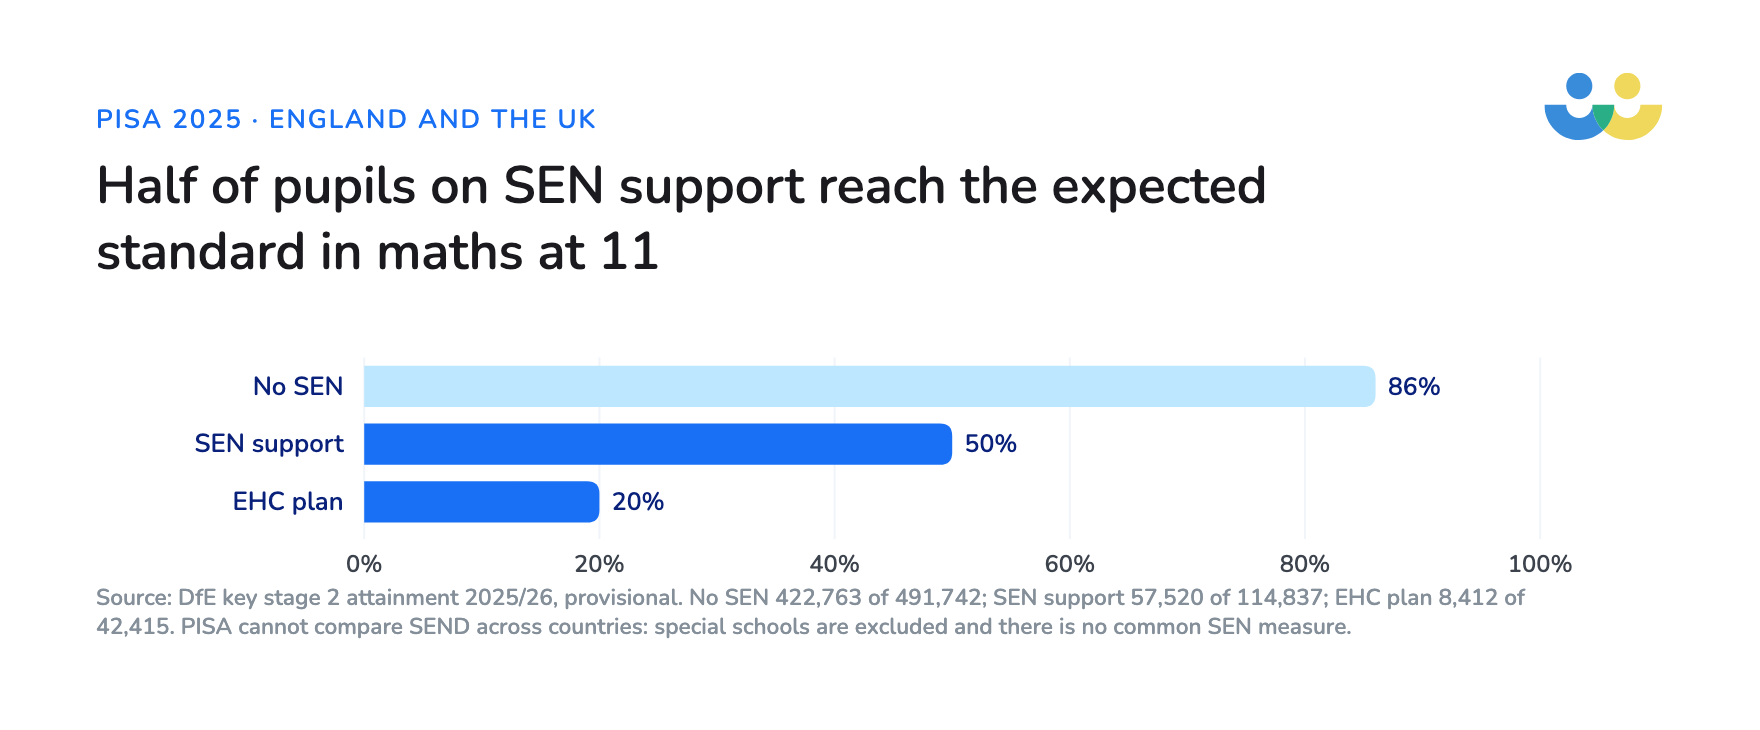
We cannot use these results to compare pupils with SEND across countries, because there is no common measure and special schools are left out. But just in England:
- at 11, 86% of pupils with no special educational needs reached the expected standard in maths,
- 50% of pupils on SEN support and 20% of pupils with an EHC plan reach the same level.
Pepe Di’Iasio at ASCL named this as the biggest challenge in the results: “how we can do better for young people with additional needs”
How does England compare with Scotland, Wales and Northern Ireland?
Within the UK, England was the only nation to hold its maths score, and we cannot put that down to money or poverty. In 2015 all four nations scored between 478 and 493. In 2025 England scored 492, Northern Ireland 473, Scotland 467 and Wales 456, and all three have fallen significantly since 2018.
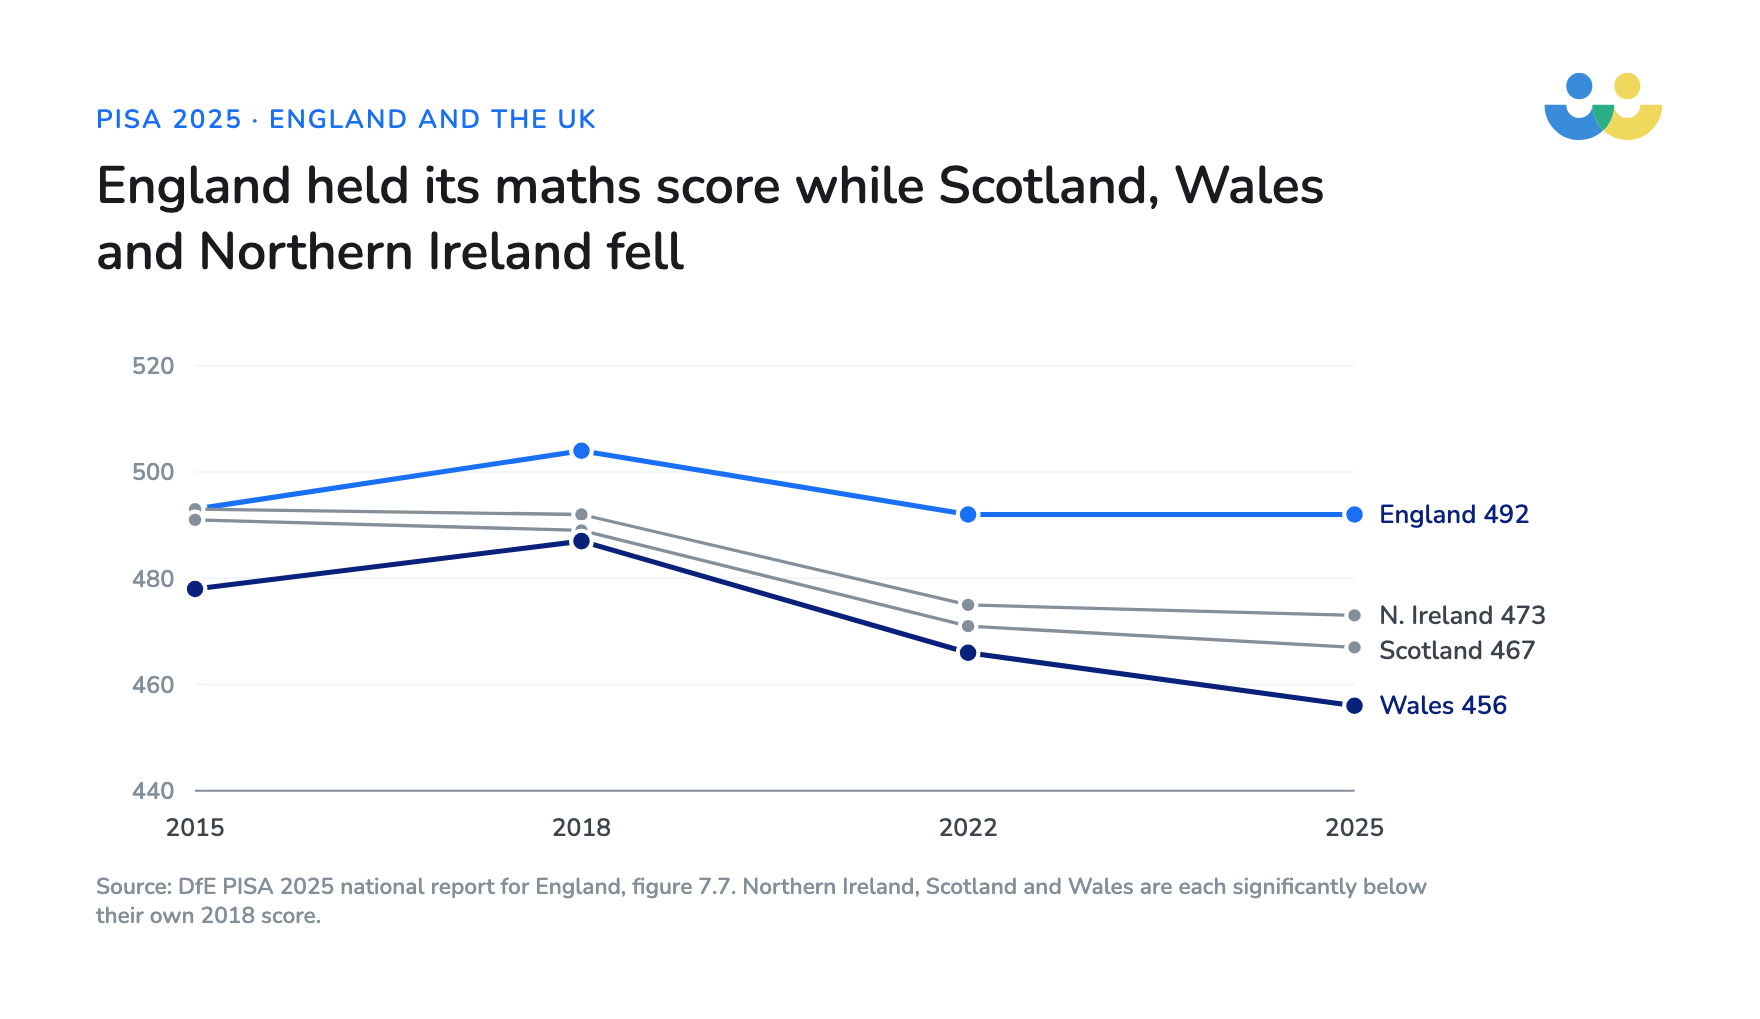
Pupils in Scotland, Wales and Northern Ireland sat the test in September and October 2025 and pupils in England between February and May, and the England and Wales reports both say that pupils’ “educational experiences may have differed” as a result.
Even with that caveat, England’s most disadvantaged quarter scored 455, about the same as the average pupil in Wales at 456. Each nation’s quarters are drawn from its own pupils, so the comparison is about position within each country: the bottom quarter in England is level with the middle in Wales. The Institute for Fiscal Studies made the same comparison in its analysis of the 2022 results.
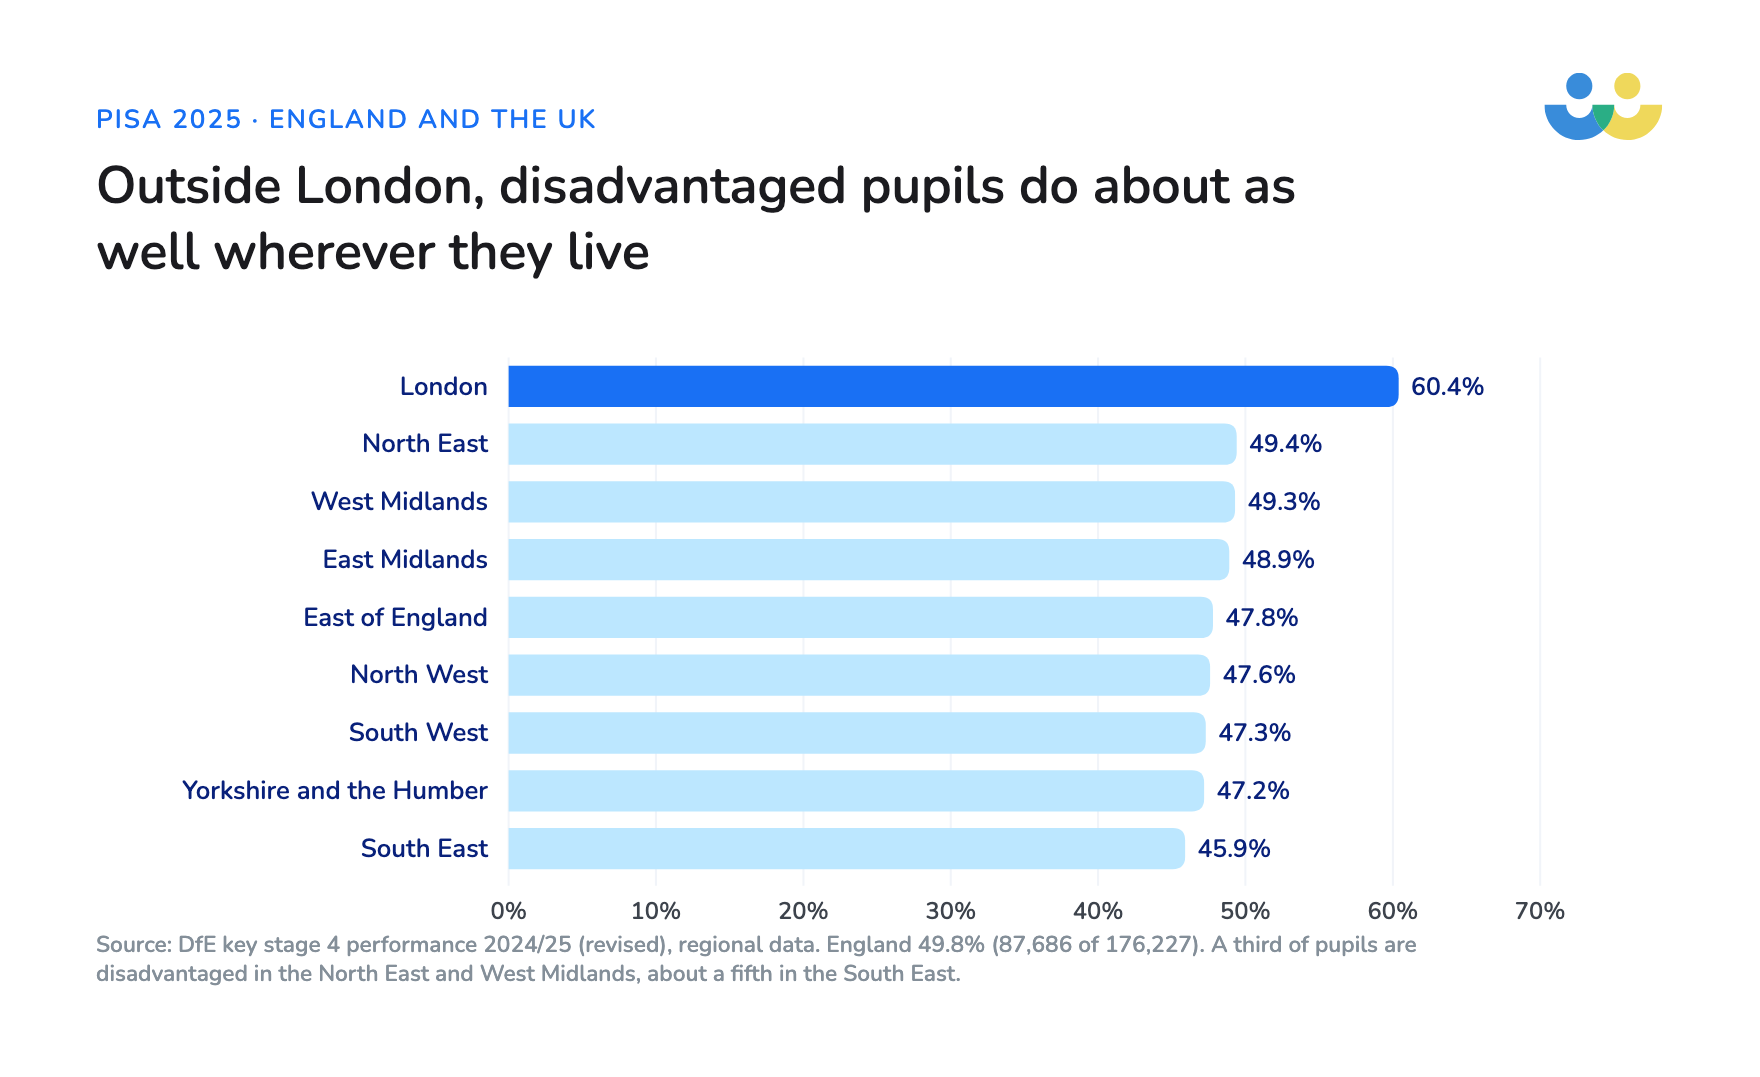
There are no regional results for England, so to see whether pupils in poorer regions now do worse we have to use GCSE data. In London, 60.4% of disadvantaged pupils achieved grade 4 in maths; in every other region the figure was between 45.9% (the South East) and 49.4% (the North East). The regions differ in how many pupils are disadvantaged, from about a third in the North East and West Midlands to a fifth in the South East. Outside London, a disadvantaged pupil does about as well wherever they live.
Is the maths gender gap growing?
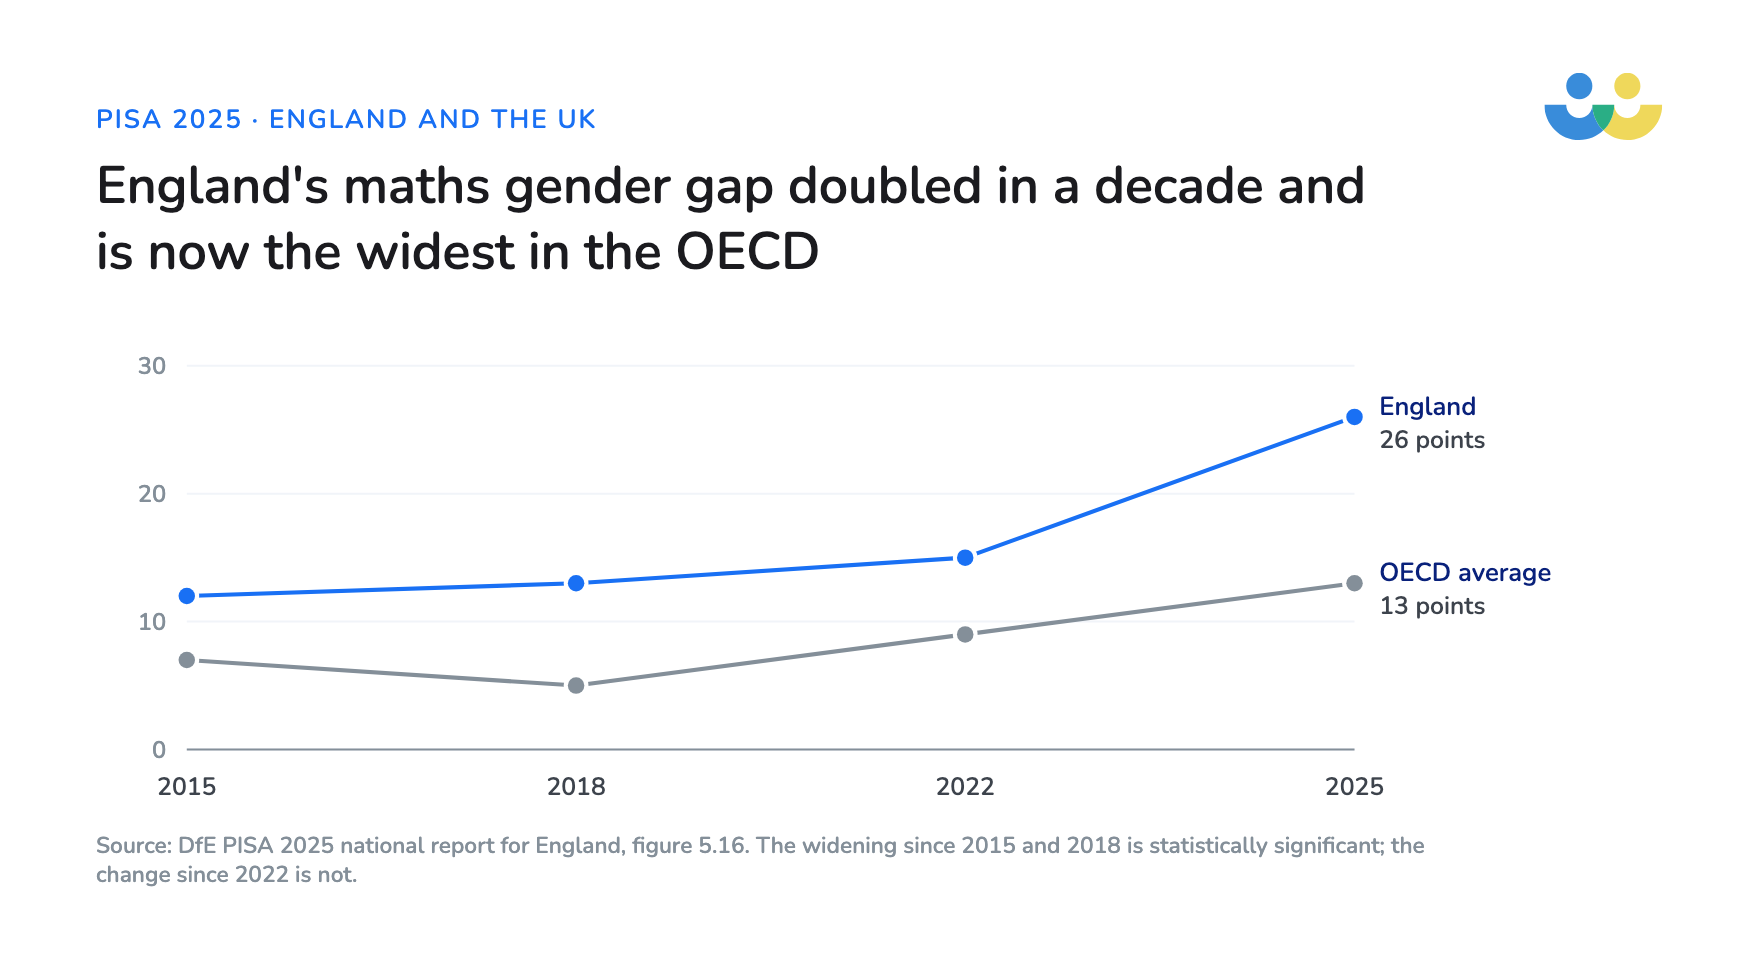
England’s girls scored 478 and boys 504, a 26-point gap and the widest of any higher-performing country. It has widened significantly since 2015 and 2018, though not since 2022, and it is widest at the top: the gap is 38 points at the 90th percentile, against a non-significant 10 points at the 10th.
What has changed since the last PISA?
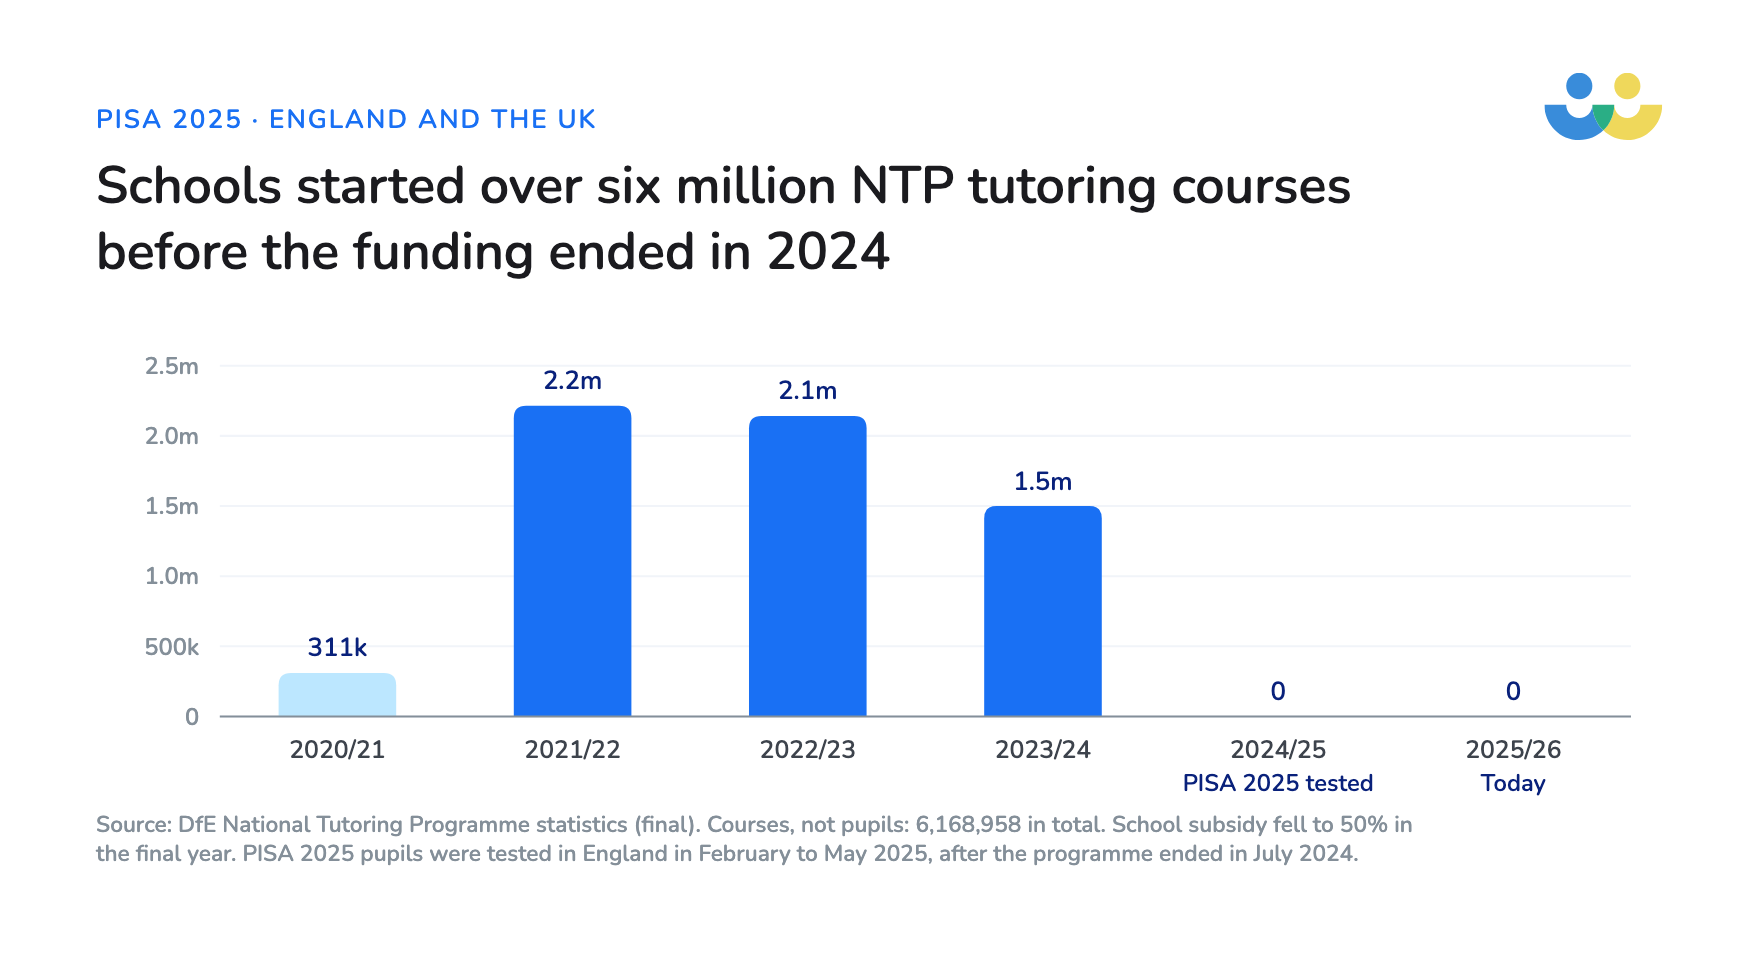
When England’s pupils were last tested in late 2022, schools were in the third year of the National Tutoring Programme. Over four years the government spent more than £1 billion through the NTP on 6,168,958 tutoring courses, and in 2021/22, 87.4% of schools took part.
For all its problems, the NTP was how the government made the EEF’s evidence on effective tutoring (regular, spoken, one-to-one or small-group sessions linked to class teaching) national policy. It was also uneven in its administration: the NFER’s evaluators found impacts of around one month’s progress for school-led tutoring, and no benefit at all from some routes. I do not read that as evidence that tutoring does not work.
If one-to-one tutoring personalised to each child and delivered properly according to everything we know about learning science does not work, it is hard to see how high quality teaching works.
The subsidy fell each year and ended in 2024. In April 2026 the Sutton Trust found that 52% of senior leaders had cut one-to-one and small-group tutoring for financial reasons, and 72% of leaders in former NTP schools were providing “much less tutoring”. The IFS reports that mainstream school spending per pupil is “currently about the same level it was in 2015–16”.
Persistent absence has risen from 10.86% of pupils in 2018/19 to 18.14% in 2024/25, and to 32.35% of pupils eligible for free school meals. In secondary schools, 12.9% of maths hours in 2025 were taught by a teacher with no relevant maths qualification beyond A level, up from 11.7% in 2018 and rising to 16.7% in Years 7 to 9.
We cannot use the 2025 results to judge what losing the NTP did, because the pupils tested in 2025 were in school throughout it and sat the test about six months after it ended. The pupils tested in 2029 will be the first to have gone through secondary school without it.
In 2022 nobody was asking whether an AI tutor could do what a good tutor does. Now the DfE has committed to AI tutoring tools for secondary schools by the end of 2027, and schools are being offered more products with AI in the name than they can possibly evaluate.
So the gap is widening, the pupils at the bottom are falling furthest behind, and schools have less money and fewer specialist maths teachers to do anything about it. We do not have to guess at what would help, because the evidence on effective tutoring has been clear for years.
Schools need a way to give it to every pupil who would benefit, within the budget and staff they already have.
Why isn’t effective maths tutoring look like?
I think it is up to tutoring companies like ours to find that way, and to give more pupils the same evidence-based intervention the EEF describes, more often and for a fraction of what one-to-one tutoring has cost schools in the past.
The EEF puts one-to-one tuition at around five additional months’ progress on average in its Teaching and Learning Toolkit. Pupils eligible for free school meals see the strongest effects, and tutoring works best when it is linked closely to class teaching.
You will know the other half of the problem from your own classrooms, where pupils in the same set can be years apart. In the EEF and UCL grouping study published in April 2026, changing how classes are grouped did not help lower-attaining pupils make more progress either way, so whatever the grouping, the teacher still has a wide range of pupils in front of them. Simrat Mavi, Deputy Headteacher and SEND Lead at St Giles’ CofE Primary School, put it like this:
“I’ve been in the field for a good 20 years to realise, you’ve got 30 different learners at different points, and you cannot plan for every child. So this is about providing teachers an opportunity for children to build up that mathematical fluency. By working with Skye, teachers are then able to target the misconceptions and have a smaller group to teach.”
Simrat Mavi, Deputy Headteacher and SEND Lead, St Giles’ CofE Primary School
The pupils who need help most are often the ones who will not ask a question and find it hard to explain their thinking. If we want to reach them, tutoring has to be scheduled into the school day, spoken, and led by a tutor teaching lessons assigned by the child’s class teacher.
When pupils are left to use a tool on their own, the ones who most need it tend not to use it: in an analysis in Education Next, only 4.7% of pupils in US districts used Khan Academy as recommended, so it’s not surprising the impact data isn’t strong, and in a Stanford study of an AI literacy tutor in US primary schools, nearly half the pupils left to use it independently never logged in.
It’s clear that without tight oversight any kind of tutoring that requires students to take responsibility for their own usage is almost bound not to have the desired effect on children from disadvantaged backgrounds – those 89 points behind the most advantaged students on the PISA scale.
AI tutoring of the sort that Third Space Learning provides schools has been designed to be the closest possible fit to traditional high-impact, high-dosage tutoring. As Becky Francis, chief executive of the EEF, has said, the evidence on AI tutoring “is in its infancy”, and of course that includes ours.
How do we think quality AI tutoring can help?
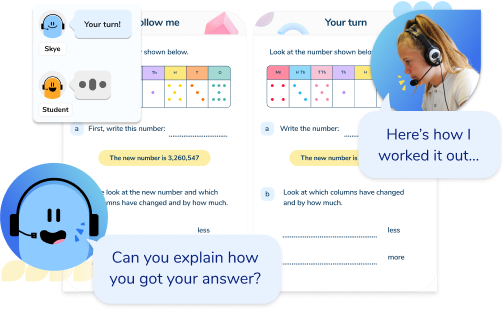
We built Skye for the pupil who will not put their hand up, is nervous to have a go and finds it hard to explain their thinking. Skye is a spoken AI maths tutor that leads that pupil through a sequence of lessons one-to-one, in sessions the school schedules and supervises. The class teacher chooses who takes part and sets the lessons to match what the class is learning. They can review each pupil’s progress afterwards.
“The shyer children really got into it and built confidence. Back in January and February they were all completely focused in their sessions, there was classroom silence while they were in there with Skye.”
Evan Speke, Higher Level Teaching Assistant, Sacred Heart Catholic Primary School
Lessons run from Key Stage 2 strands up to GCSE grades, and every lesson starts with a Skill Check In so the tutoring begins where the pupil is. The lessons are written by former teachers, and Skye gives pupils feedback hints, leaving the answer for them to find. It is built on insights from 2,295,000 one-to-one tutoring sessions across 4,200 schools since 2013.
One annual licence covers unlimited sessions for unlimited pupils, so a school no longer has to ration who gets the tutoring.
“We did the traditional tutoring at the beginning, but that was only for six or seven children per year group; the AI tutor allows for far more flexibility. The teachers love how accessible it is for all the pupils they want, whether that was a whole year group or just a small group.”
Sophie Cantore, KS1 Lead and Acting Maths Lead, St Raphael’s Catholic Primary School
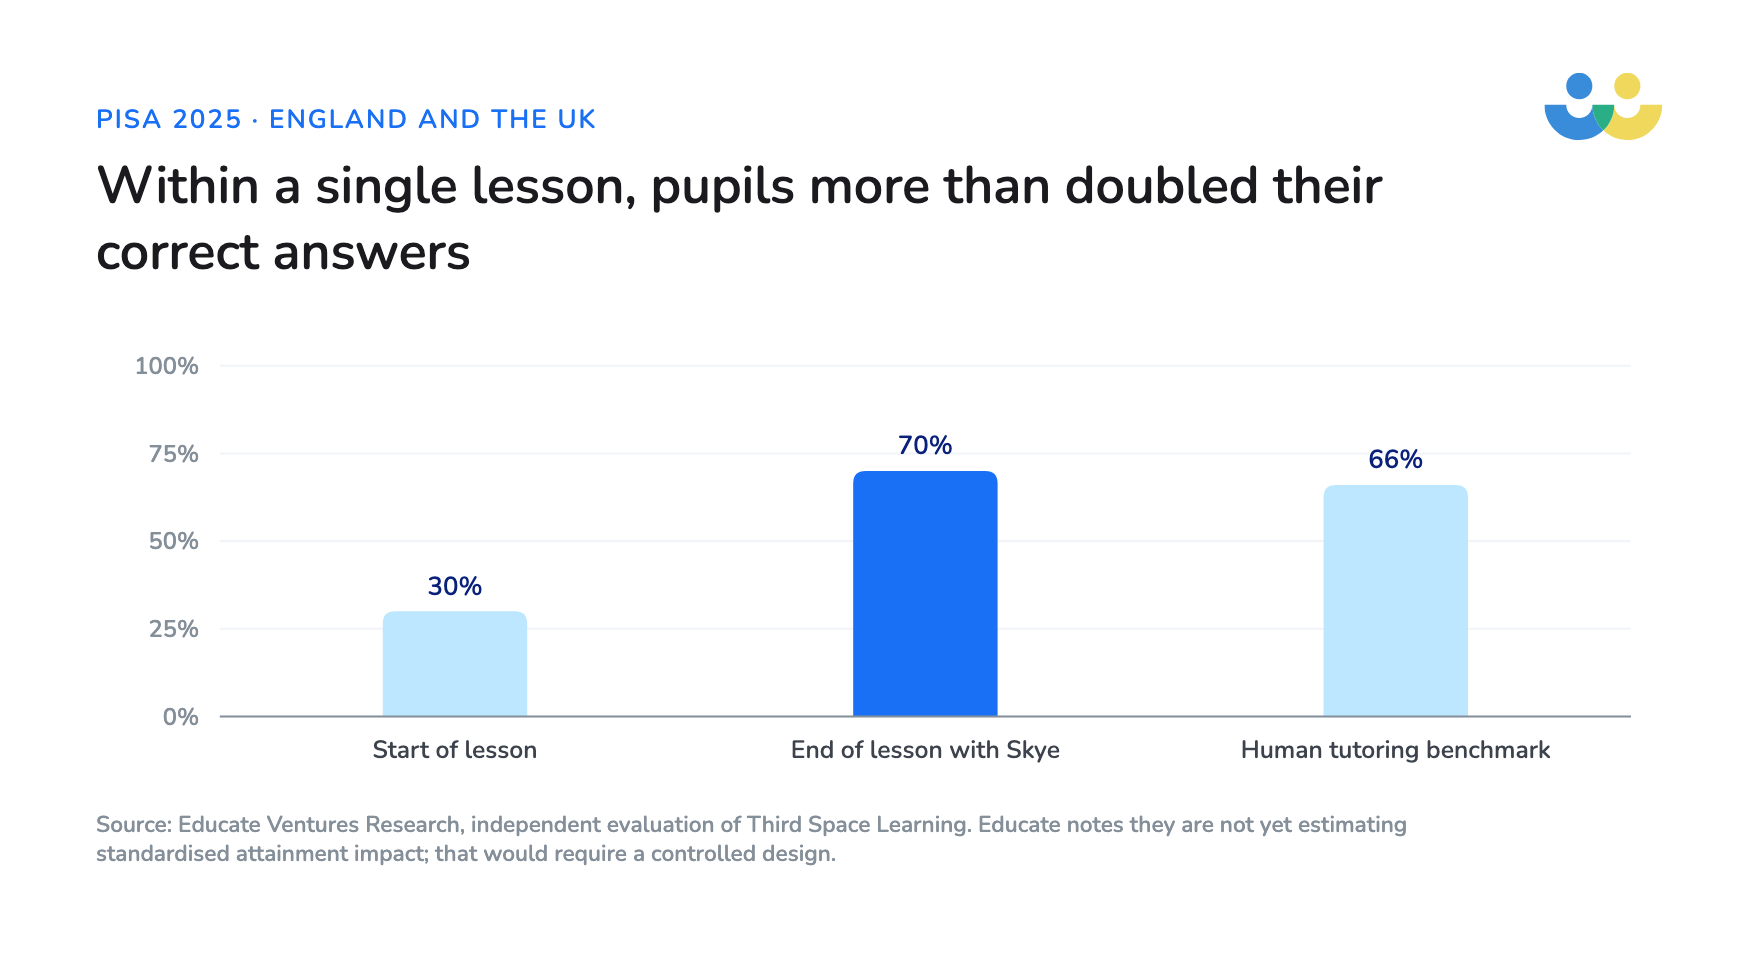
In an independent evaluation by Educate Ventures Research across 9,320 pupil sessions, pupils more than doubled their correct answers after a single lesson with Skye, from 30% to 70%, beating the human tutoring benchmark of 66%. Educate notes they are not yet estimating standardised attainment impact; that would require a controlled design.
We don’t yet have standardised test results but we do have evidence from many schools of the impact Skye is having on individual schools and classes, and increasingly across an entire cohort of schools on our multi academy trust programmes. In secondary schools, not every pupil takes to it straight away:
“Some students were initially reluctant; a few said they didn’t want to ‘talk to a robot’. Over time, though, many of those students have become more comfortable with the format and are more willing to take part.”
Gareth Barratt, Key Stage 4 Director, Richard Rose Central Academy
What should schools do before the next PISA?
Whichever support you use, there are a few practical steps you can take on the back of the PISA results:
- Find the pupils below Level 2 at Key Stage 3, before they reach Year 11.
- Use Year 7 transition assessments such as this free Year 7 maths test to see which strands each pupil arrived behind in.
- Put intervention on the timetable rather than leaving it optional, and keep a record of who attends.
Every school using Skye can already see which pupils attended each session and how they engaged. That is the measure I think every AI tutoring tool, ours included, should be judged on. We know what works for them, and now we have to make sure they get it.
Discover how AI tutor, Skye, can improve your students’ confidence and maths results.
Get in touch to arrange a free AI maths tutoring session.
Try a free sessionFAQs
The latest PISA results are from PISA 2025, published in September 2026. England scored 492 in maths. The UK as a whole scored 488 in maths, 10th of 91 education systems and well above the OECD average of 463.
The UK ranked 10th of 91 in maths in PISA 2025, with a score of 488. Nine systems scored significantly higher than England: seven in East Asia, plus Estonia and Switzerland. Within the UK, England scored 492, Northern Ireland 473, Scotland 467 and Wales 456.
In PISA 2025 the average maths score across the 38 OECD members was 463, with 461 in reading and 482 in science. Across the countries tested in every round since 2015, the average maths score has fallen from 490 in 2018 to 465 in 2025.
PISA ran every three years up to 2025, with the 2021 round put back to 2022 because of the pandemic. The next round is PISA 2029. We will keep this page updated when the next PISA results are published.
Sources
The information in this article comes from:
- DfE (2026), national report for England: England scores, percentiles, quarters, UK nations, sampling and non-response
- OECD (2026), Volume I and the next round, 2029
- Oxford Department of Education (2026), Jenni Ingram’s comments
- Schools Week (2026), the DfE’s statement
- ASCL (2026), Pepe Di’Iasio’s comments
- DfE (2026), key stage 2 attainment 2025/26 and key stage 4 performance 2024/25
- DfE, NTP statistics; NFER (2024), NTP impact
- Sutton Trust (2026), school funding and pupil premium
- DfE (2026), pupil absence 2024/25 and school workforce 2025
- EEF, one-to-one tuition
- Schools Week (2026), Becky Francis on AI tutoring