Supercharge Your Higher GCSE Maths Lessons: An In-Depth Question & Topic Analysis Of Edexcel Higher Maths Papers 2025 Update
GCSE maths Higher past papers are useful in preparing students for the upcoming exams. This extensive guide for school leaders or maths teachers outlines topics and questions from previous GCSE Edexcel higher maths exams.
This guide focuses on Pearson Edexcel maths past papers, not the AQA or OCR exam boards, nor IGCSE maths. The focus is on GCSE maths, not A Level maths or the maths Edexcel A Level.
GCSE MATHS 2026: STAY UP TO DATE
Join our email list to stay up to date with the latest news, revision lists and resources for GCSE maths 2026. We’re analysing each paper during the course of the 2026 GCSEs in order to identify the key topic areas to focus on for your revision.
GCSE dates 2026
GCSE results (2026 when available)
Get ahead on revision with the GCSE maths papers analysis from 2026:
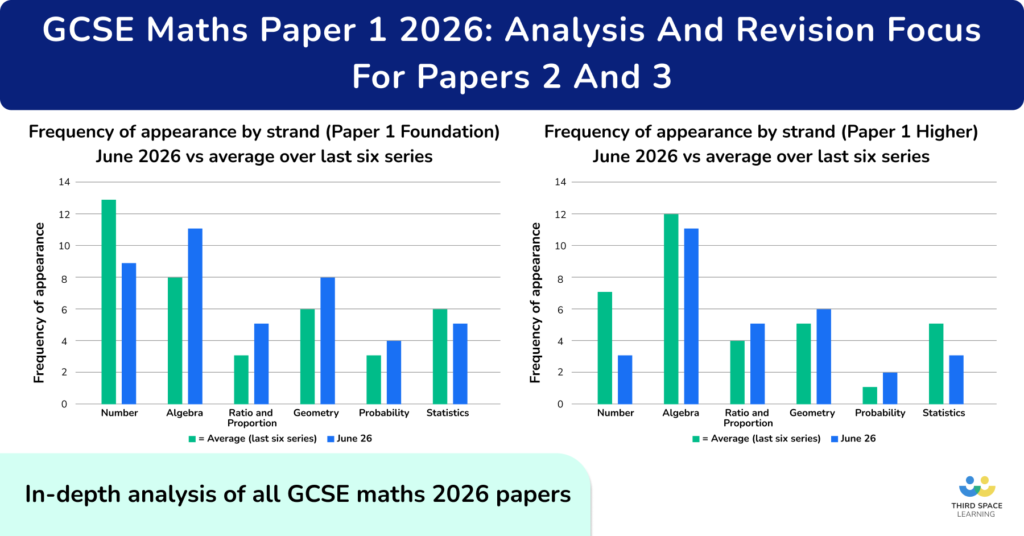
Analysis of GCSE Maths Paper 1 2026
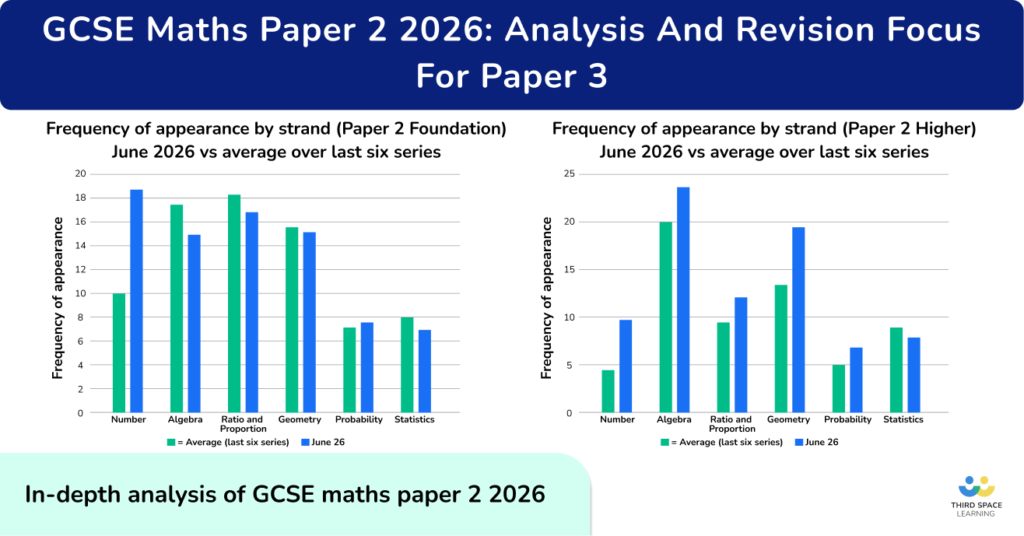
Analysis of GCSE Maths Paper 2 2026
GCSE Maths Paper Analysis and Summary 2025
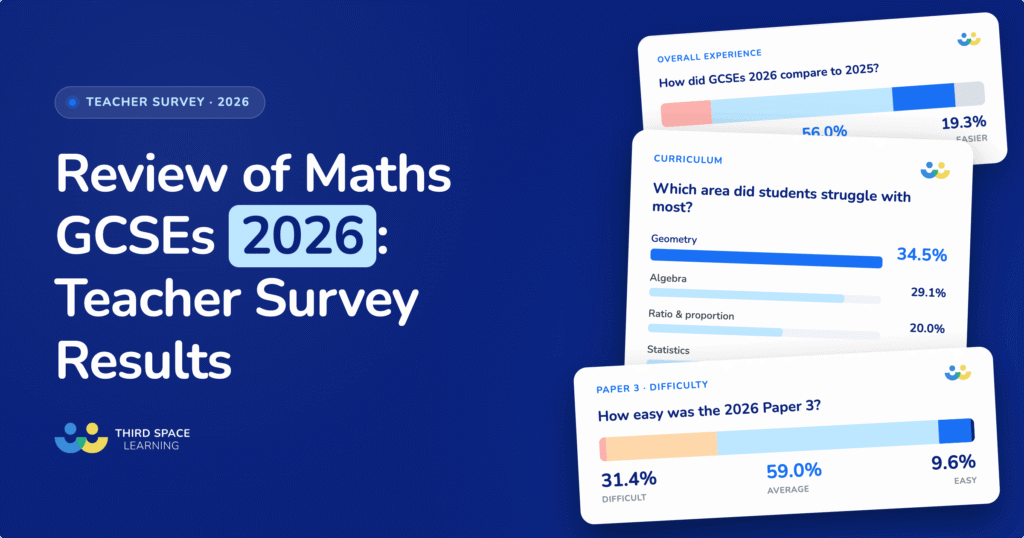
GCSE Maths Teacher Survey Results 2026

Edexcel Maths Foundation & Higher Papers: Set 5 (2026)
Download these 6 ready-made GCSE practice papers for high-quality exam preparation. The 3 Foundation and 3 Higher tier papers feature unique questions closely matched to Edexcel GCSE maths style and format, written by current and former examiners. Answers and mark schemes included.
Download Free Now!Edexcel maths past paper findings
Here are my key takeaways from the past paper analysis. You can read more about each strand later in the article, including:
- Tips for which topics to focus on in the first few questions;
- Common questions;
- Frequently appearing topics;
- What I would focus on teaching for each strand.
Number and Proportion
- Basic calculation skills (four operations and working flexibly with fractions, decimals, percentages, and ratio) must be automatic.
- There is some accessible procedural work on standard form, HCF and LCM, negative and fractional indices, surd manipulation, expressing recurring decimals as fractions, using a calculator and error intervals, on most maths Higher past papers.
Algebra
- Basic algebra skills (simplifying, expanding, factorising and solving equations and inequalities) must be automatic. Algebraic fractions are frequently used to assess a range of algebraic manipulation skills.
- Linear and quadratic equations and inequalities are frequently assessed in a variety of contexts, particularly perimeter, area, and volume.
- There is some accessible procedural work within sequences and functions, such as quadratic nth term, inverse and composite functions, basic graph skills, equation of a straight line, drawing graphs, and estimating solutions from a graph.
- Other key topics include simultaneous equations, including non-linear, expanding triple brackets, solutions of equations using iteration, gradients and areas, particularly using speed-time and distance-time graphs.
Ratio and Proportion
- Proportional reasoning, particularly ratio, is assessed throughout the paper, and a lack of understanding could limit the accessibility of other topics.
- This strand is particularly context-heavy: ensure students are familiar with common real-life contexts by explicit teaching of problem-solving.
- There is increased emphasis on compound measures, particularly speed and density; these topics are often interwoven with others, such as volume and surface area.
Geometry
- Perimeter, area, and volume are almost exclusively assessed in context and link heavily to other topics, such as linear and quadratic equations and inequalities.
- Pythagoras and trigonometry focus on problem-solving/multi-step problems requiring applications of more than one rule, working in 3D or applying to area calculations.
- Candidates need to be able to give clear mathematical reasoning for 2D shape and angle problems; angles in polygons and circle theorems feature here.
Probability
- There is plenty of accessible procedural work on combinations, Venn diagrams and tree diagrams.
- Extend higher-attaining students with plenty of practice with combined event problems.
Statistics
- Presenting data mostly involves drawing and interpreting cumulative frequency graphs, box plots, histograms, and frequency polygons; candidates are just as likely to be asked to interpret or critique a given chart or graph as to draw one themselves.
- Processing data focuses on estimating the mean, and calculating averages and ranges from charts and graphs (such as finding the IQR from a box plot).
Unlimited GCSE maths tutoring with Skye, the voice-based AI maths tutor.
Built on the same principles, pedagogy and curriculum as our traditional tutoring but with more flexibility, reach and lower cost.
Help your GCSE students achieve their target grade with Skye’s one to one maths tutoring.
Watch Skye in actionBackground to this research
I started looking in detail at these papers in 2021, when I used the then-available full set of six Edexcel GCSE maths Higher papers from June 2017 to November 2019.
Since writing that article, we’ve had a few more sets of papers and I’ve had more time to refine my analysis process. This refreshed article takes a look at all Edexcel Higher series so far, and answers these questions:
- Which strands or topics are the heaviest hitters at Higher level?
- Which topics appear the most in common or crossover questions at GCSE?
- Which topics appear in the first half of the paper at Higher level?
- Which topics are more likely on Maths Paper 1?
Edexcel past papers methodology
Categorising by topic
When I began my analysis of the first six sets of Edexcel past papers, I applied a broad approach to categorise each question, using only topic and sub-topic. For example, Statistics / Charts and Graphs.
Since then, I have added several more papers and further detail to my data-set, allowing for a more in-depth look at how different topics are examined.
The categorisations are based on the GCSE Edexcel specification and align closely with Third Space Learning’s topic categories.
Classifying some of the multi-mark, deeper problem-solving questions presented a challenge. I decided to pick a main topic for each question and classify under that heading, rather than try and assign marks for topics within questions.
So, for example, June 2017 P1 Q18 required candidates to apply knowledge of the properties of a rhombus to a question about linear graphs. However, as the question is inaccessible without knowledge about the general equation of a straight line, I classified this as ‘linear graphs’.
The proportional reasoning category only covers standard proportion and ratio-type problems. For example, recipes, conversions, splitting into ratios and so on. However, many ratio problems include fractions, percentages or both.

Third Space Learning’s GCSE AI maths tutoring covers the entire GCSE mathematics curriculum. Our programmes use diagnostic testing to assess where the gaps in knowledge lie and then use this information to tailor the course specifically to the needs of each student. Students work through individualised lessons with Skye, the AI maths tutor, to practice the areas of maths they need more support on. This helps them to develop mathematical fluency and increase their confidence going into the GCSE maths exam.
Categorising by complexity
To simplify the analysis process, I have classified the high-mark problem-solving questions by their main topic. While it loses some detail, it’s easier to identify trends across a larger data set.
I also wanted an idea of the difficulty or complexity of each question. I decided to base this broadly on the GCSE assessment objectives:
- AO1 – using and applying standard techniques (50%)
- AO2 – reasoning, interpreting and communicating mathematically (25%)
- AO3 – solving problems in mathematics and other contexts (25%)
This is a rough basis, as longer or multi-step questions often award marks for more than one assessment objective. My complexity classifications can be stated as follows:
- C1 – standard procedural problems, often worth one or two marks
- C2 – problems asking candidates to explain their reasoning, interpret information from tables, diagrams or other contexts, or ‘show that’ type questions
- C3 – non-standard multi-step problems, often requiring the application of skills from a variety of topics, worth three, four, or more marks
This is also not a ‘difficulty’ measure. ‘Higher grade’ topics, such as simultaneous equations or estimating the mean, are often examined as standard procedural.
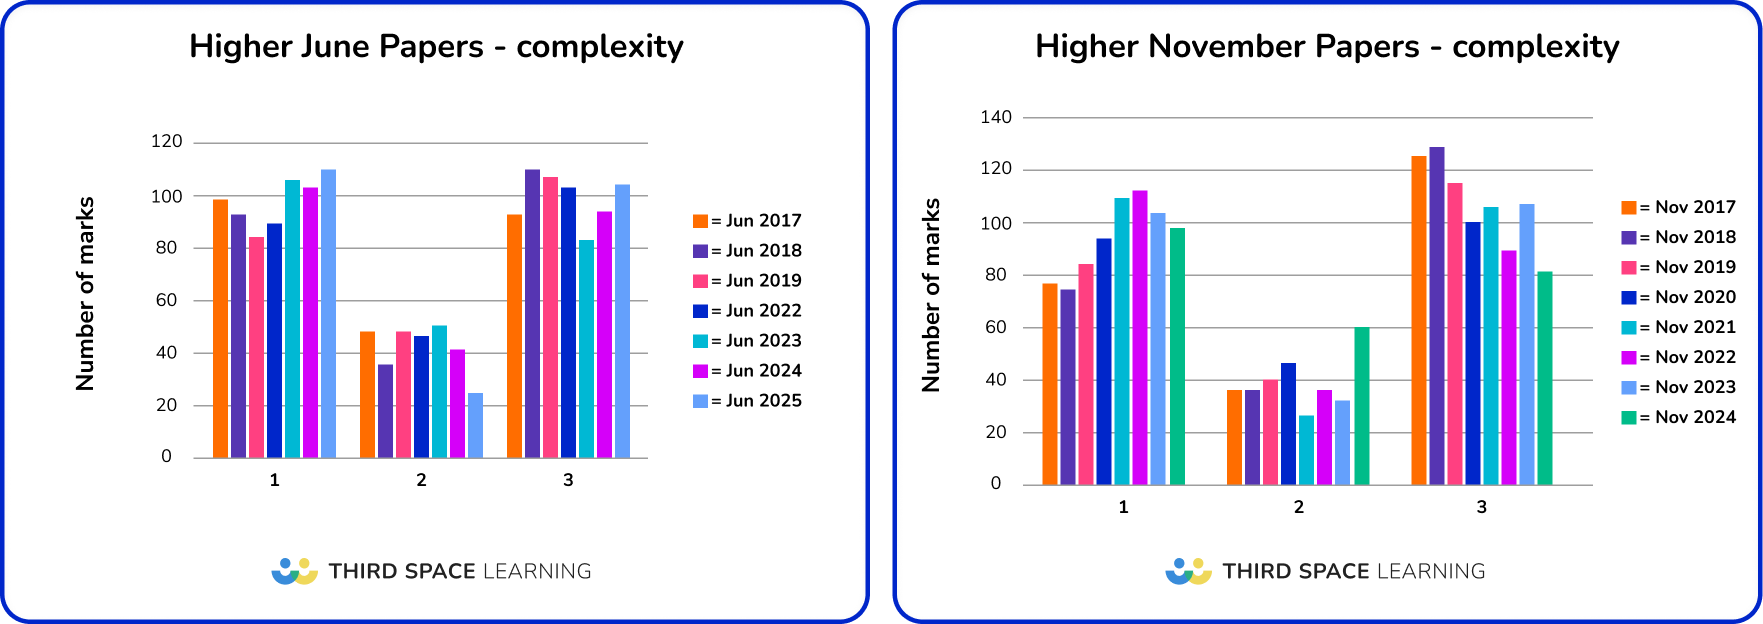
Generally, between 40-50% of the marks were allocated to C3 problems; obviously, there will be some A01 marks for applying standard techniques.
However, this emphasises the expectation that Higher maths candidates should be able to reason flexibly with their mathematical knowledge, rather than just apply it to standard problems.
Before 2020, the November series favoured a slightly higher ratio of C2 and C3 to C1 questions. Post-2020 papers trend towards a slightly higher ratio of C1 to C3 questions; this difference is particularly noticeable in the June 2023 exam papers. But in June 2024, the trend appeared to be reversed, with fewer C1 questions and more C3.
Frequently occurring topics – common questions
This section of the article focuses on the questions that appear on both tiers: the common or crossover questions. These are the first few questions of the Higher papers and, as such, this is material that the average Higher candidate should find fairly accessible.
On average, we’re looking at around 20-25 questions per series, split over three papers – approximately 8 common questions per paper, often split into parts. As these carry nearly a third of the overall marks per paper, Higher students must pick up every mark they can in this part of the paper. This section contains some suggestions for doing this.
When students sat the first series for the new specification in 2017, Edexcel was criticised for the difficulty of content in the common questions, and adaptations were made to the papers to account for this from June 2018. Due to these changes, I have omitted June and November 2017 papers from this section of the analysis.
This graph shows the number of times questions have appeared on the six main topics across all three papers over the past eight years. Part questions are counted as separate appearances to account for different topics assessed in different parts of questions.
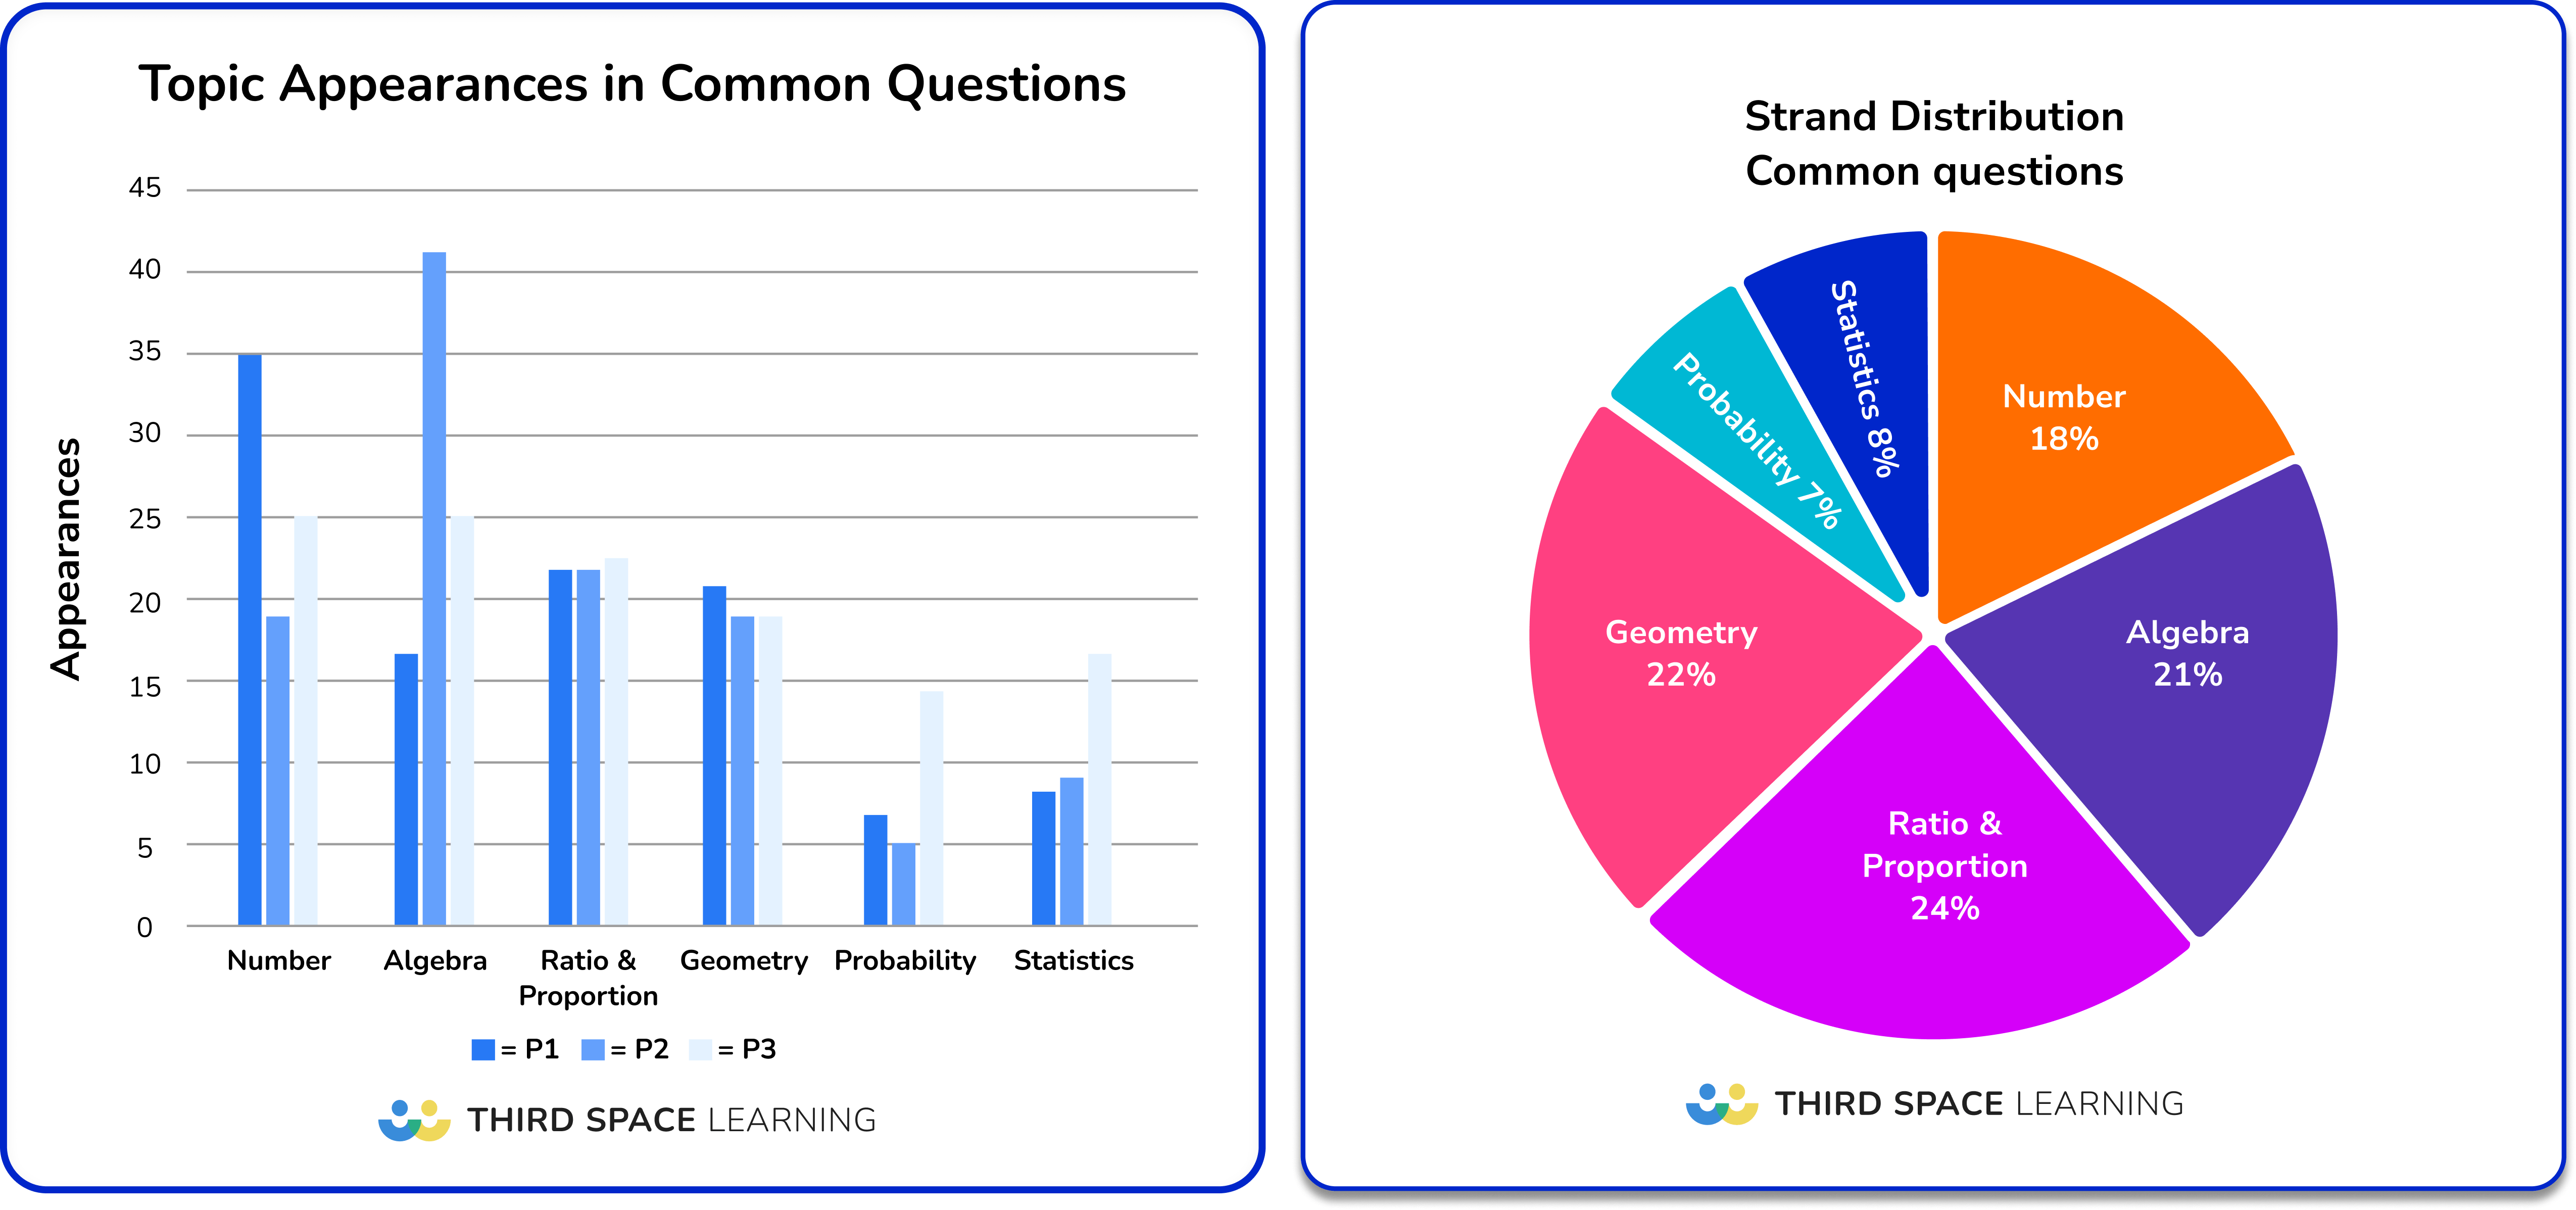
Key points
- The proportion of Number content is greater on Paper 1 (non-calculator), following the pattern for the rest of the papers at both tiers. For example, Number is assessed more frequently on the non-calculator paper.
- Strand distributions generally follow the pattern for the rest of the Higher papers, although there is slightly more Number and Ratio and Proportion in the common questions.
- There is more Probability and Statistics on Paper 3 than on the other two papers – this is probably a curiosity rather than by deliberate design, as the content on Papers 2 and 3 (calculator papers) should be functionally identical.
Frequently occurring topics
As expected, some topics appear more frequently than others in common questions. Although this shouldn’t be used to narrow down taught content, it can indicate where to focus Higher revision when time is tight.
This table contains topics with four or more appearances in common questions from June 2018 onwards.
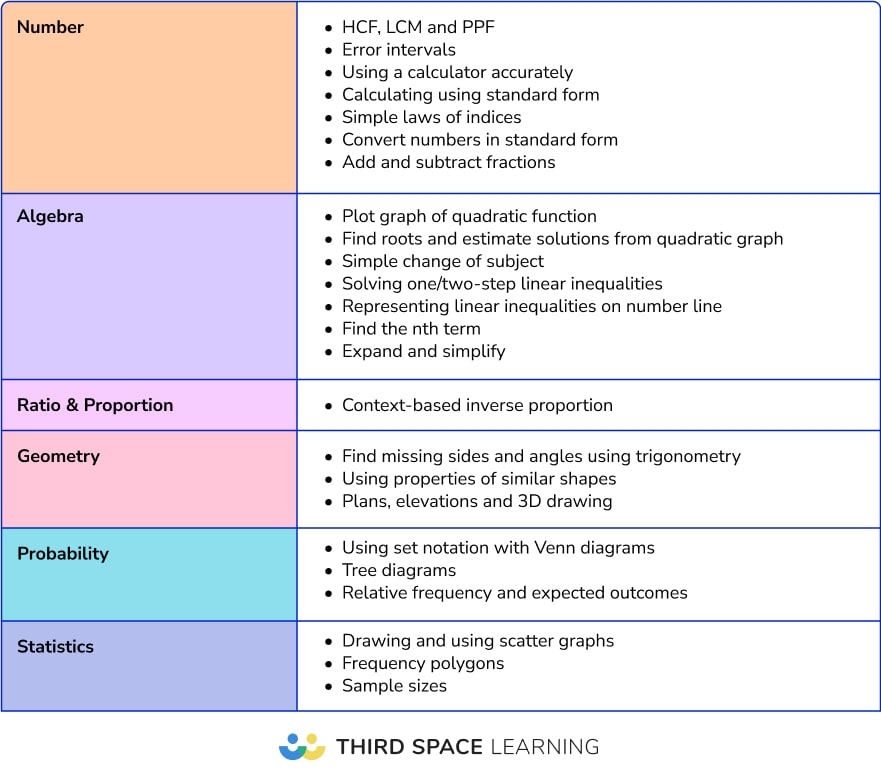
Topics that attract the most marks
Some topics appearing in common questions are worth more marks, on average. Consequently, these topics are more likely to be assessed in multi-step problems. When revising these topics with students, ensure they can tackle unfamiliar contexts and work flexibly with the concepts involved to solve problems.
There is a lot of crossover between the topics in this list and the one above, as topics appearing more frequently per series usually have a higher average mark. Here is the list of twenty common question topics worth the most marks since 2017, ordered from most to least marks:
- Ratio and FDP problem solving
- Speed, distance, time
- Compound interest and depreciation
- Plot graph of quadratic function
- Convert numbers in standard form
- Volume of cylinders
- Angles in polygons
- Venn diagrams
- PPF
- Multiply and divide decimals
- Simple laws of indices
- LCM
- Problem solving using perimeter and area
- Use probabilities of ME events sum to 1
- Find missing sides and angles using trigonometry
- Find roots and estimate solutions from quadratic graph
- Add and subtract fractions
- Tree diagrams
- Context-based inverse proportion
- Use set notation with Venn diagrams
Frequently occurring topics – first half
In this section, I look at the most frequently occurring topics in the earlier questions on the Higher papers, excluding the common questions.
For Higher students aiming for a grade 6, these are a good place to pick up a decent proportion of marks. Students aiming for higher grades should be fluent in this content.
This pie chart shows the distributions of the six main topic areas in the first half of all Higher papers.
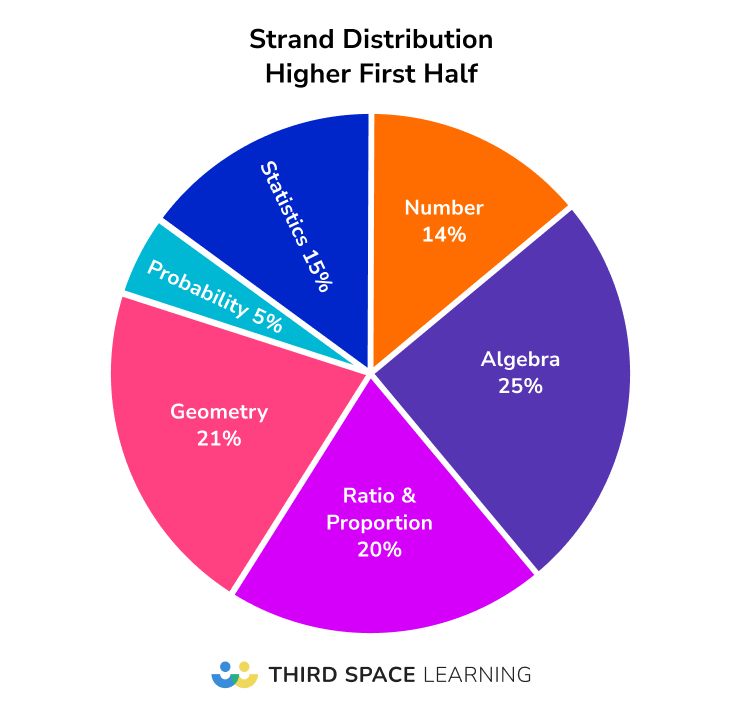
Key takeaways
- When compared with the topic distributions across the whole paper:
- There are slightly more marks for Statistics and Ratio & Proportion in the first half of the paper;
- There are slightly fewer marks for Algebra and Geometry in the first half of the paper.
Frequency of topics in the first half of the paper (common questions excluded)
This table contains topics with four or more appearances in the first fifteen questions of the Higher Edexcel papers. It is split by strand and then ordered from most to least frequent.
Common questions are excluded, but some of these topics are also assessed in common questions.
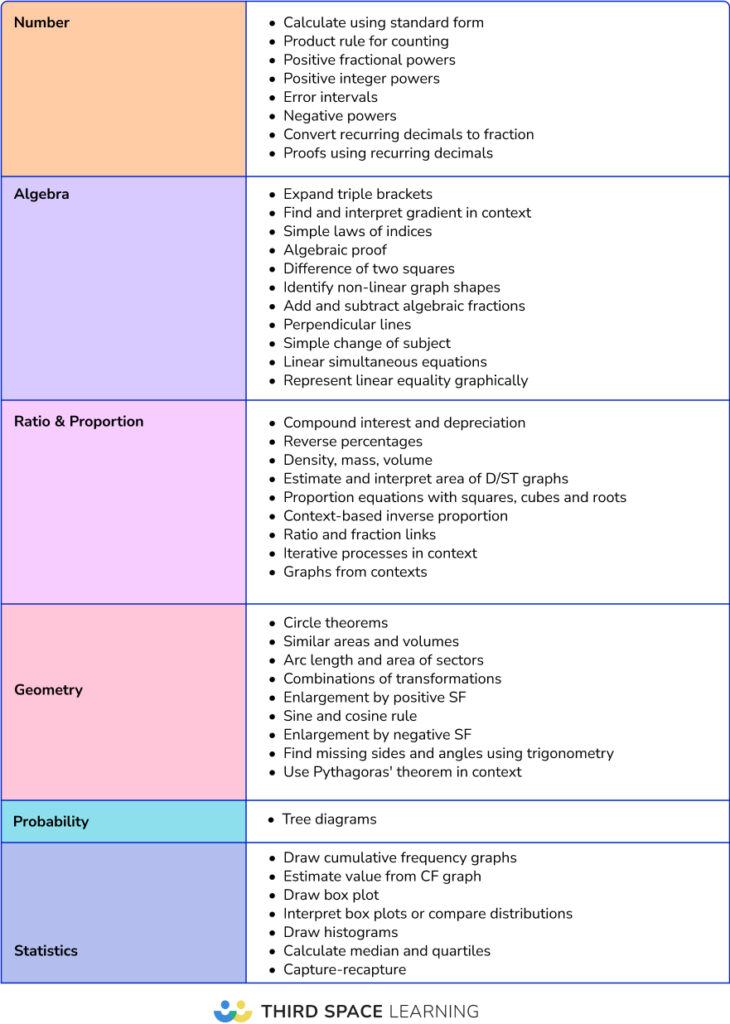
When averaged out per paper, there are just over 50 marks available in the first fifteen questions (including common questions) on Higher. In most series, this is enough to achieve a grade 7.
Paper 1 higher topics
At GCSE, Paper 1 is a non-calculator paper, whereas Papers 2 and 3 allow a calculator. This impacts which topics are more likely to appear on Paper 1, or Papers 2 and 3.
This graph shows the distributions of the six main topic areas by paper.
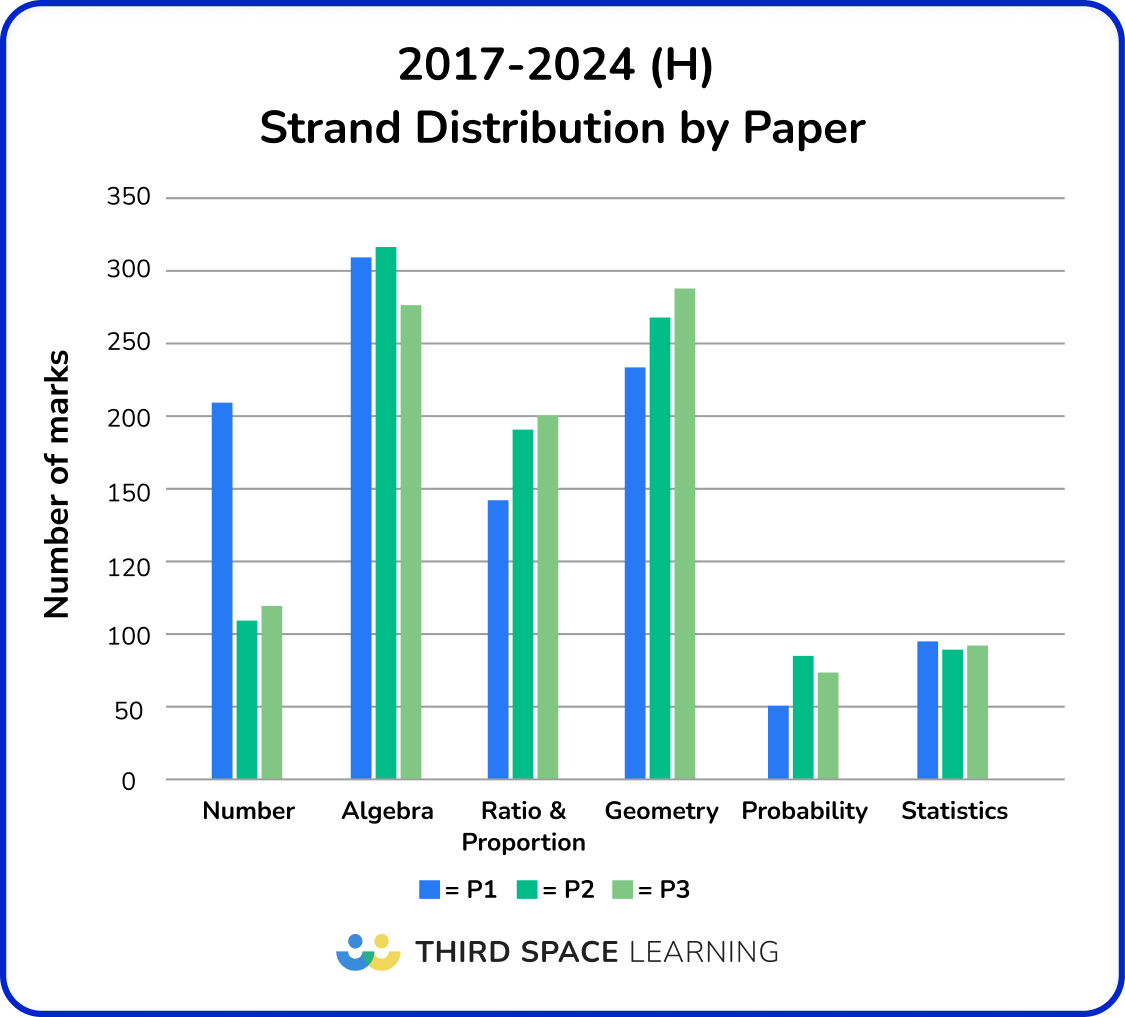
Broadly speaking, since 2017 we have seen:
- Paper 1 is significantly more arithmetic and calculation intensive.
- Number topics are twice as likely to appear on Paper 1 as on Papers 2 and 3 (this is a greater skew than Foundation).
- There are slightly fewer questions on Ratio and proportion, Geometry and Probability on Paper 1.
- Non-calculator topics such as transformations, drawing and interpreting charts and graphs, constructions and loci are more likely to appear on Papers 2 or 3 because there’s less room for them on Paper 1.
Topics with a high proportion of appearances on paper 1
Some topics are more likely than others to appear on the non-calculator paper. This table lists topics which have 80% or more of their appearances on Paper 1. A few of these topics such as systematic listing or constructions do not appear frequently overall on the Higher tier
Underlined entries indicate particularly popular non-calculator topics which have appeared in more than 40% of all series.
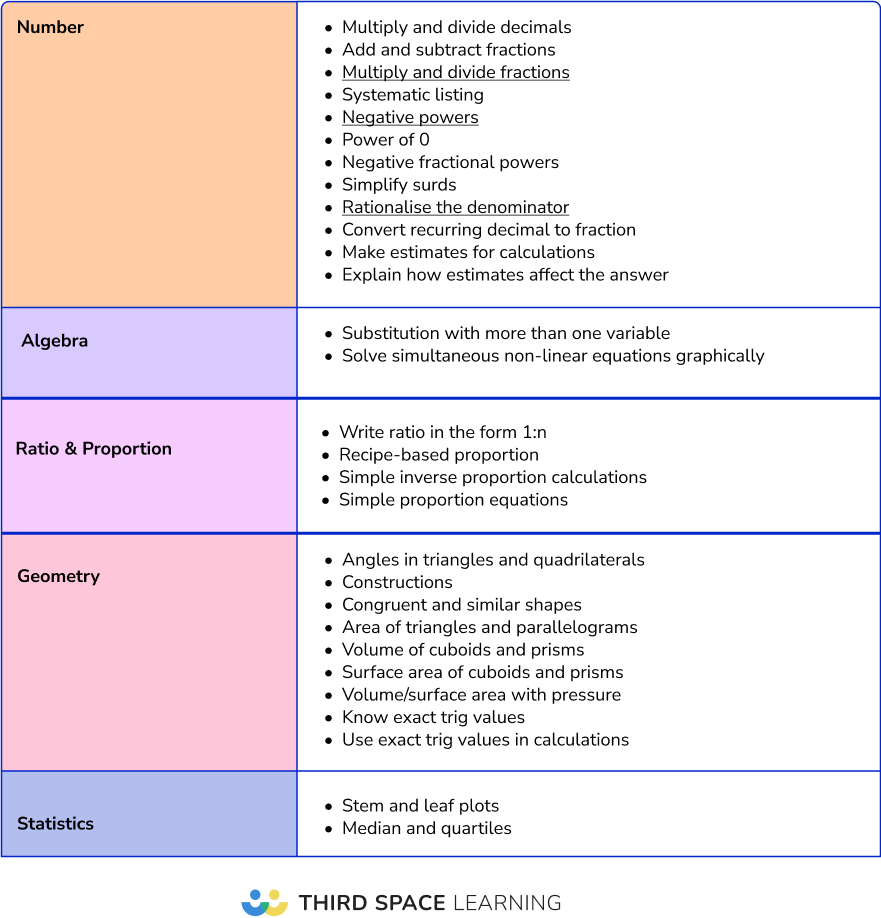
As always, please note that any topic could theoretically appear on any paper, and many of these topics also feature highly in Papers 2 and 3.
Analysis by strand and topic
Despite some minor variations, pre and post-pandemic exam series have interestingly similar patterns about the types of questions set and the complexity distribution for each topic, with some potential implications for exam preparation.
Data is set out in six strands
- Number;
- Algebra;
- Ratio and proportion;
- Geometry;
- Probability;
- Statistics.
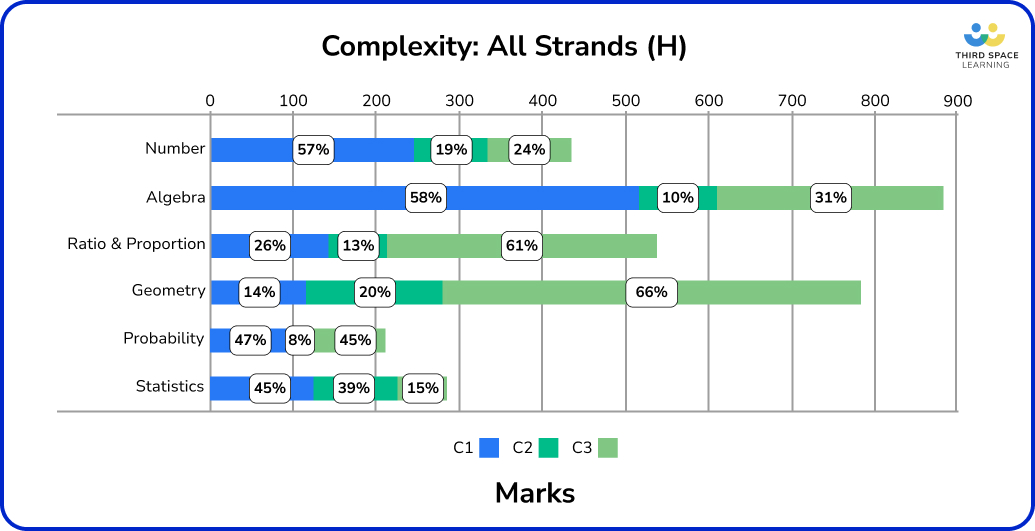
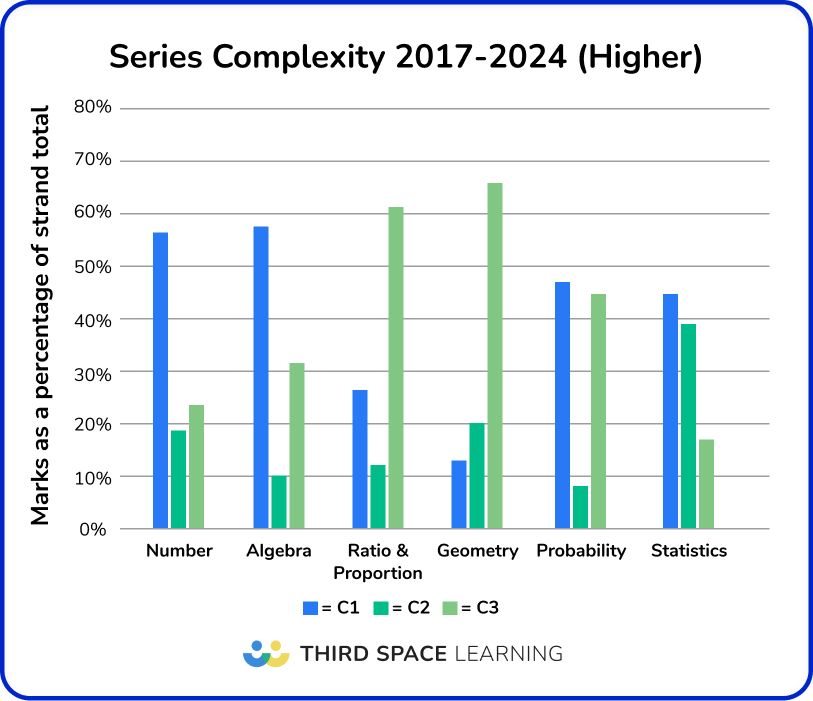
Before we get into the strand-by-strand analysis, here are the patterns across the strands and papers as a whole.
Particularly of note:
- There is a higher proportion of C3 non-standard, context-based problems within Geometry, Probability, and Ratio and proportion.
- There is a higher proportion of C1 procedural problems in Number, Algebra and Statistics strands – however, there is less procedural Algebra than in Foundation.
- The highest proportion of C2 questions involving reasoning or interpretation occurs within Statistics.
When preparing Higher groups for sitting exams, we can identify strands where more complex or unfamiliar problems are likely to occur and invest more time in these.
In the following sections, we delve deeper into the complexity distributions across the six main topic areas across all previous exam series.
Higher – Number
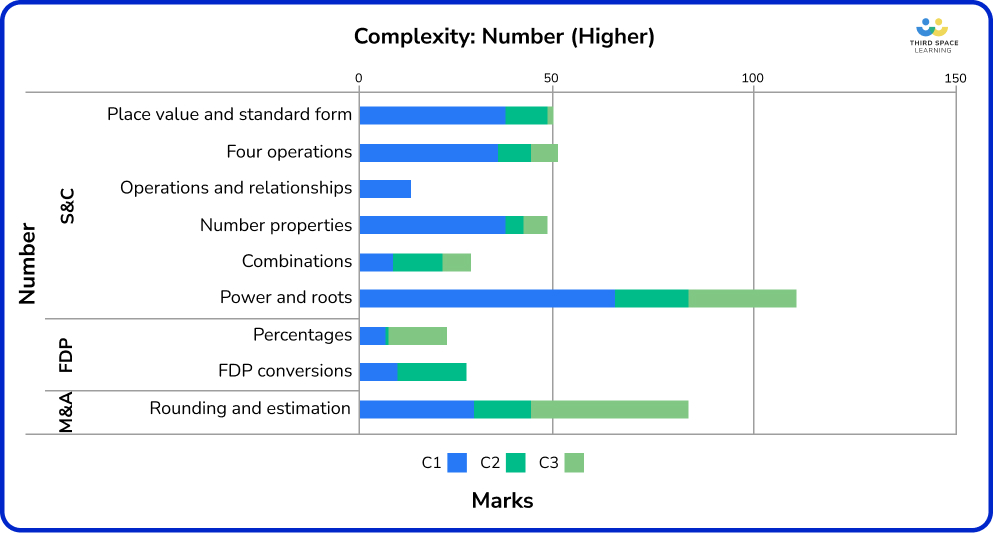
S&C = Structure and Calculations
FDP = Fractions, Decimals and Percentages
M&A = Measures and Accuracy
First of note is the significant proportion of procedural questions up for grabs in Number on Higher, particularly in Structure and Calculations. This is particularly apparent in place value and standard form, which has the lowest proportion (2%) of C3 questions across all series so far.
Plenty of accessible C1 marks required candidates to convert to and from standard form or carry out standard form calculations. C2 marks in this topic were for ‘show that’ type questions, spotting errors in presented working, or explaining how a change to the calculation would affect the answer.
Four operations, factors, multiples and primes, and fraction calculations were nearly all C1. Although as noted above, these skills are also embedded throughout the maths Higher past papers. Most of the procedural fraction arithmetic questions involved mixed numbers. There was a mix of prime factorisation, HCF and LCM, and most of the work on four operations was on fraction or decimal calculations.
Rounding and estimation had a mix of types of rounding, but error intervals and bounds accounted for 79% of the marks for measures and accuracy and appeared in nearly every series. There were a handful of rounding to decimal places and significant figures, usually as a follow-up to a use of calculator problem. Questions involving lower and upper bounds were likely to be assessed in context, and frequently included other embedded topics, such as compound measures.
Powers and roots attracted the most marks and appeared in all series. 59% of these marks were C1 and included working with fractional and negative indices, simple laws of indices and rationalising the denominator in surd questions. C2 questions within this topic usually asked candidates to spot mistakes in a solution. Combinations was another topic that appeared in all series so far.
All FDP conversions at Higher (excepting as an embedded skill in other topics) involved working with recurring decimals – either ordering or writing as a fraction. The C2 questions were ‘show that’ or ‘prove’.
What would I teach based on this data analysis?
- Basic calculation skills (four operations and working flexibly with fractions, decimals and percentages) for automaticity.
- Procedural work on standard form, HCF and LCM, negative and fractional indices, surd manipulation, expressing recurring decimals as fractions, using a calculator and error intervals.
- Familiarise students with systematic listing and combinations; it was new to the 2015 specification but has featured in every series so far.
Higher – Algebra
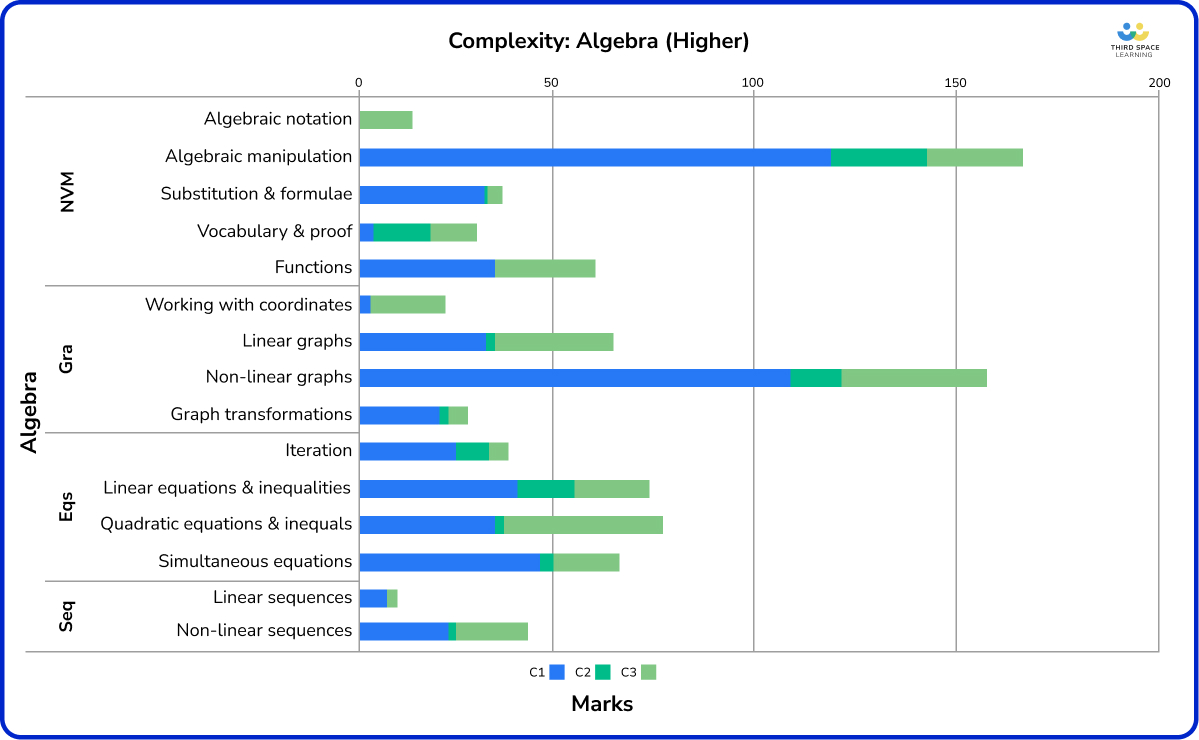
Algebra attracts a fair proportion of C1 and C3 marks, with relatively few C2. As expected, many application topics have a higher proportion of C3 marks and these include:
- Linear graphs (49%)
- Working with coordinates (nearly all problem-solving on Higher at 90%)
- Quadratic equations and inequalities, particularly context-based or embedded topics (54%)
While algebraic manipulation is 70% C1 procedural questions, candidates are also expected to be able to reason and solve problems using their algebra toolkit, particularly when applying these skills in related areas.
Nearly half of the marks in algebraic manipulation were for algebraic fractions; it’s worth noting that these questions also included things like expanding and factorising, including the difference of two squares. We can see that these basic skills are being assessed more commonly through work on algebraic fractions, rather than as standalone questions, as on Foundation.
Apart from algebraic manipulation, there was also a decent proportion of C1 marks available for the following topics:
- Non-linear graphs (66%)
- Graph transformations (70%)
- Simultaneous equations (67%)
- Iteration (63%)
- Sequences (58%)
- Substitution and formulae (89%)
Some of these are typically considered more difficult topics. For example, C1 simultaneous equations questions were just as likely to be about non-linear systems as the “standard” two linear. The questions on iteration were done step-by-step, were generally procedural and followed a set pattern, so could be easier marks to pick up.
Note that linear and quadratic equations were frequently examined in other C3 contexts, particularly perimeter, area and volume or shape and angle properties.
Graph work, both linear and non-linear, had a fair proportion of C3 problems; these were generally multi-step coordinate geometry problems, similar to those seen at early A Level, rather than applications to other topics. That said, over 60% of the marks on non-linear graphs were available on C1 questions, including drawing graphs of quadratics and circles, matching graphs with equations (this style of question appeared on half of the series so far), and estimating solutions to equations from graphs.
What would I teach based on this data analysis?
- Basic algebra skills (simplifying, expanding, factorising and solving equations and inequalities) must be automatic. Algebraic fractions are frequently used to assess a range of algebraic manipulation skills.
- Linear and quadratic equations and inequalities, particularly with perimeter, area and volume.
- Procedural work within sequences, functions, such as quadratic nth term, inverse and composite functions, basic graph skills, equation of a straight line, drawing graphs and estimating solutions from a graph.
- Simultaneous equations, including non-linear, expanding triple brackets, solutions of equations using iteration, gradients and areas, particularly using speed-time and distance-time graphs.
Higher – Ratio and Proportion
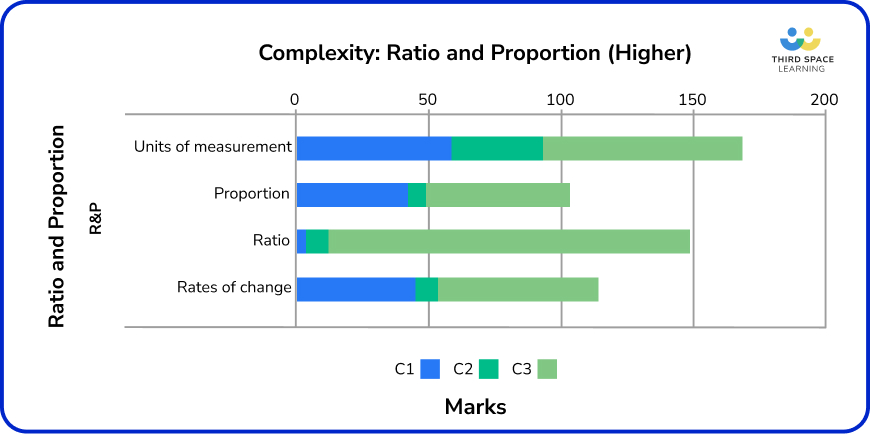
Similarly to Foundation, a large percentage of Ratio and Proportion questions were classified C3 (problem-solving). This is particularly evident in Ratio at Higher. For example, no questions asked candidates to simply ‘split into a ratio’, as this was assessed through other topics by presenting key question information as a ratio.
Ratio is also one of the topics most frequently embedded in other questions (see June 2019 1H Q17 for an example of solving a quadratic with a ratio).
Key topics in percentages were:
- Compound interest and other repeated changes;
- Reverse percentages;
- Percentage profit;
- Use of exponential notation to represent repeated change.
Most of these were presented in real-life contexts, such as depreciation of price or money in a bank account.
Compound measures account for more than half of the marks for units of measurement, and 18% of the entire strand. The topic has appeared on every series so far, and is a favourite topic for common questions, appearing at the start of the Higher paper. Density frequently appears in combination with the volume of 3D shapes.
31% of the marks in units of measurement are for distance or speed-time graphs, with a high frequency of appearances per series. Questions on this topic and other real-life graphs are more likely to be procedural.
What would I teach based on this data analysis?
- Proportional reasoning, particularly ratio, is assessed throughout the paper, and a lack of understanding could limit the accessibility of other topics. Ensure a strong understanding of direct and inverse proportion, and fluency with ratio skills.
- Problem-solving in the real-life contexts presented in percentage questions.
- Applied work with compound measures, including interweaving with other topics such as volume and surface area.
Higher – Geometry
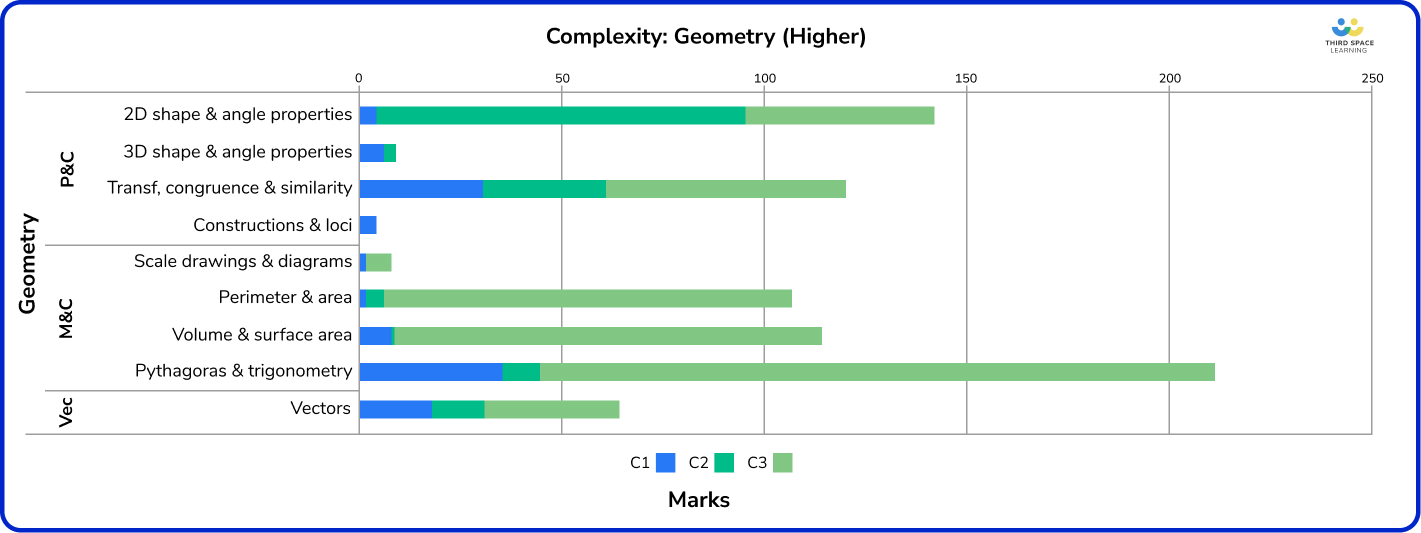
Similar to the Foundation papers, the maths Higher past papers featured a heavy emphasis on C3 applications within Measures and Calculations, particularly:
- Perimeter & area (94%);
- Volume and surface area (91%).
I was also surprised at the high proportion (77%) of C3 problems on Pythagoras and trigonometry.
Candidates were unlikely to be presented with a simple right-angled triangle problem to solve using Pythagoras or trigonometry. Questions involving simple applications of trigonometry often presented information in a non-standard way, such as giving angles as ratios rather than values.
82% of the marks for trigonometry, such as sine and cosine rule problems, were C3. Many of these questions required a double application of the sine/cosine rule, Pythagoras, or some crossover with area calculations. 3D Pythagoras or trigonometry appeared in just over half of the series.
Perimeter, area and volume were nearly all assessed in an applied manner, with some series having all of these topics assigned C3. There were fewer real-life contexts than on Foundation, but problems requiring multiple steps, such as calculating a volume given a surface area, or vice versa, featured highly. Very few simple questions asked candidates to calculate an area or volume, possibly because many formulae, particularly for volume and surface area, are given.
Transformations had a higher percentage (48%) of C1 marks available than many other Geometry topics; enlargements appeared more frequently than any of the other three transformations. The C2 marks within this topic were mostly for describing transformations and were fairly accessible.
2D shape and angle properties attracted the highest proportions of C2 marks (63%), purely because many of the questions in this topic contain the statement: ‘give reasons for your answer’. The most commonly assessed topics here were circle theorems and interior and exterior angles in polygons.
Of note was the low proportion of work on constructions, loci, scale drawing and bearings – so far constructions have only appeared procedurally once across eleven series.
What would I teach based on this data analysis?
- Problem-solving skills when working on perimeter, area and volume, including links to other topics such as linear and quadratic equations and inequalities.
- When teaching Pythagoras and trigonometry, increase focus on problem-solving or multi-step problems requiring applications of more than one rule, working in 3D or applying to area calculations.
- Practise clear mathematical reasoning for 2D shape and angle problems, particularly angles in polygons and circle theorems.
Higher – Probability
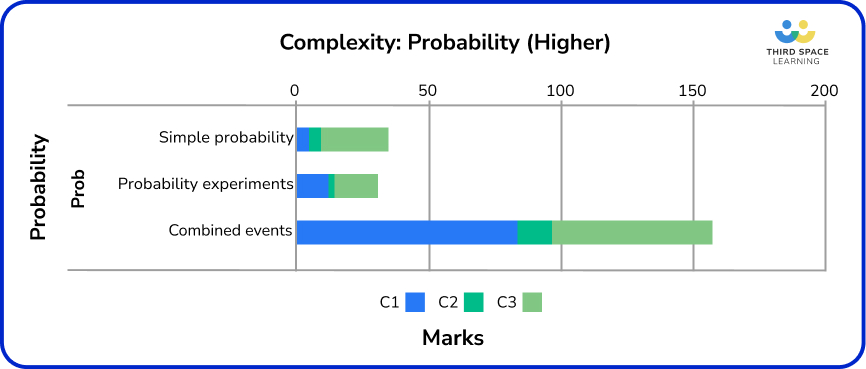
Across all series of Higher maths past papers, the ‘new content’ (i.e. added in 2015) is strongly represented in the probability strand. Unlike Foundation, there were no questions with pre-drawn frequency trees (although candidates could have chosen to use these for non-structured questions), with the focus almost exclusively on tree diagrams. Venn diagrams and combinations featured highly, appearing in most series.
Looking at the strand as a whole, there was a fairly even split of procedural C1 and more challenging C3 problems. However, most procedural questions appeared in combined events, with more procedural work in simple probability and probability experiments.
C3 questions included a non-structured problem lending itself well to Venn diagrams (June 18 P3Q20), and a problem requiring ratio calculations in addition to probability (June 18 P1Q16). As on Foundation, mutually exclusive events were most likely to be examined at C3 (76%).
What would I teach based on this data analysis?
- Accessible procedural work on Venn diagrams and tree diagrams.
- Applying fraction and ratio skills to unfamiliar contexts for mutually exclusive events or relative frequency.
- Combined event problems for higher-attaining students.
Higher – Statistics
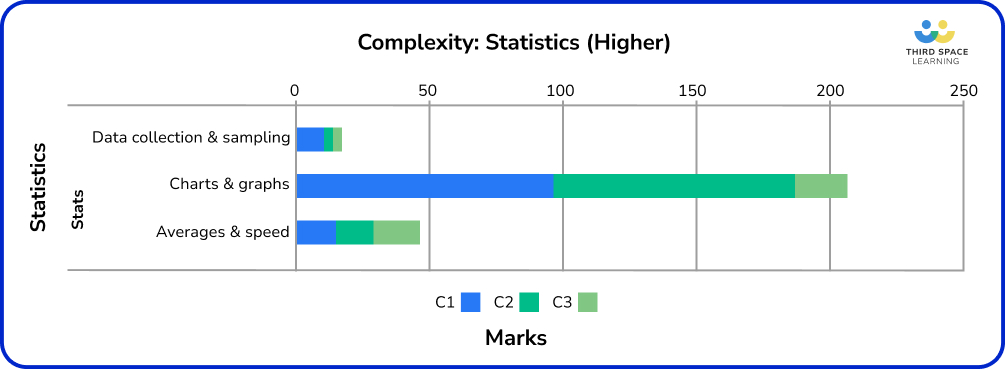
As with Foundation, the majority of statistics content is C1 and C2, although there is slightly more problem-solving expected at Higher. Averages and spread attracted the greatest proportion of C3 marks; 36% of the marks in this strand were for problem-solving, with questions involving the mean featuring particularly highly.
Over three-quarters of the statistics marks were for charts and graphs. 45% of the marks for presenting data is C2, meaning that candidates are almost as likely to be asked to analyse, read information from or critique a graph or chart as they are to draw one. Cumulative frequency charts, box plots, histograms and frequency polygons appeared most frequently, with some work on time series graphs and pie charts.
In averages and spread, 24% was C2 which tends to be reading or estimating the average or range from given tables or charts. 40% of the marks for averages and spread were C1, almost exclusively for estimating the mean or finding the median class interval from a table, and nearly always appeared in common questions.
Sampling was assessed on nearly half of the series; it appeared in June 2019 (P2Q3) and November 2019 (P2Q4) in an almost identical format with a ‘stratified sample-style’ question. Capture-recapture has appeared on three series in 2020-2022 but has not appeared since.
What would I teach based on this data analysis?
- Maximise marks on charts and graphs, particularly cumulative frequency, box plots, frequency polygons and histograms.
- Ensure students can solve problems using the mean, including finding missing amounts.
- Familiarise students with calculating averages and spread for grouped data.
Final thoughts from this analysis of maths Edexcel Higher papers
Analysing the new specification GCSE Higher papers has been very interesting. It caused me to:
- Re-evaluate my ideas about exam preparation;
- Reconsider what topics to focus on with each group;
- Think further about time weightings given to certain topics once GCSE maths revision begins.
One of the goals for GCSE maths in 2015 was to increase the number of multi-topic questions requiring students to make mathematical connections and apply their skills to unfamiliar contexts. This messaging from Ofqual and exam boards was emphasised with the publication in July 2023 of Ofsted’s Coordinating Mathematical Success, which discusses the importance of teaching problem-solving skills in some detail.
Teaching problem-solving cannot be a quick fix at the end of a syllabus; it should be allocated time in a scheme of work and connected to learning. For example, when teaching density or pressure, give students plenty of problems requiring the application of formulae for volume or surface area.
Concerning final exam preparation, consider the frequency some topics appear on Higher papers, or whether certain harder topics are likely to be assessed procedurally. For example, a lot of Number content at Higher is assessed procedurally, so there is potentially less value in spending a lot of exam preparation on rich problems within Number topics. This would be better assigned to tackling context-based problems in Ratio and Proportion, or applying algebra skills to geometric problems.
For students aiming for a grade 6 or lower, careful focus on those topics most likely to appear in the crossover content or the rest of the first half of the paper is a prudent use of revision time. Bear in mind, that students have to complete a significant amount more work per mark on the final few questions on the paper. For these candidates, the emphasis should be on maximising marks and checking for errors on the first two-thirds or so of the paper, rather than trying to “get through” the whole paper.

Free GCSE maths revision resources for schools
As part of the Third Space Learning offer to schools, the personalised online GCSE maths tutoring can be supplemented by hundreds of free GCSE maths revision resources from the secondary maths resources library including:
– GCSE maths past papers
– GCSE maths predicted papers
– GCSE maths worksheets
– GCSE maths questions
– GCSE maths topic list
For further suggestions on how you can use this analysis to impact your teaching of Higher exam groups, see the companion piece on higher topics essential to GCSE success this year.

DO YOU HAVE STUDENTS WHO NEED MORE SUPPORT IN MATHS?
Skye – our AI maths tutor built by teachers – gives students personalised one-to-one lessons that address learning gaps and build confidence.
Since 2013 we’ve taught over 2 million hours of maths lessons to more than 170,000 students to help them become fluent, able mathematicians.
Explore our AI maths tutoring or find out how our GCSE maths tutoring programmes could support students in your school.