GCSE Tutoring Programme
Our chosen students improved 1.19 of a grade on average - 0.45 more than those who didn't have the tutoring.
This topic is relevant for:

Frequency Density Formula
Here we will learn about the frequency density formula, including rearranging it and using it to find missing values.
There is also a histogram worksheet based on Edexcel, AQA and OCR exam questions, along with further guidance on where to go next if you’re still stuck.
What is the frequency density formula?
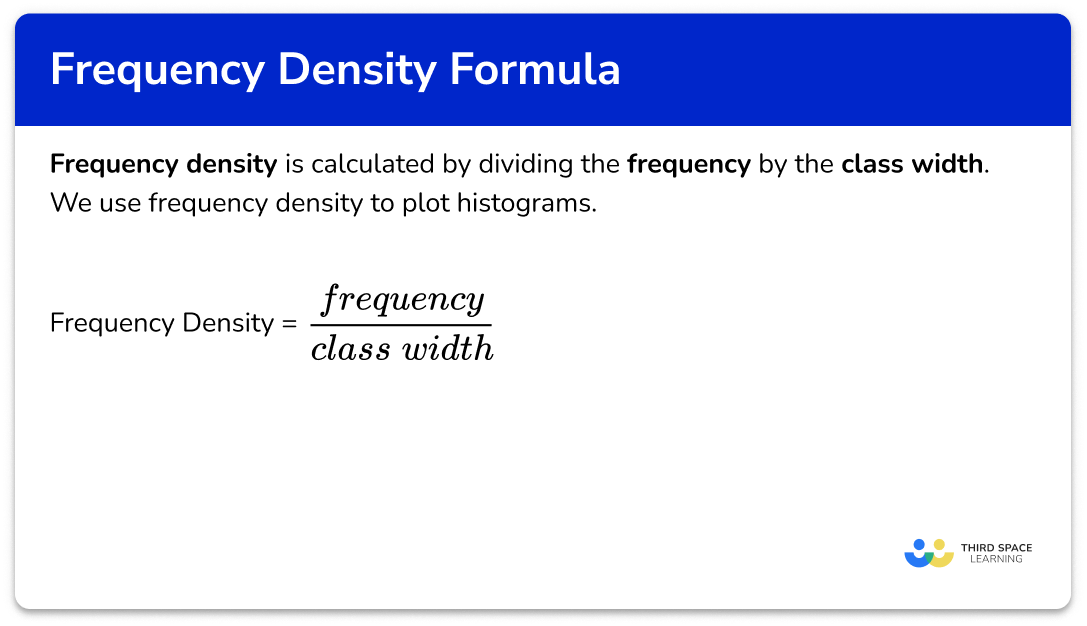
The frequency density formula is a calculation that involves dividing the frequency by the class width.
We use frequency density to plot histograms which show frequency distribution. The larger the area of the bar on a histogram, the higher the frequency.
We can calculate the frequency density by using the formula
\text{Frequency density }=\frac{\text{frequency}}{\text{class width}} .
Given that
- D represents frequency density
- F represents the frequency (number of values) of a class interval
- And W is the class width of the class interval
The formula abbreviates to
D=\frac{F}{W} .
For example,
If a class interval has a frequency of F=8 and a class width of W=10 , these values can be substituted into the frequency density formula to find the frequency density.
\begin{aligned} D&=\frac{F}{W}\\\\ &=\frac{8}{10}\\\\ &=0.8 \end{aligned}The formula can also be rearranged to find a missing frequency or a missing class width,
\text{Frequency }=\text{frequency density } x \text{ class width}
\text{Class width}=\frac{\text{frequency}}{\text{frequency density}}What is the frequency density formula?
How to use the frequency density formula
In order to use the frequency density formula:
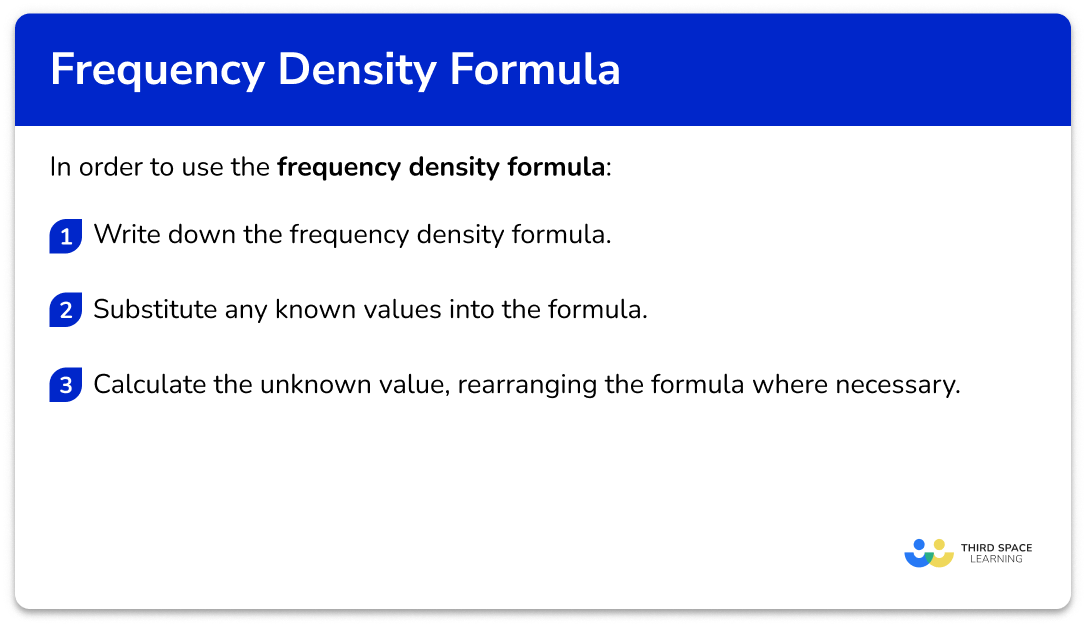
- Write down the frequency density formula.
- Substitute any known values into the formula.
- Calculate the unknown value, rearranging the formula where necessary.
Explain how to use the frequency density formula

Histograms worksheet

Get your histograms worksheet of 20+ questions and answers. Includes reasoning and applied questions covering the frequency density formula.
DOWNLOAD FREE
Histograms worksheet

Get your histograms worksheet of 20+ questions and answers. Includes reasoning and applied questions covering the frequency density formula.
DOWNLOAD FREERelated lessons on histograms
Frequency density is part of our series of lessons to support revision on histograms. You may find it helpful to start with the main histograms lesson for a summary of what to expect, or use the step by step guides below for further detail on individual topics. Other lessons in this series include:
Frequency density formula examples
Example 1: calculating the frequency density using the formula
A class interval has a frequency of 12 and a class width of 5.
Calculate the frequency density.
- Write down the frequency density formula.
2Substitute any known values into the formula.
\text{Frequency density } =\frac{12}{5}3Calculate the unknown value, rearranging the formula where necessary.
\begin{aligned} \text { Frequency density } &=\frac{12}{5} \\\\ &=2.4 \end{aligned}Example 2: calculating the frequency using the frequency density formula
A data set is recorded for the number of times the baseball is thrown in a season of matches. A class interval has a frequency density of 1.8 and a class width of 5.
Find the frequency of the class.
Write down the frequency density formula.
Substitute any known values into the formula.
Calculate the unknown value, rearranging the formula where necessary.
To find the frequency we need to rearrange the formula. We do this by multiplying both sides by 5 to get
Frequency = 1.8 \times 5 = 9 .
Example 3: calculating the class width using the frequency density formula
A class interval has a frequency density of 3.4 and a frequency of 51.
Calculate the class width.
Write down the frequency density formula.
Substitute any known values into the formula.
Calculate the unknown value, rearranging the formula where necessary.
To find the class width we need to rearrange the formula. Multiplying both sides by the class width we get
3.4 \times \text{ class width }=51 .
Dividing both sides by 3.4, we get
\text { Class } \text { width }=\frac{51}{3.4}=15 .
Example 4: calculating the frequency density from a table
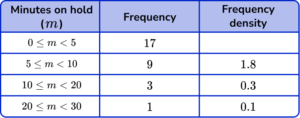
Below is the grouped frequency table for the number of minutes 30 customers wait on hold on the phone to an energy company.
Complete the table.
Write down the frequency density formula.
Substitute any known values into the formula.
As we are completing the table, we need to apply this formula to the first row of data.
The first row has the class interval 0 \leq m < 5. Subtracting the lowest value in the range from the highest value, we get
\text{Class width }=5-0=5.
As the frequency is 17 we can substitute these into the formula to get
\text { Frequency density }=\frac{17}{5} .
Calculate the unknown value, rearranging the formula where necessary.
Example 5: calculating the frequency from a table
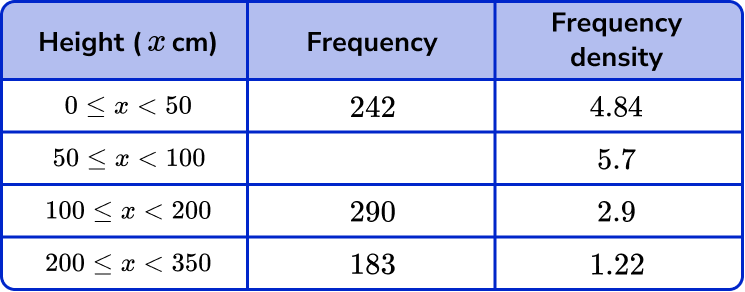
Below is the grouped frequency table for the height of trees in a woodland, measured in centimetres.
Complete the table.
Write down the frequency density formula.
Substitute any known values into the formula.
As we are completing the table, we need to apply this formula to the second row of data.
The second row has the class interval 50 \leq x < 100. Subtracting the lowest value in the range from the highest value, we get
\text{Class width }=100-50=50.
As the frequency density is 5.7 we can substitute these into the formula to get
5.7=\frac{\text { frequency }}{50} .
Calculate the unknown value, rearranging the formula where necessary.
Multiplying both sides of the equation by 50, we can calculate the value for the frequency to be
\text { Frequency }=5.7 \times 50=285 .
Example 6: calculating the frequency from a histogram
Below is a histogram showing the length of time it took students to complete a maths question.
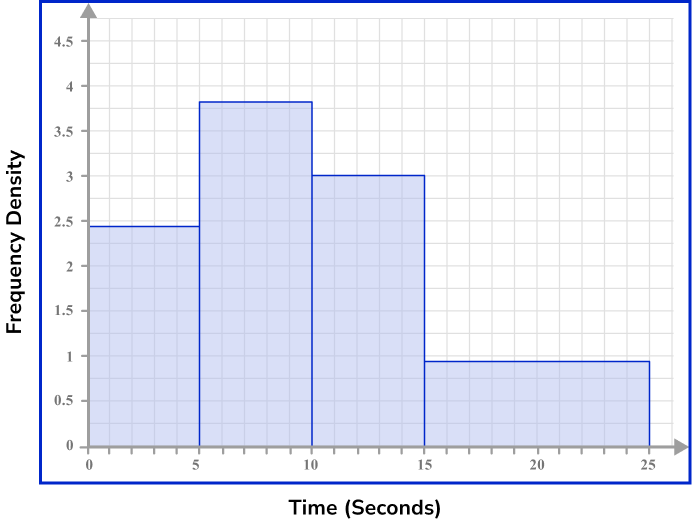
Calculate the frequency of students who took between 10 and 15 seconds to solve the puzzle.
Write down the frequency density formula.
Substitute any known values into the formula.
As we are looking for the number of students who took between 10 and 15 seconds, we need to get the data from the third bar in the histogram.
The remaining groups are not required for this solution.
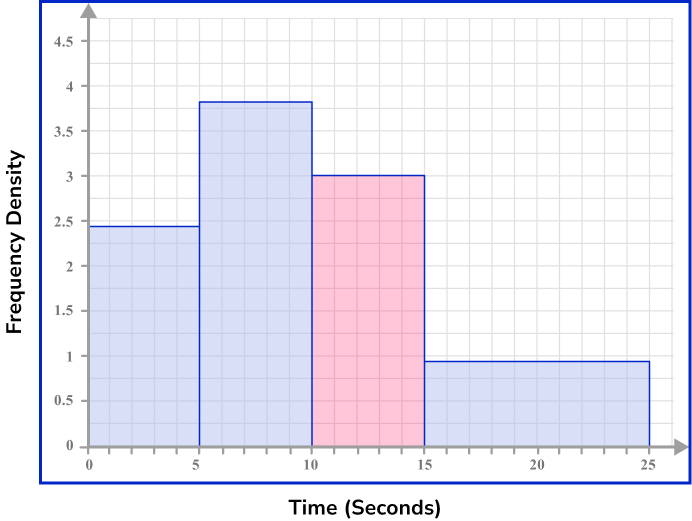
The class width is the width of the bar. This is found using the horizontal axis (the x -axis). The class width is equal to
\text{Class width }15-10=5.
The frequency density is the height of the bar. Using the vertical axis (the y -axis), the height of the bar is 3 as the bars all start from a frequency density of 0 and so D=3.
We can now substitute these into the formula to get
3=\frac{\text { frequency }}{5} .
Calculate the unknown value, rearranging the formula where necessary.
Multiplying both sides of the equation by 5, we can calculate the value for the frequency to be
\text { Frequency }=3 \times 5=15 .
Note: the total area of the bar is the frequency. Each bar is a rectangle, and so to calculate the frequency, we multiply the height (the frequency density) by the width (the class width) of the bar.
Common misconceptions
- Frequency density formula incorrectly rearranged
It is important that the frequency density formula is rearranged correctly when trying to calculate an unknown class width or frequency.
The correct rearrangements are
\text{Frequency }=\text{frequency density } x \text{ class width}
\text{Class width}=\frac{\text{frequency}}{\text{frequency density}}
It is also worth remembering that in a histogram, the frequency represents the area of the bar.
- Incorrect class width
The class width is the range of the class. When the class width is written as an interval, such as 0 \leq x < 5, we accept that the largest value in the range is 5, and not 4.9. This makes calculating the class width much easier!
- The vertical axis of a histogram is mislabelled ‘frequency’
The vertical axis of a histogram represents the frequency density for the class. It can sometimes be incorrectly labelled as ‘frequency’ due to prior knowledge of drawing a bar chart where the frequency is always the vertical axis label.
- Mixing up histograms with other diagrams
Histograms use frequency density, which should not be confused with adding up the frequencies for cumulative frequency or using the midpoints to plot a frequency polygon.
Practice frequency density formula questions
1. Which is not an equivalent frequency density formula?


To make the frequency the subject of the formula we must multiply both sides of the formula by the frequency density.
2. A class interval has a frequency of 16 and a class width of 5. Calculate the frequency density. Write your answer as a decimal.


3. A class interval has a width of 20 and a frequency of 7.
Calculate the frequency density.


4. A class interval has a frequency of 18 and a frequency density of 1.2. Calculate the class width.


5. The table below shows the results of a survey where commuters were asked about the number of hours per week they read non-fiction books.
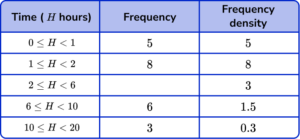
Calculate the frequency of commuters who read between 2 and 6 hours of non-fiction books per week.


6. Below is a histogram showing the number of spelling mistakes per paper, made in 30 academic papers.
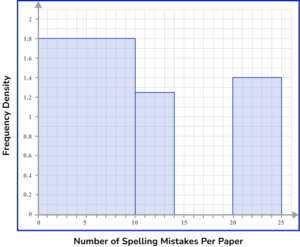
How many academic papers had fewer than 15 spelling mistakes?


The first bar has a width W=10 and frequency density D=1.8.
The frequency of the first bar is therefore
F=W\times{D}=10\times{1.8}=18 .
The second bar has a width W=4 and frequency density D=1.25.
The frequency of the second bar is therefore
F=W\times{D}=4\times{1.25}=5 .
There are no values between 14 and 15 spelling mistakes per paper as there is no bar.
The total frequency of these two classes is 18+5=23.
Frequency density formula GCSE questions
1. The grouped frequency table below shows the number of items of stationery in 120 pencil cases. Calculate the frequency density, D , for the class 10 \leq x < 25.
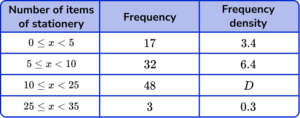
(2 marks)
(1)
3.2(1)
2. A grouped frequency table has a class interval with a frequency of 36 and a frequency density of 1.8.
Which of the following could have been that class interval?
\begin{aligned} 10 < x \leq 20 \quad \quad 15 < x \leq 20 \quad \quad 35 < x \leq 55 \quad \quad 5 < x \leq 20 \end{aligned}
(1 mark)
(1)
3. Higher only: Below is a histogram showing the density of 22 common substances.
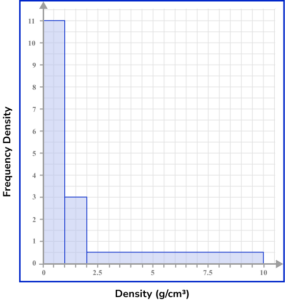
Estimate the number of substances that have a density in the range 0.5 \leq x < 1.5 \ g/cm^3.
(3 marks)
(1)
\begin{aligned} &1 \leq x < 1.5 \\\\ &(1.5-1) \times 3=1.5 \end{aligned}
(1)
5.5+1.5=7
(1)
Learning checklist
You have now learned how to:
-
Understand and use standard mathematical formulae; rearrange formulae to change the subject
-
Substitute numerical values into formulae
The next lessons are
Still stuck?
Prepare your KS4 students for maths GCSEs success with Third Space Learning. Weekly online one to one GCSE maths revision lessons delivered by expert maths tutors.

Find out more about our GCSE maths tuition programme.