FREE DOWNLOAD
Speed Time Graph Worksheet
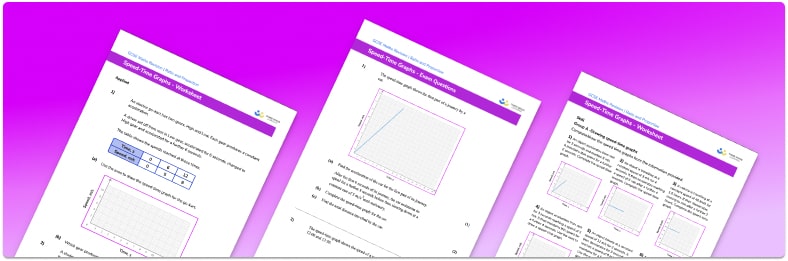
Help your students prepare for their Maths GCSE with this free speed time graph worksheet of 26 questions and answers
- Section 1 of the speed time graph worksheet contains 18 skills-based speed time graph questions, in 3 groups to support differentiation
- Section 2 contains 4 applied speed time graph questions with a mix of worded problems and deeper problem solving questions
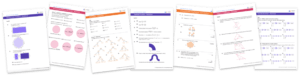
- Section 3 contains 4 foundation and higher level GCSE exam style practice questions including worded problems
- Answers and a mark scheme for all exam questions are provided
- Questions follow variation theory with plenty of opportunities for students to work independently at their own level
- All questions are created by fully qualified expert secondary maths teachers
- Suitable for GCSE maths revision for AQA, OCR and Edexcel exam boards
- Free downloadable and printable resources
Raise maths attainment across your school with hundreds of flexible and easy to use GCSE maths worksheets and lessons designed by teachers for teachers.
Speed time graph at a glance
A speed-time graph shows how the speed of an object varies over time. On any speed-time graph or velocity-time graph, a positive gradient represents acceleration, a horizontal line represents constant speed and a negative gradient represents deceleration.
We can draw a speed-time graph if we are given key information about a journey. We may need to use the formula Speed = Distance / Time to calculate unknown values.
On a speed-time graph, the acceleration at any time is equal to the gradient of the line at that time. Constant acceleration is therefore shown by a straight line. Average acceleration between two times can be found by drawing a line between the speed at those two times and finding the gradient of the line.
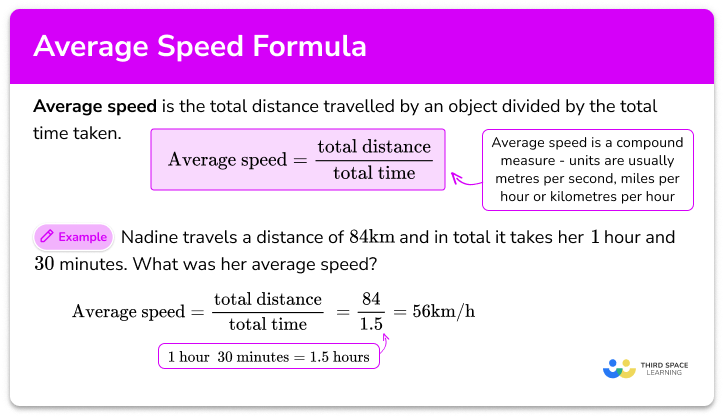
The average speed of an object, e.g. a cyclist, over the course of an entire journey can be calculated by dividing the total distance travelled by the total time taken.
You may also see speed-time graphs in GCSE physics.
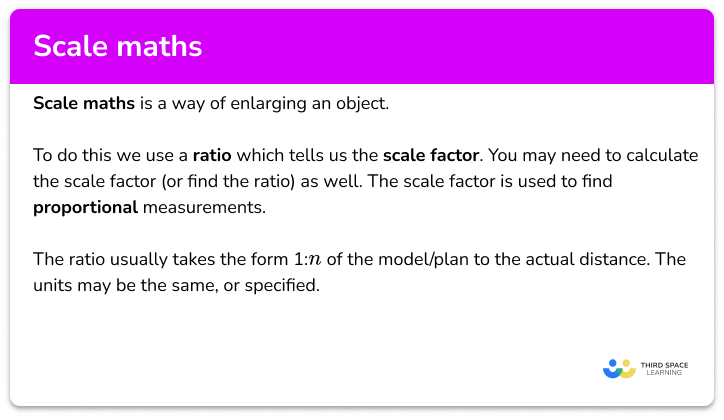
Looking forward, students can then progress to additional rate of change worksheets and other ratio and proportion worksheets, for example a ratio worksheet or a simplifying and equivalent ratios worksheet.
For more teaching and learning support on Ratio and Proportion our GCSE maths lessons provide step by step support for all GCSE maths concepts.
When you have students who require more intensive support our one to one GCSE maths revision programme will match them with the most appropriate tutor. This way we can provide individual students with personalised programmes of study while you continue to teach the rest of your class as a whole group.
Our maths interventions are currently only available for GCSE students, and are not suitable for A level students.
Do you have students who need additional support?

With Third Space Learning's secondary maths tutoring programmes, students in Year 7-11 receive regular one to one maths tutoring to address gaps, build confidence and boost progress.
"My confidence in the tutoring is high. We've had some phenomenal results. I even had one girl get a Grade 8 this year; she came to every tutoring session."
Stacey Atkins, Maths Director, Outwood Grange Academies Trust