GCSE Tutoring Programme
Our chosen students improved 1.19 of a grade on average - 0.45 more than those who didn't have the tutoring.
In order to access this I need to be confident with:
Types of graphs Plotting graphs Sketching graphs Linear graph Quadratic graphs Cubic graph Reciprocal graphThis topic is relevant for:

Directly Proportional Graphs / Inversely Proportional Graphs
Here we will learn about directly proportional graphs and inversely proportional graphs, including what proportion graphs are and how to interpret them.
You can also download the following free directly proportional graph resources suitable for those following Edexcel, AQA or OCR exam boards:
What are directly proportional graphs / inversely proportional graphs?
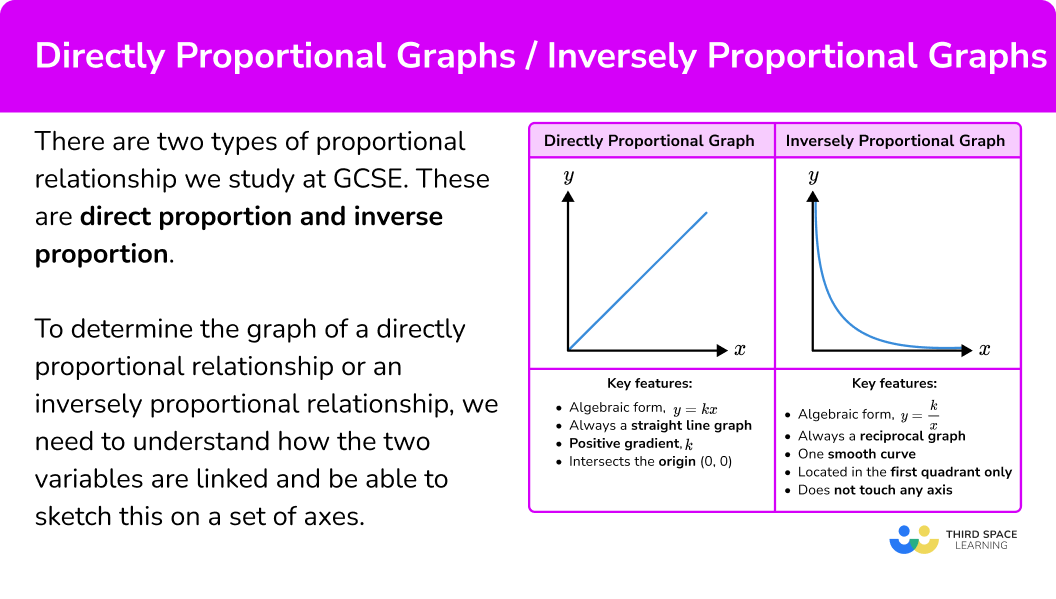
Directly proportional graphs/inversely proportional graphs are the graphs of types of proportional relationship we study at GCSE, direct proportion and inverse proportion
To determine the graph of a directly proportional relationship or an inversely proportional relationship, we need to understand how the two variables are linked and be able to sketch this on a set of axes.

● Directly proportional graphs
Direct proportion is one type of proportionality relationship. As one value increases, so does the other value. Direct proportion is sometimes known as direct variation.
Direct proportion is useful in numerous real life situations such as exchange rates, buying a quantity of items, work rates and conversion between units.
For example, the earnings received from selling a greater amount of the same product increases in direct proportion to the number of products sold.
The symbol ∝ represents a proportional relationship.
If y is directly proportional to x, we write is as y\propto{x}.
There is also a direct proportion formula which uses the constant k, as the constant of proportionality. The direct proportion formula is y=kx.
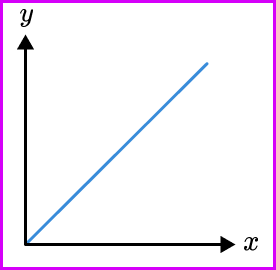
Directly proportional graphs can be straight line graphs.

As the variable x increases, the y variable increases and so the straight line continues on the same gradient as x gets larger; conversely, the straight line tends to 0 as x and y get smaller.
The straight line has a positive gradient, k, and the line intersects the origin (0,0).
The gradient of the line is steeper if the rate of change is greater (for two different straight lines).
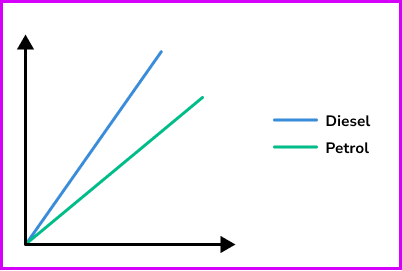
For example, let’s look at the cost of petrol and diesel.
If the cost of petrol is £1.50 per litre and the cost of diesel is £1.62 per litre, we can plot a graph to shop the price of different amounts of fuel.
The gradient of the line for diesel will be steeper than the line for petrol as the rate of change is greater.
See also: Gradient of a line
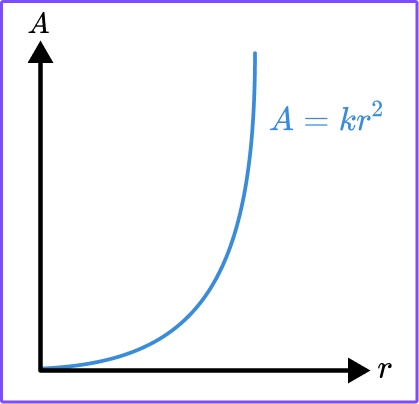
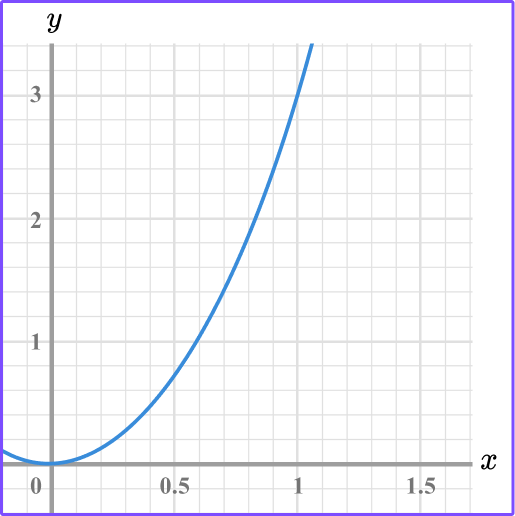
A direct proportion graph could also be a quadratic, cubic or involve a root.
The area of a circle is proportional to its radius. A=kr^2. We know that here k=\pi .
The graph would be a quadratic
● Inversely proportional graphs
Inverse proportion is when as one quantity increases the other quantity decreases and vice versa. Inverse proportion is sometimes known as indirect proportion.
For example, consider a job such as painting a fence. If the number of workers increases, then the time taken to do the work decreases. If the number of workers decreases, then the time taken to do the work increases.
If y is inversely proportional to x then we write y\propto\frac{1}{x}.
There is also an inverse proportion formula which uses the constant k, as the constant of proportionality. The inverse proportion formula is y=\frac{k}{x}.
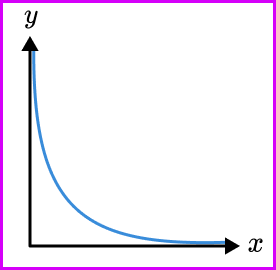
Inversely proportional graphs are reciprocal graphs consisting of one smooth curve in the first quadrant only.

As the variable x increases, the y variable decreases and so the curve tends towards the x -axis as x gets larger; conversely, the curve tends towards the y -axis as x gets smaller. The curve does not touch or intersect either axis at any point.
The graphs for y=\frac{k}{x^2}, y=\frac{k}{x^3}, y=\frac{k}{\sqrt{x}}, are all a similar shape to y=\frac{k}{x}
What are directly proportional graphs / inversely proportional graphs?
How to recognise a directly proportional graph / inversely proportional graph
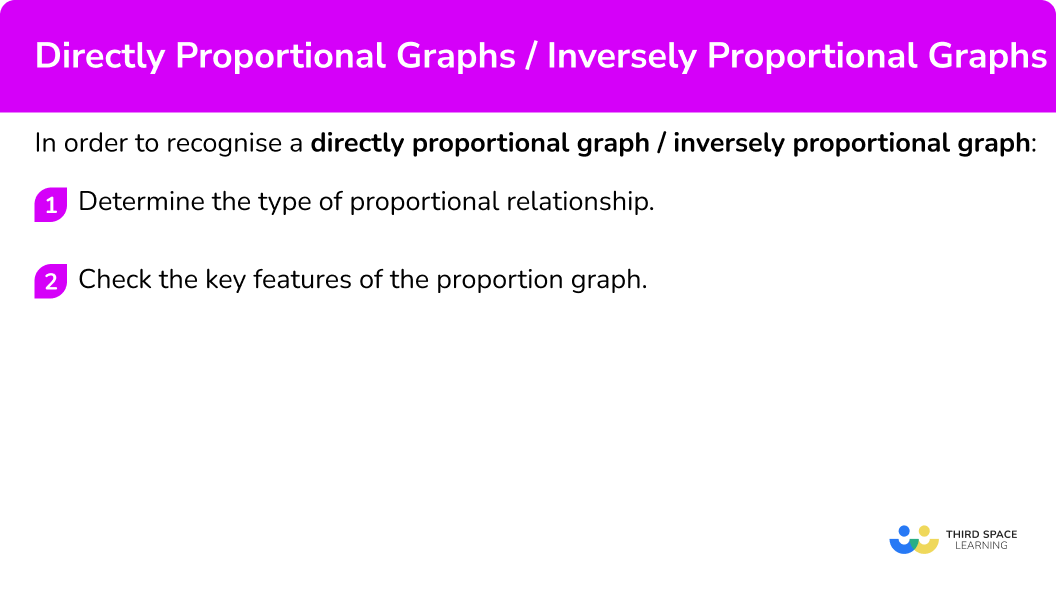
In order to recognise a directly proportional graph / inversely proportional graph:
- Determine the type of proportional relationship.
- Check the key features of the proportion graph.
Explain how to recognise a directly proportional graph / inversely proportional graph
Directly proportional graph / inversely proportional graph worksheet
Get your free directly proportional graph / inversely proportional graph worksheet of 20+ questions and answers. Includes reasoning and applied questions.
DOWNLOAD FREE Directly proportional graph / inversely proportional graph worksheet
Get your free directly proportional graph / inversely proportional graph worksheet of 20+ questions and answers. Includes reasoning and applied questions.
DOWNLOAD FREEDirectly proportional graph / inversely proportional graph examples
Example 1: recognise directly proportional graph
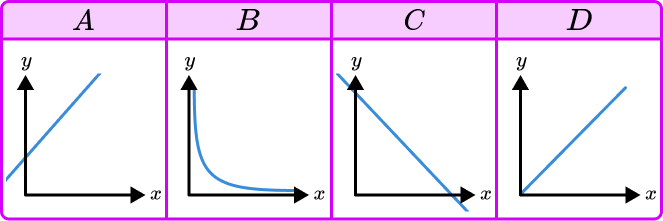
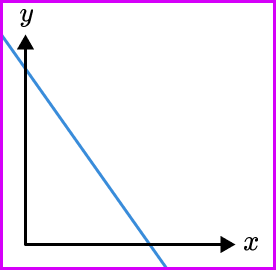
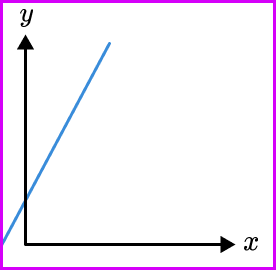
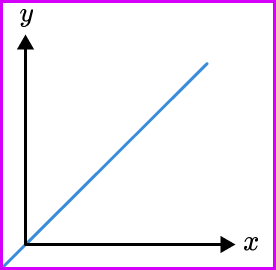
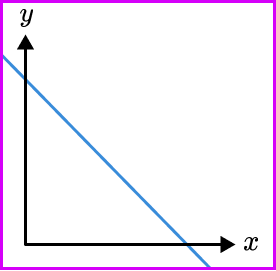
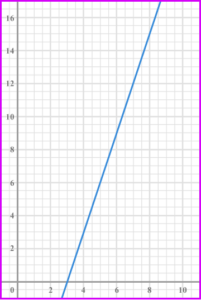
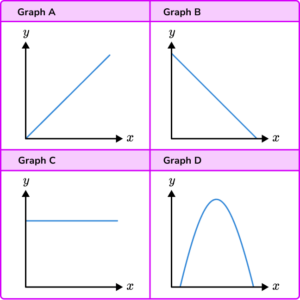
Which of these graphs indicate that y\propto{x}?
- Determine the type of proportional relationship.
As y\propto{x} means y is proportional to x, we are looking for a directly proportional graph.
2Check the key features of the proportion graph.
This direct proportion graph must be a straight line graph in the form y=kx, have a positive gradient, k, and intersect the origin (0,0).
The only graph listed that satisfies these three features is D.
Example 2: recognise inversely proportional graph
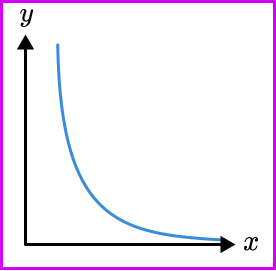
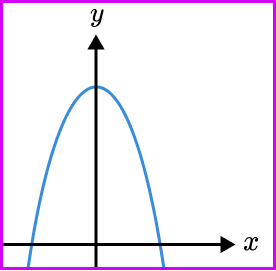
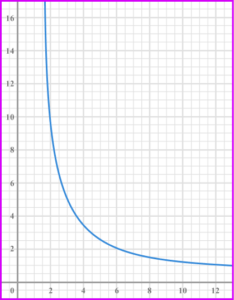
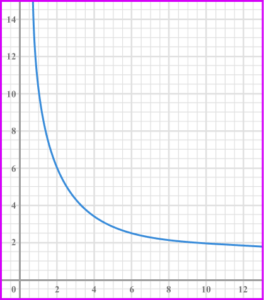
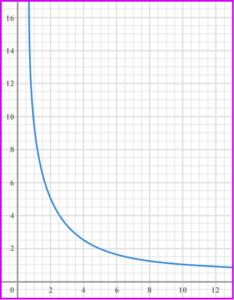
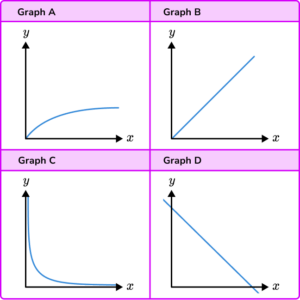
Which of these graphs indicate that y\propto\frac{1}{x} ?
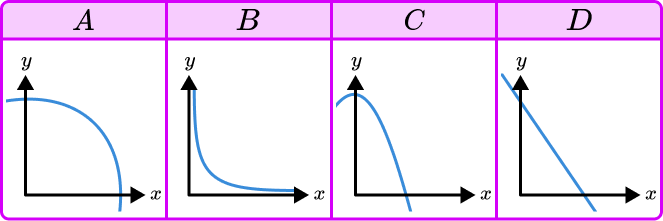
As y\propto\frac{1}{x} means y is proportional to the inverse of x, we are looking for an inversely proportional graph.
An inverse proportion graph must be a reciprocal graph that consists of one smooth curve that is located in the first quadrant only and does not touch any axis.
The only graph listed that satisfies these features is B.
How to use directly proportional graphs / inversely proportional graphs
In order to use directly proportional graphs / inversely proportional graphs:
- Locate the value on the correct axis.
- Use straight lines to find the corresponding value from the other axis.
- Read off the corresponding value from the other axis.
Explain how to use directly proportional graphs / inversely proportional graphs
Example 3: using a directly proportional graph
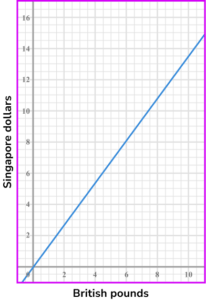
The graph shows the relationship between British pounds and Singapore dollars. Use the graph to estimate the number of British pounds (£) there are for 13 Singapore dollars (\$).
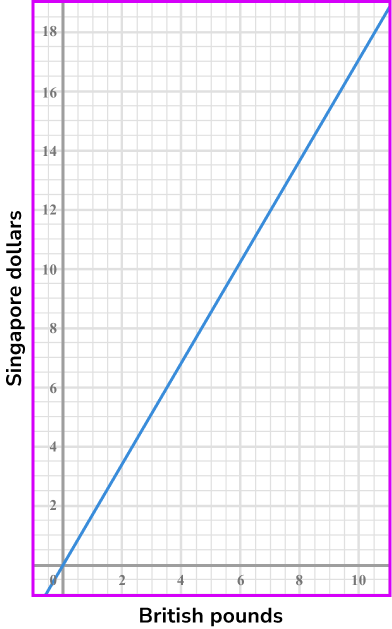
We have been given the value for Singapore dollars (\$13) and so we need to locate this value on the vertical axis.
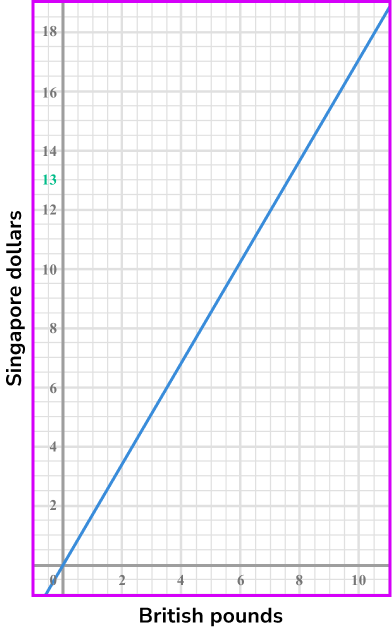
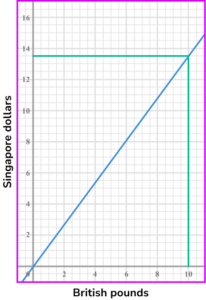
Draw a straight line across to the graph and then another straight line down to the other axis.
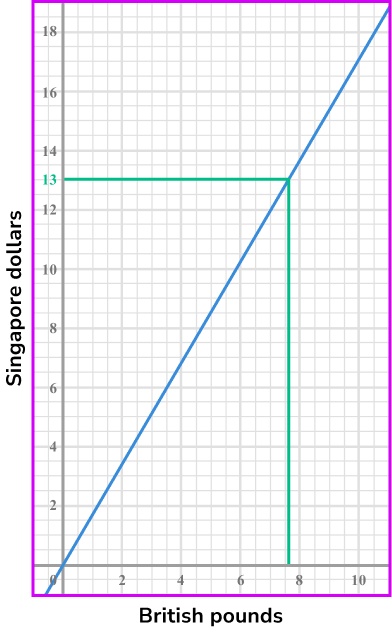
Looking at the horizontal axis the value we need is approximately 7.6.
\$13 is worth approximately £7.60.
Example 4: using an inversely proportional graph
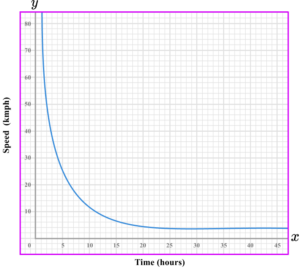
The graph shows the relationship between the number of workers and the time taken to complete a job. Use the graph to estimate how long it would take 10 workers to complete the job.
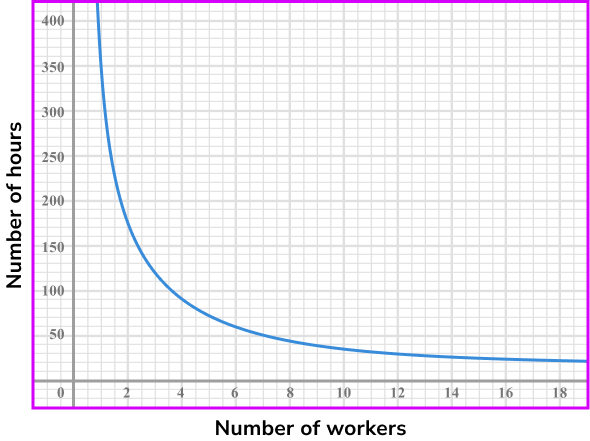
We have been given the value for the number of workers, so we find this value on the horizontal axis.

Draw a straight line up to the graph and then another straight line across.
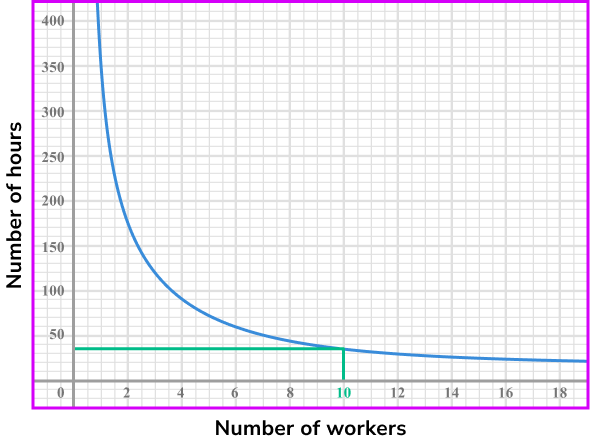
Looking at the vertical axis the value we need is approximately 35.
If there are 10 workers, the job will take around 35 hours to complete.
How to draw a directly proportional graph / inversely proportional graph
In order to draw a directly proportional graph / inversely proportional graph:
- Calculate the value of some coordinates for the graph.
- Plot the coordinates onto a set of axes.
- Connect the coordinates and extend across the quadrant.
Explain how to draw a directly proportional graph / inversely proportional graph
Example 5: drawing a directly proportional graph
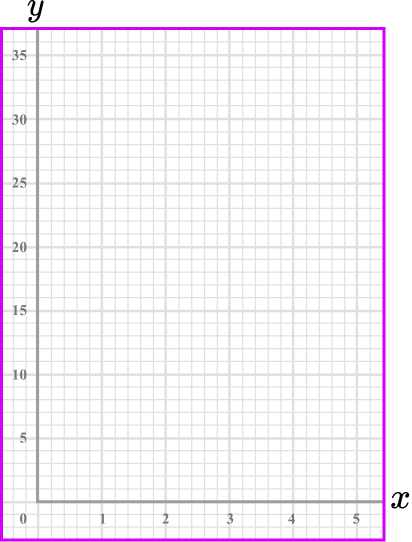
Given that y \propto x, use the table to draw the graph of the relationship between x and y on the axes provided.
| x | 1 | 2 | 3 | 4 | 5 |
|---|---|---|---|---|---|
| y | 12 |
As y\propto{x}, we can write the equation y=kx. As y=12 when x=3, substituting these values into the equation, we have
\begin{aligned} 12&=k\times{3}\\\\ 12\div{3}&=k\\\\ k&=4 \end{aligned}
So we are plotting the graph of the equation y=4x.
Substituting the other x -values into the equation y=4x, we have
| x | 1 | 2 | 3 | 4 | 5 |
|---|---|---|---|---|---|
| y | 4 \times 1=4 | 4 \times 2=8 | 12 | 4 \times 4=16 | 4 \times 5=20 |
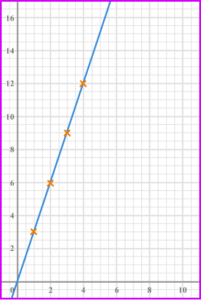
Plotting the coordinates (1,4), \ (2,8), \ (3,12), \ (4,16) and (5,20), we have
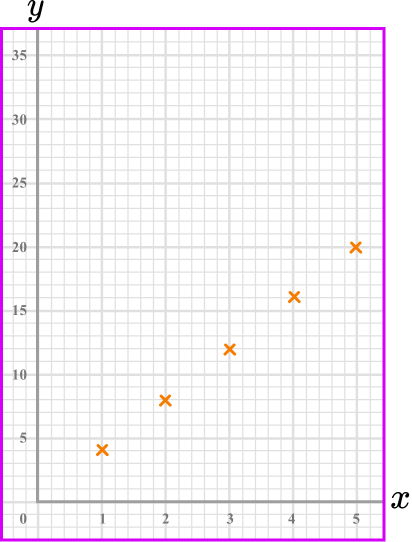
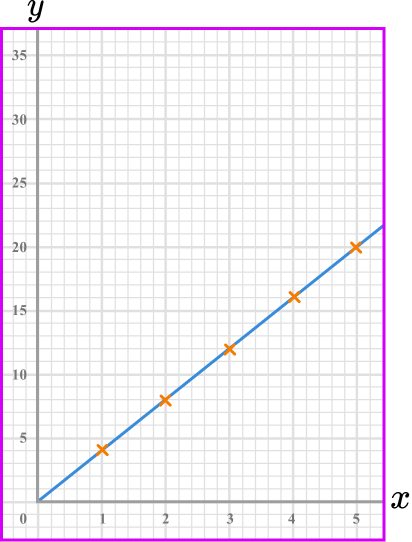
Since the variables are directly proportional, we need to draw a straight line through the coordinates.
Example 6: drawing an inversely proportional graph
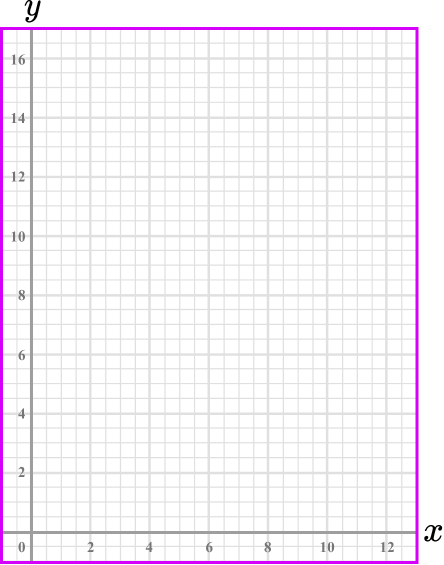
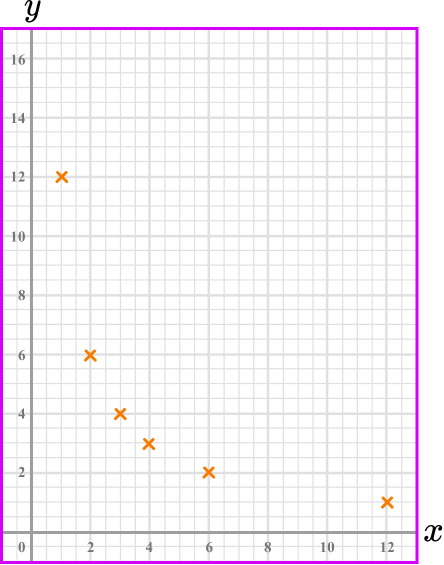
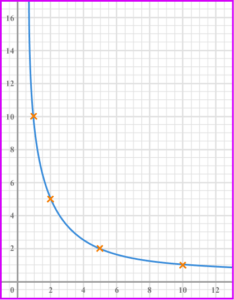
The pair of variables, x and y, are inversely proportional. The equation linking the variables is y=\frac{12}{x}. By completing the table, draw the graph of y=\frac{12}{x}.
| x | 1 | 2 | 3 | 4 | 6 | 12 |
|---|---|---|---|---|---|---|
| y | 12 |
Substituting the x -values into the equation y=\frac{12}{x}, we have
| x | 1 | 2 | 3 | 4 | 6 | 12 |
|---|---|---|---|---|---|---|
| y | 12 | \frac{12}{2}=6 | \frac{12}{3}=4 | \frac{12}{4}=3 | \frac{12}{6}=2 | \frac{12}{12}=1 |
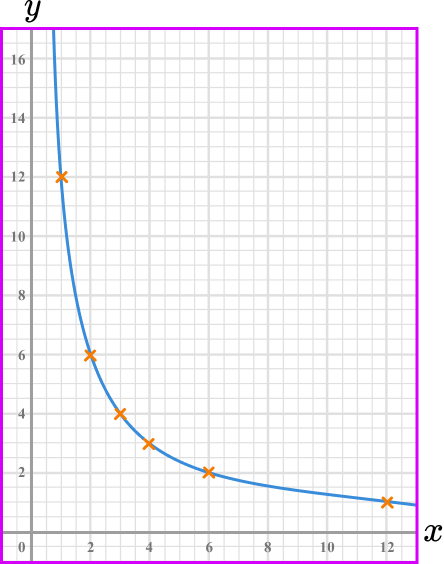
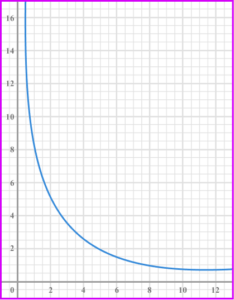
Plotting the coordinates (1,12), \ (2,6), \ (3,4), \ (4,3), \ (6,2), and (12,1), we have
Since the variables are inversely proportional, we need to draw a smooth curve through the coordinates.
Common misconceptions
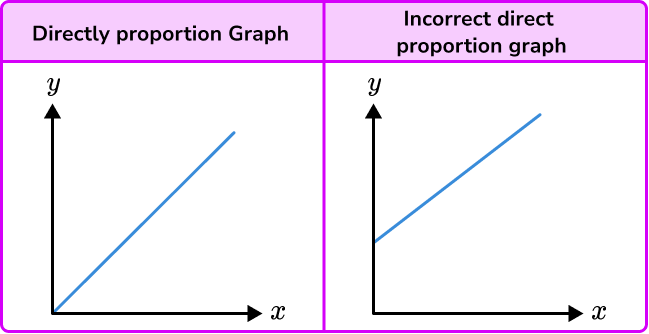
- Direct proportion graph does not intercept the origin
The graph of direct proportion is assumed to simply be a straight line graph and so the y -intercept can vary from the origin. This is not correct. The graph of a directly proportional relationship intercepts the origin, always. This is also true for direct proportion graphs in the form y=kx^n.
- Inverse proportion graph does not intercept any axis
The graph of an inversely proportional relationship is not a straight line with a negative gradient. Also, the graph does not intercept any axis. Be careful when drawing this curve.
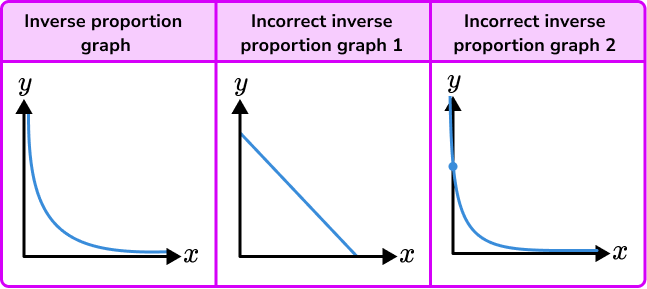
- Graphs representing inverse proportion
Graphs representing inverse proportion can be easily confused with other curves. You are looking for a decreasing curve, as one variable increases the other decreases.
Related lessons on directly proportional graph / indirectly proportional graph
Directly proportional graph / indirectly proportional graph is part of our series of lessons to support revision on proportion. You may find it helpful to start with the main proportion lesson for a summary of what to expect, or use the step by step guides below for further detail on individual topics. Other lessons in this series include:
Practice inverse proportion formula questions
1. Which of these graphs indicate y\propto{x}?


The graph of two variables that are directly proportional have the following features,
- May be a straight line graph, quadratic, cubic or root.
- Intersects the origin (0,0)
2. Which of these graphs represents the relationship y\propto\frac{1}{x}?

The graph of two variables that are inversely proportional have the following features,
- Always a reciprocal graph
- One smooth curve
- Located in the first quadrant only
- Does not touch any axis
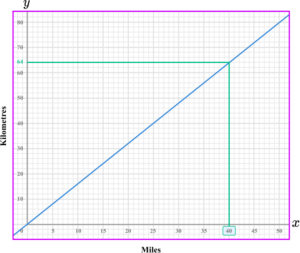
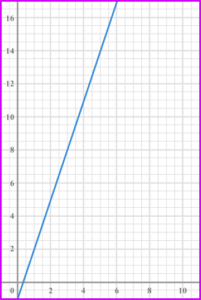
3. The graph shows the relationship between kilometres and miles. Use the graph to find how many kilometres are equivalent to 40 miles.
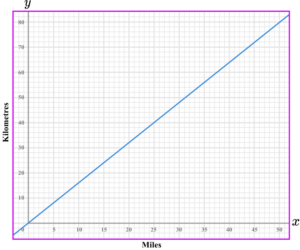
Find 40 miles on the horizontal axis. Draw a vertical line up to the graph, and then a horizontal line across to the other axis. Read off the value from the vertical axis.
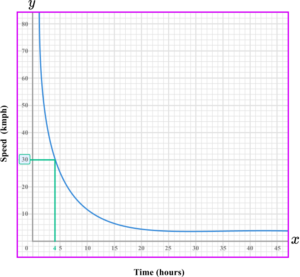
4. The graph shows the relationship between speed and time of a journey. Find the time taken for the journey when the speed is 30 \ km/h.
5 hours
7 hours
4 hours
6 hours
Find 30 \ km/h on the vertical axis. Draw a horizontal line across to the graph, and then a vertical line down to the other axis. Read off the value from the horizontal axis.
5. Which is the correct graph for the direct proportion relationship y=3x^2?
Calculating some coordinates using the equation y=3x, we have
| x | 1 | 2 | 3 | 4 |
| y | 3 | 6 | 9 | 12 |
6. Which is the correct graph for the inverse proportional relationship y=\frac{10}{x}?
Calculating some coordinates for the equation y=\frac{10}{x}, we have
| x | 1 | 2 | 5 | 10 |
| y | 10 | 5 | 2 | 1 |
Directly proportional graphs / inversely proportional graphs GCSE questions
1. The graphs show different relationships between the variables x and y.
Identify the graph which shows that y\propto{x}.
(1 mark)
Graph A
(1)
2. The graphs show different relationships between the variables x and y.
Identify the graph which shows y\propto \frac{1}{x}.
(1 mark)
Graph C
(1)
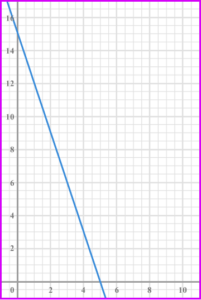
3. Here is a conversion graph to change British pounds (£) to US dollars (\$).
Sara changes £200 into US dollars.
How many US dollars does she get?
(3 marks)
£10 = \$13.50
(1)
200\div 10=20 , so 20\times 13.5=270 .
(1)
\$270(1)
Learning checklist
You have now learned how to:
The next lessons are
Still stuck?
Prepare your KS4 students for maths GCSEs success with Third Space Learning. Weekly online one to one GCSE maths revision lessons delivered by expert maths tutors.

Find out more about our GCSE maths tuition programme.