FREE DOWNLOAD
Graphing Inequalities Worksheet
Help your students prepare for their Maths GCSE with this free graphing inequalities worksheet of 30+ questions and answers
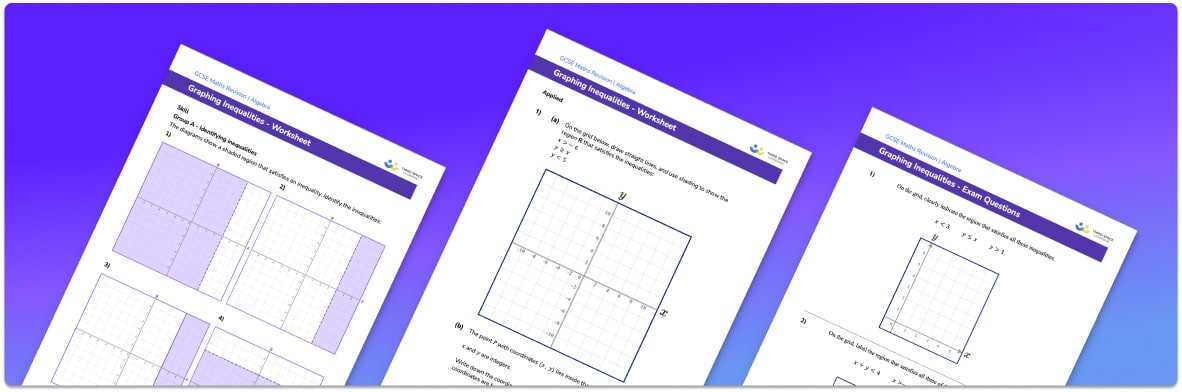
- Section 1 of the graphing inequalities worksheet contains 20+ skills-based graphing inequalities questions, in 3 groups to support differentiation
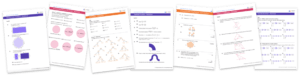
- Section 2 contains 3 applied graphing linear inequalities questions with a mix of word problems and deeper problem solving questions
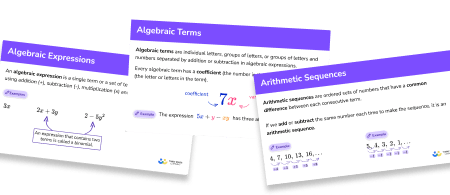
- Section 3 contains 3 foundation and higher level GCSE exam style questions on graphing inequalities
- Answers and a mark scheme for all graphing inequalities questions are provided
- Questions follow variation theory with plenty of opportunities for students to work independently at their own level
- All questions created by fully qualified expert secondary maths teachers
- Suitable for GCSE maths revision for AQA, OCR and Edexcel exam boards
Raise maths attainment across your school with hundreds of flexible and easy to use GCSE maths worksheets and lessons designed by teachers for teachers.
Graphing inequalities at a glance
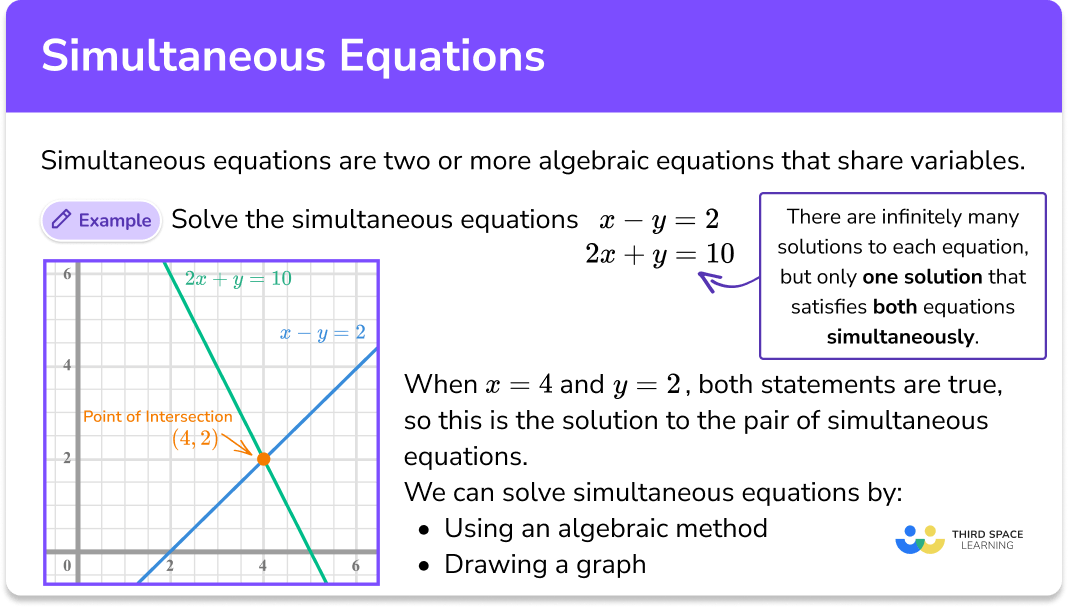
Inequalities can be represented graphically. This is useful as it allows us to look for solutions which satisfy more than one inequality at a time. To represent inequalities graphically, we draw the relevant line on a grid and can identify the solutions to the inequality through shading.
The type of inequality symbol is important and inequalities that have a > or < symbol are drawn with a dotted line whereas those that have a or symbol are drawn with a solid line.
For example, the inequality x<1 is represented by drawing the line x=1 (using a dotted line). Since x is less than 1, the solution to the inequality is the area to the left of the line. The inequality y>x+2 can be represented by drawing the line y=x+2 (a solid line). The solution is the line and the area above the line. Single variable inequalities will be indicated by horizontal lines or vertical lines and inequalities in both x and y will be indicated by diagonal lines.
Looking forward, students can then progress to additional inequalities worksheets and other algebra worksheets, for example a sequences worksheet, simultaneous equations worksheet or straight line graphs worksheet.
For more teaching and learning support on Algebra our GCSE maths lessons provide step by step support for all GCSE maths concepts.
Do you have students who need additional support?
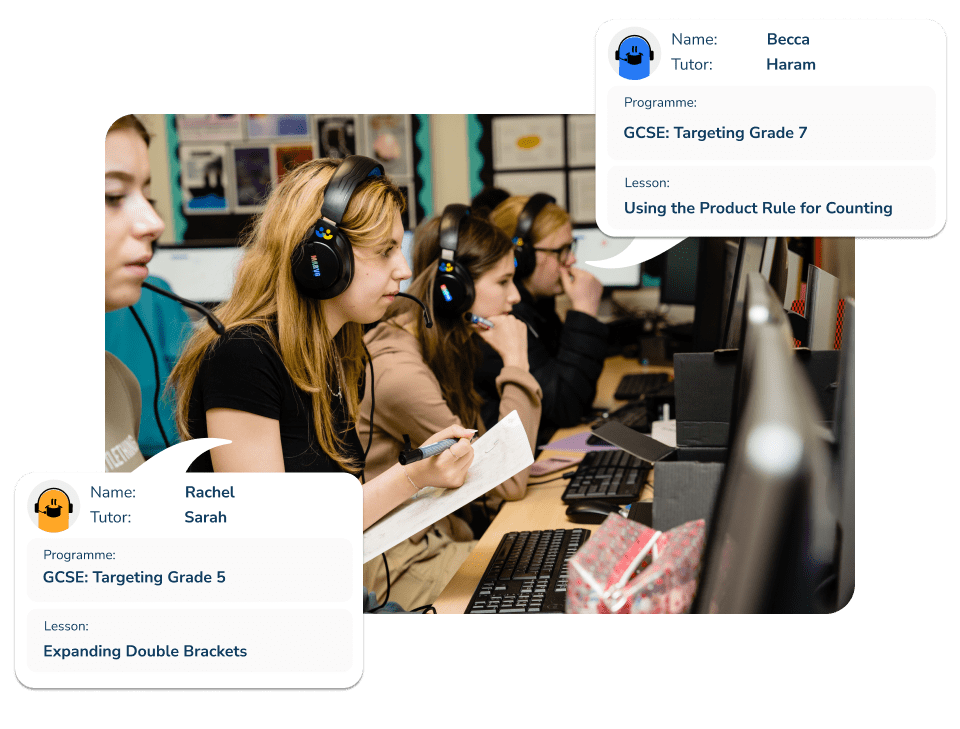
With Third Space Learning's secondary maths tutoring programmes, students in Year 7-11 receive regular one to one maths tutoring to address gaps, build confidence and boost progress.
"My confidence in the tutoring is high. We've had some phenomenal results. I even had one girl get a Grade 8 this year; she came to every tutoring session."
Stacey Atkins, Maths Director, Outwood Grange Academies Trust