FREE DOWNLOAD
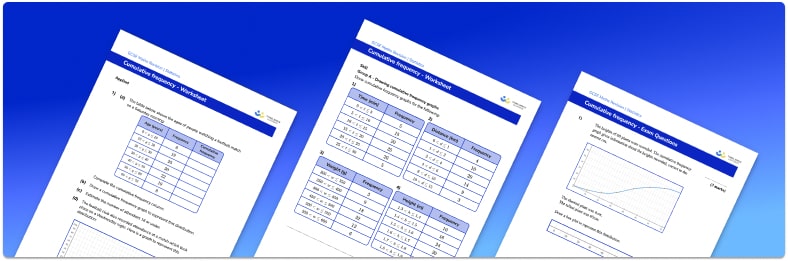
Cumulative Frequency Worksheet
Help your students prepare for their Maths GCSE with this free cumulative frequency worksheet of 21 questions and answers
- Section 1 of the cumulative frequency worksheet contains 16 skills-based cumulative frequency questions, in 3 groups to support differentiation
- Section 2 contains 2 applied cumulative frequency questions with a mix of worded problems and deeper problem solving questions
- Section 3 contains 3 foundation and higher level GCSE exam style questions on cumulative frequency
- Answers and a mark scheme for all cumulative frequency questions are provided
- Questions follow variation theory with plenty of opportunities for students to work independently at their own level
- All questions created by fully qualified expert secondary maths teachers
Suitable for GCSE maths revision for AQA, OCR and Edexcel exam boards
Unlock access to download your free resource
You can unsubscribe at any time (each email we send will contain an easy way to unsubscribe). To find out more about how we use your data, see our privacy policy.
Raise maths attainment across your school with hundreds of flexible and easy to use GCSE maths worksheets and lessons designed by teachers for teachers.
Cumulative frequency at a glance
Cumulative frequency is a running total of frequencies. If a set of grouped data is presented in a frequency table, it is useful to add a cumulative frequency column on the right hand side of the table, and record the running totals in here, creating a cumulative frequency table.
On a cumulative frequency graph or cumulative frequency diagram, the data groups are marked on the x axis and cumulative frequency on the y axis. We then plot the endpoint of each group or class interval against its cumulative frequency.
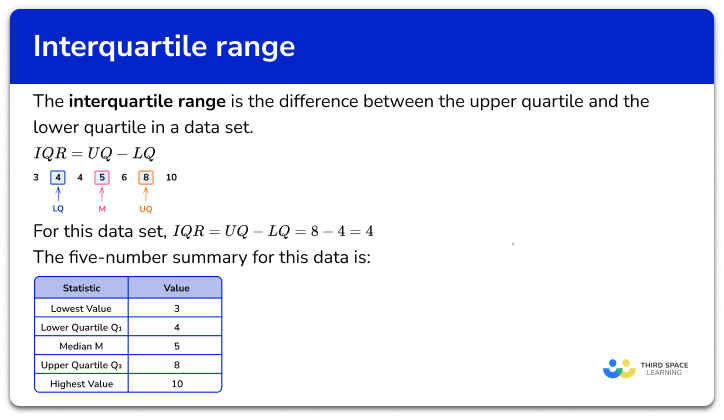
A cumulative frequency curve can be used to estimate the median and quartiles. To estimate the median (the location where 50% of the data lies above and below this value), find the midpoint of the cumulative frequency axis, then read off the corresponding x value. To find the lower quartile, we read off the x value corresponding to one-quarter (25%) of the cumulative frequency axis, and to find the upper quartile, we read off the x value corresponding to three-quarters (75%) of the cumulative frequency axis.
We can use these values, along with the minimum value and maximum value from the graph, to draw an estimated box and whisker plot to represent the distribution. We can also estimate the interquartile range (IQR) by subtracting the lower quartile from the upper quartile.
We can use cumulative frequency curves to compare distributions of two or more data sets by plotting the curves on the same set of axes and comparing the shapes of the curves. This can also be done using their associated box plot.
Looking forward, students can then progress to additional Statistics worksheets, for example the averages worksheet, the box plots worksheet, or the histograms worksheet.
For more teaching and learning support on Statistics our GCSE maths lessons provide step by step support for all GCSE maths concepts.
Do you have students who need additional support to achieve their target GCSE maths grade?

There will be students in your class who require individual attention to help them succeed in their maths GCSEs. In a class of 30, it’s not always easy to provide.
Help your students feel confident with exam-style questions and the strategies they’ll need to answer them correctly with personalised online one to one tutoring from Third Space Learning
Lessons are selected to provide support where each student needs it most, and specially-trained GCSE maths tutors adapt the pitch and pace of each lesson. This ensures a personalised revision programme that raises grades and boosts confidence.