FREE DOWNLOAD
Quartile And Interquartile Range Worksheet
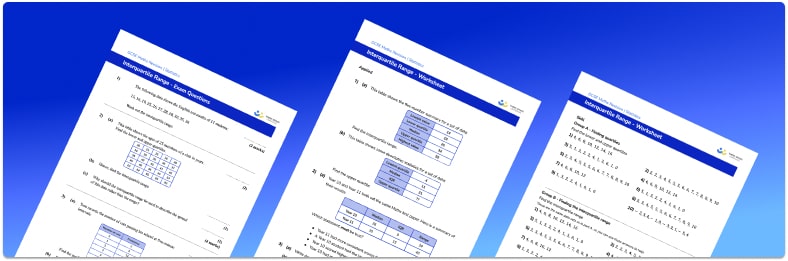
Help your students prepare for their Maths GCSE with this free interquartile range worksheet of 30 questions and answers
- Section 1 of the interquartile range worksheet contains 24 skills-based interquartile range questions, in 3 groups to support differentiation
- Section 2 contains 3 applied interquartile range questions with a mix of word problems and deeper problem solving questions
- Section 3 contains 3 foundation and higher level GCSE exam style interquartile range questions
- An answer key and a mark scheme for all interquartile range questions are provided
- Questions follow variation theory with plenty of opportunities for students to work independently at their own level
- All questions created by fully qualified expert secondary maths teachers
Suitable for GCSE maths revision for AQA, OCR and Edexcel exam boards
Raise maths attainment across your school with hundreds of flexible and easy to use GCSE maths worksheets and lessons designed by teachers for teachers.
Interquartile range at a glance
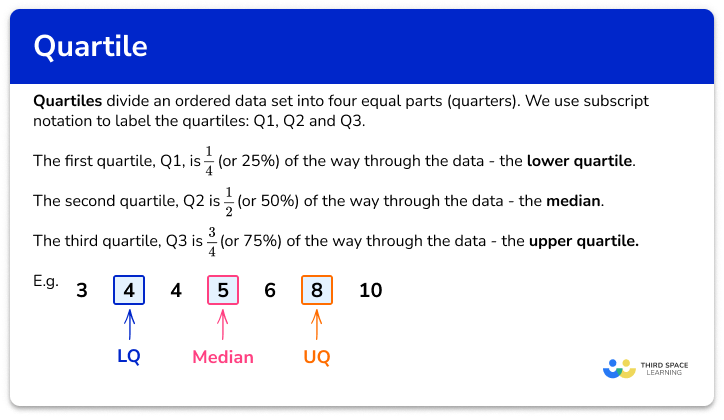
The interquartile range (or IQR) is a measure of spread or variability, and is used alongside the median as a measure of central tendency. To calculate the interquartile range for a set of data, we first find the lower quartile (the data item one quarter or 25% of the way through the data set) and the upper quartile (the data item three quarters or 75% of the way through the data set). We then subtract the lower quartile from the upper quartile to get the interquartile range.
A box and whisker plot is a graph showing the lower quartile (first quartile), median (second quartile), and upper quartile (third quartile), along with the minimum and maximum data points. The interquartile range of the data can be found from a box plot by identifying the lower and upper quartiles and proceeding as above.
The main advantage of using the median and the interquartile range is that they are not affected by extreme values. They are therefore appropriate for use with a skewed data set, or one with outliers.
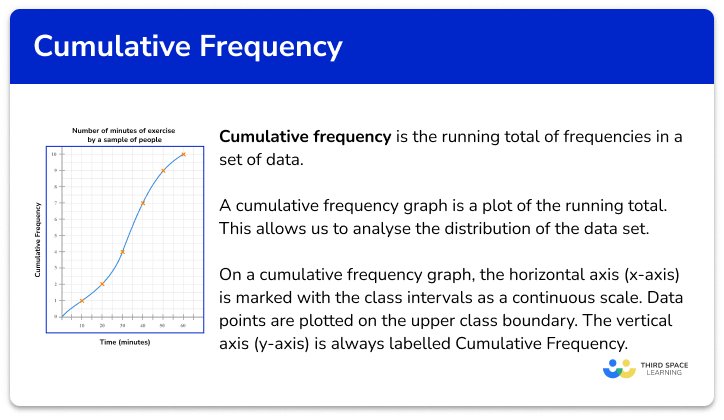
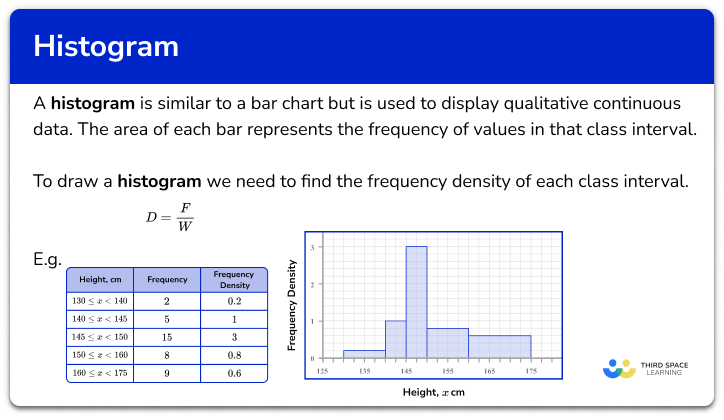
Looking forward, students can then progress to additional Statistics worksheets, for example the box and whisker plot worksheet, the mean, median and mode worksheet, or the cumulative frequency worksheet.
For more teaching and learning support on Statistics our GCSE maths lessons provide step by step support for all GCSE maths concepts.

Do you have students who need additional support?
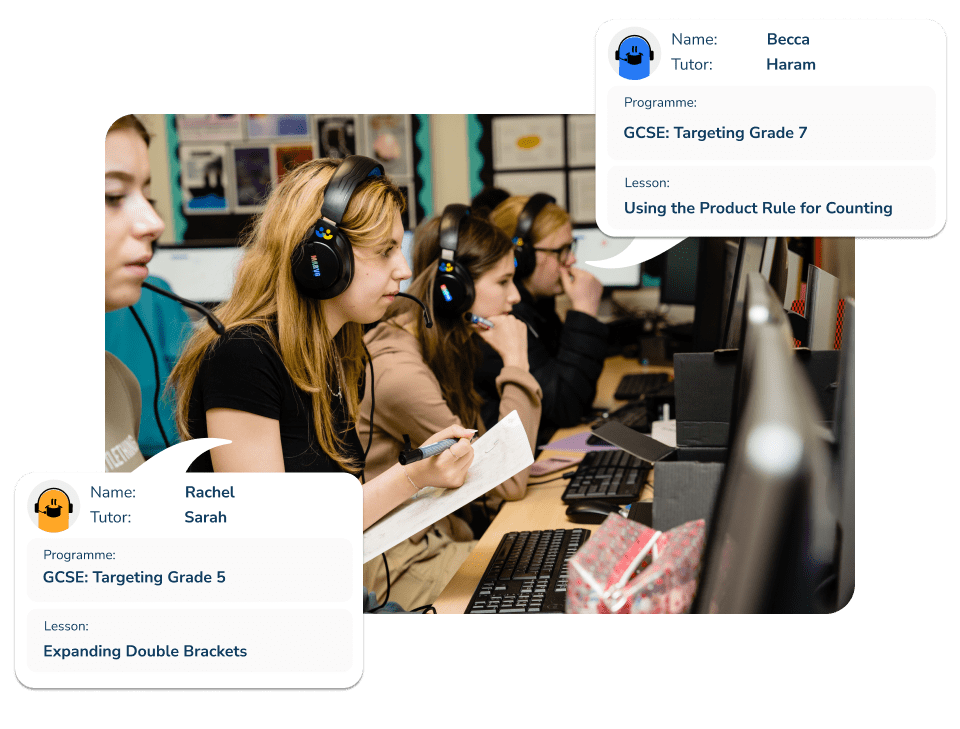
With Third Space Learning's secondary maths tutoring programmes, students in Year 7-11 receive regular one to one maths tutoring to address gaps, build confidence and boost progress.
"My confidence in the tutoring is high. We've had some phenomenal results. I even had one girl get a Grade 8 this year; she came to every tutoring session."
Stacey Atkins, Maths Director, Outwood Grange Academies Trust