FREE DOWNLOAD
X And Y Axis Worksheet
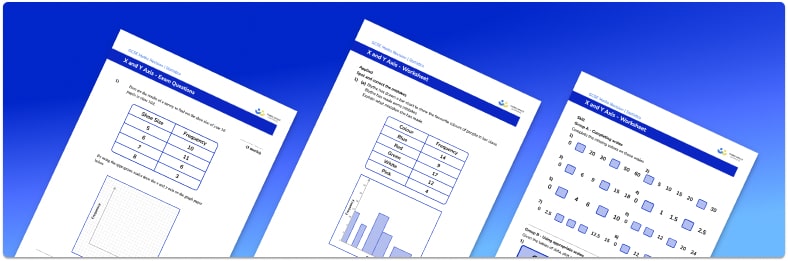
Help your students prepare for their Maths GCSE with this free x and y axis worksheet of 20 questions and answers
- Section 1 of the x and y axis worksheet contains 16 skills-based x and y axis questions, in 3 groups to support differentiation
- Section 2 contains 2 applied x and y axis questions with a mix of worded problems and deeper problem solving questions
- Section 3 contains 2 foundation and higher level GCSE exam style x and y axis questions
- Answers and a mark scheme for all x and y axis questions are provided
- Questions follow variation theory with plenty of opportunities for students to work independently at their own level
- All questions created by fully qualified expert secondary maths teachers
- Suitable for GCSE maths revision for AQA, OCR and Edexcel exam boards
Raise maths attainment across your school with hundreds of flexible and easy to use GCSE maths worksheets and lessons designed by teachers for teachers.
x and y axis at a glance
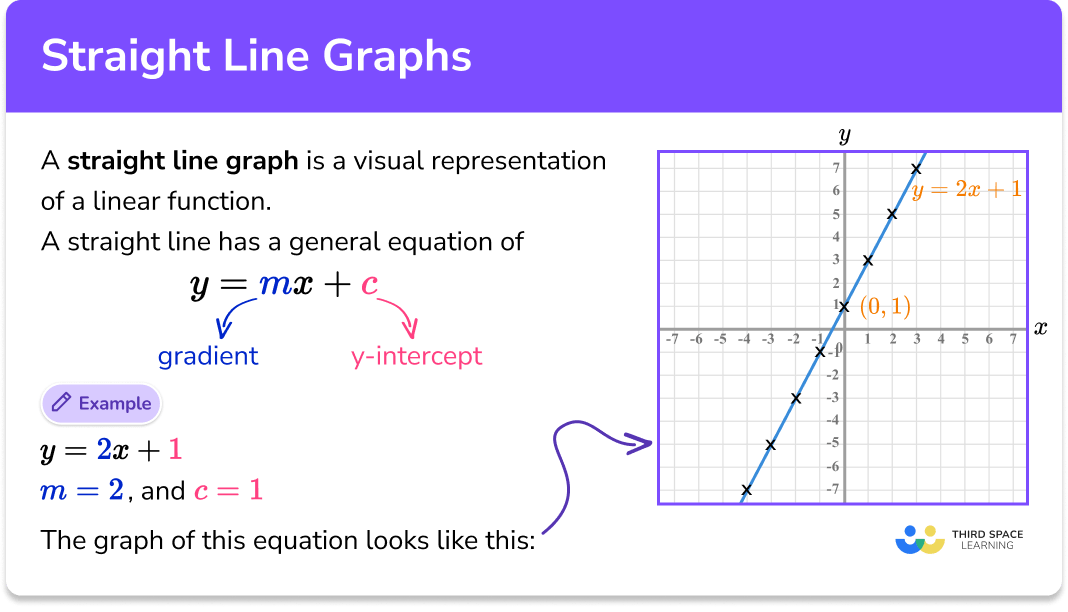
In order to plot a graph, we first need to draw a set of axes. When drawing a set of axes (also called a coordinate grid or coordinate plane) we draw a horizontal line which is the x axis, and a vertical line which is the y axis. We usually draw 1 quadrant (known as the first quadrant) if we only want to show positive values or 4 quadrants if we want to show positive and negative values.
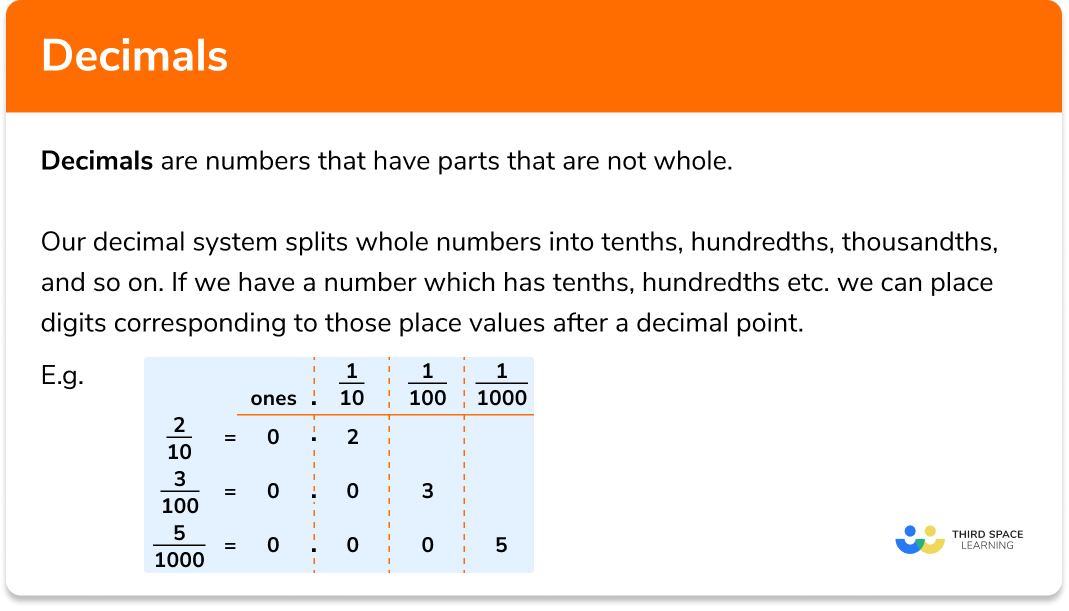
When labelling the axis, the scale is dependent upon the range of values to be displayed. We often use integers, but the scale could range from fractions or decimals to hundreds of thousands or millions.
Coordinates are ordered pairs of numbers written in the form (x-coordinate, y-coordinate). A coordinate must be contained within a set of round brackets. When plotting points, we go along to the x value on the x axis and up to the y value on the y axis.
When drawing a graph it is always best to use graph paper to improve the accuracy of plotting. A template for the axes is often given in exams.
Axes and graphs can also be explored on Excel, Autograph and other suitable software.
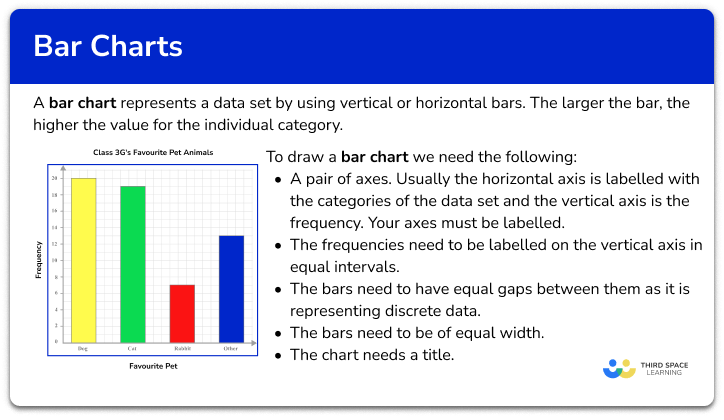
Looking forward, students can then progress to additional Statistics worksheets, for example a mean, median, mode and range worksheet or frequency table worksheet.
For more teaching and learning support on Statistics our GCSE maths lessons provide step by step support for all GCSE maths concepts.
Do you have students who need additional support?
With Third Space Learning's secondary maths tutoring programmes, students in Year 7-11 receive regular one to one maths tutoring to address gaps, build confidence and boost progress.
"My confidence in the tutoring is high. We've had some phenomenal results. I even had one girl get a Grade 8 this year; she came to every tutoring session."
Stacey Atkins, Maths Director, Outwood Grange Academies Trust