GCSE Tutoring Programme
Our chosen students improved 1.19 of a grade on average - 0.45 more than those who didn't have the tutoring.
In order to access this I need to be confident with:
SOHCAHTOA Straight line graphs Quadratic graphs Reciprocal graph Cubic graph Fractions Decimals Rearranging equations Solving equations Exact trig valuesThis topic is relevant for:

Sin Cos Tan Graphs
Here we will learn about sin, cos and tan graphs, including sketching each type of trigonometric graph, recognising key features about each graph, and using the graphs to answer questions.
You can also download the following free sin cos tan graphs resources all suitable for those following Edexcel, AQA or OCR exam boards:
What are sin cos tan graphs?
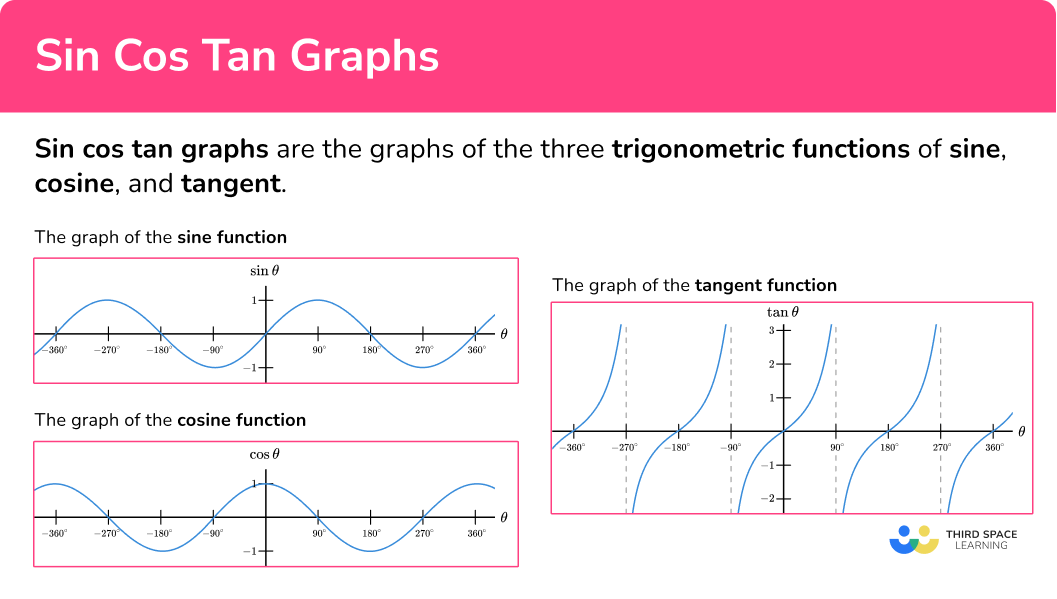
Sin cos tan graphs are the graphs of the three trigonometric functions of sine, cosine, and tangent. We need to be able to sketch and label the graph of each trigonometric function.
Notice that the horizontal \textbf{x} -axis is labelled as the angle \textbf{θ} and the vertical \textbf{y} -axis is labelled as the trig function of the angle \textbf{θ}.
We can use the graphs to work out the unknown angles in a triangle.
Let’s see how we can create these graphs using the unit circle.
What are sin cos tan graphs?
The unit circle
Here is the unit circle (a circle with the radius of 1 ) with the centre at (0,0).
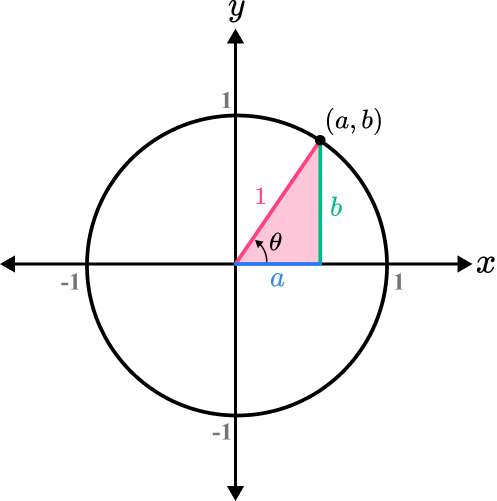
The point on the circumference of the circle can be labelled as (a,b), creating a right-angled triangle with a width of a, height of b and a hypotenuse of 1 (as the radius of the circle is equal to 1 ).
As \sin(\theta)=\frac{O}{H} we can say that \sin(\theta)=\frac{b}{1} and so the height of the triangle is b=\sin(\theta).
Where O is opposite, A is adjacent and H is hypotenuse.
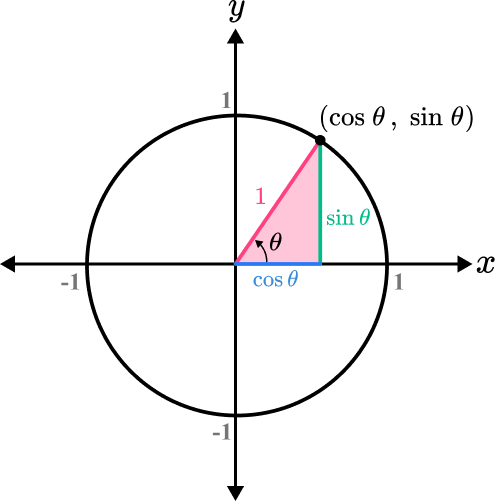
As \cos(\theta)=\frac{A}{H} we can say that \cos(\theta)=\frac{a}{1} and so the width of the triangle is a=\cos(\theta).
The point on the unit circle is therefore the coordinate (\cos\theta,\sin\theta),
Trigonometry worksheet
Get your free trigonometry worksheet of 20+ questions and answers. Includes reasoning and applied questions.
DOWNLOAD FREE Trigonometry worksheet
Get your free trigonometry worksheet of 20+ questions and answers. Includes reasoning and applied questions.
DOWNLOAD FREEUsing the unit circle to determine all values of sin θ
As we move the point (\cos\theta,\sin\theta) around the circumference of the circle in an anticlockwise direction, the y value of the coordinate on the unit circle gives us the value for \sin{\theta}.
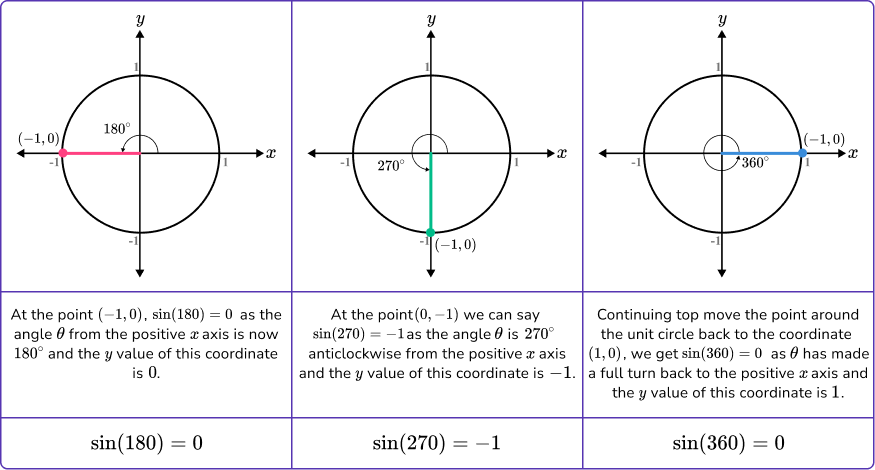
We can do this for every point on the circumference, not just the intersection with the axes.
As we continue to turn anticlockwise beyond 360 degrees, the values of \sin{\theta} will repeat themselves, making the sine function a periodic function. We can also turn the point in the clockwise direction to obtain values for negative \theta using the same principles.
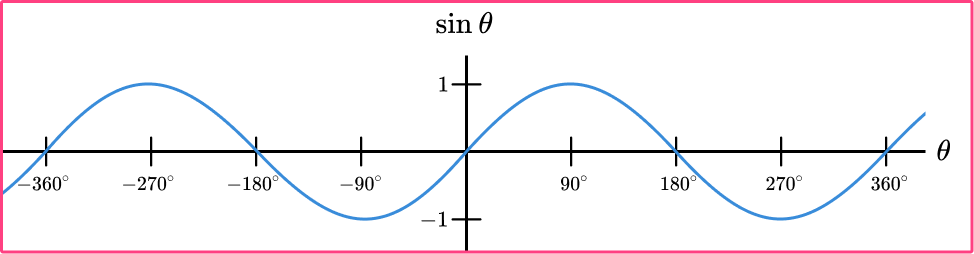
This gives us the graph of the sine function for -360^{\circ}\leq\theta\leq{360}^{\circ} .
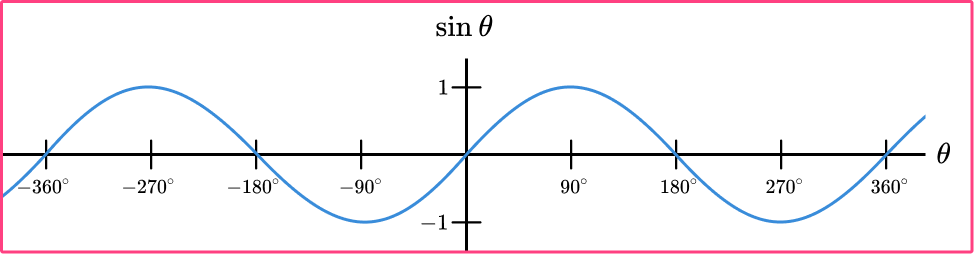
- The graph passes through the origin, (0,0).
- The graph is continuous and repeats every 360^{\circ} (it is periodic).
- The maximum value of \sin{\theta} is 1 and the minimum value of \sin{\theta} is -1.
Step-by-step guide: Sin graph
Using the unit circle to determine all values of cos θ
As we move the point (\cos{\theta},\sin{\theta}) around the circumference of the circle in an anticlockwise direction, the x value of the coordinate on the unit circle gives us the value for \cos{\theta}.
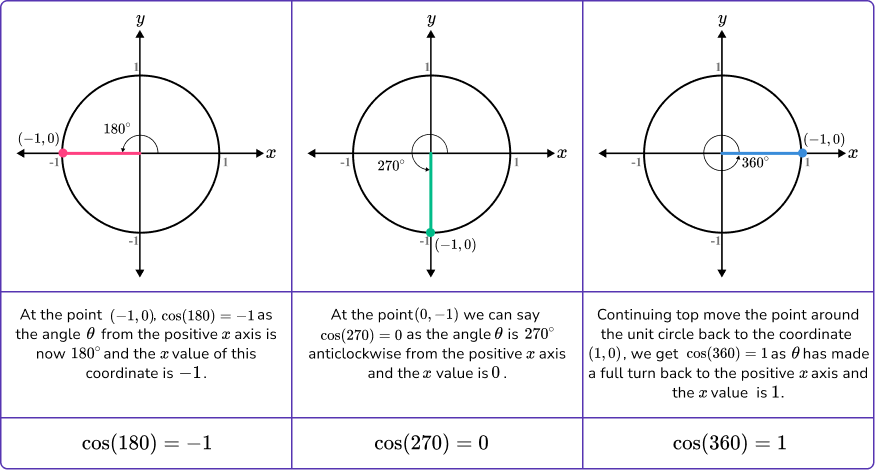
We can do this for every point on the circumference, not just the intersection with the axes.
We can continue to turn anticlockwise beyond 360 degrees and so the values of \cos{\theta} will repeat themselves, making the cosine function a periodic function (the same as the sine function). We can also turn the point in the clockwise direction to obtain values for negative \theta using the same principles.
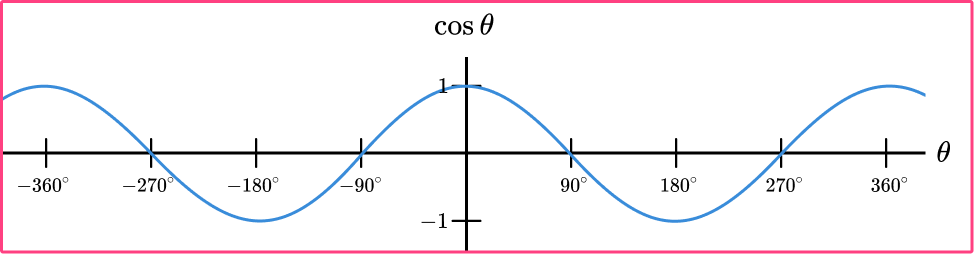
This gives us the graph of the cosine function for -360^{\circ}\leq\theta\leq{360}^{\circ} .
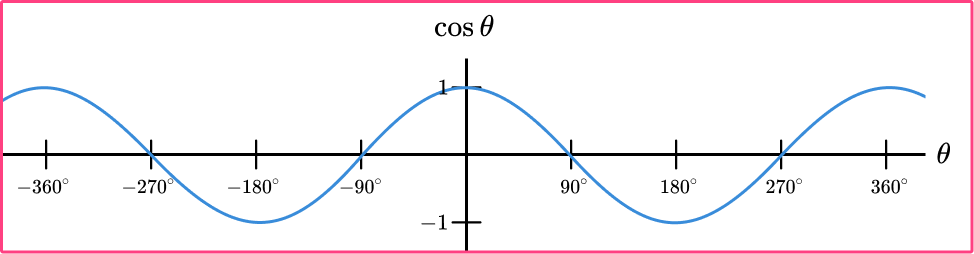
- The graph intersects the y- axis at (1,0).
- The graph is continuous and repeats every 360^{\circ} (it is periodic).
- The maximum value of \cos{\theta} is 1 and the minimum value of \cos{\theta} is -1.
Step-by-step guide: Cos graph
Using the unit circle to determine all values of tan θ
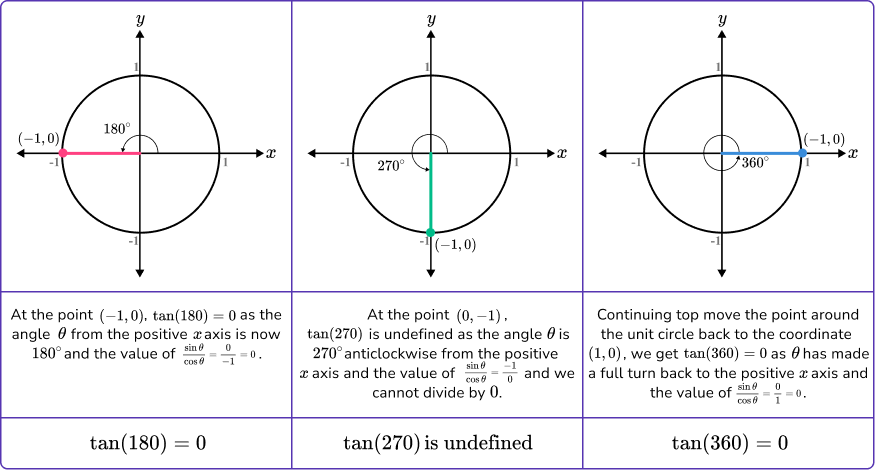
The values of \tan{\theta} are determined slightly differently to the values of \sin{\theta} and \cos{\theta}.
This is because \tan{\theta}=\frac{O}{A}. As the opposite side of the triangle is b=\sin{\theta} and the adjacent side of the triangle is a=\cos{\theta}, this means that \tan{\theta}=\frac{b}{a}=\frac{\sin{\theta}}{\cos{\theta}}.
This means that in order to determine the value of \tan \theta we need to divide the \textbf{y} coordinate by the \textbf{x} coordinate.
As we move the point (\cos{\theta},\sin{\theta}) around the circumference of the circle in an anticlockwise direction, the value of \frac{\sin{\theta}}{\cos{\theta}} of the coordinate gives us the value for \tan{(\theta)}.
We can do this for every point on the circumference, not just the intersection with the axes.
We can continue to turn anticlockwise beyond 360 degrees and so the values of \tan \theta will repeat themselves, making the tangent function a periodic function. We can also turn the point in the clockwise direction to obtain values for negative \theta using the same principles.
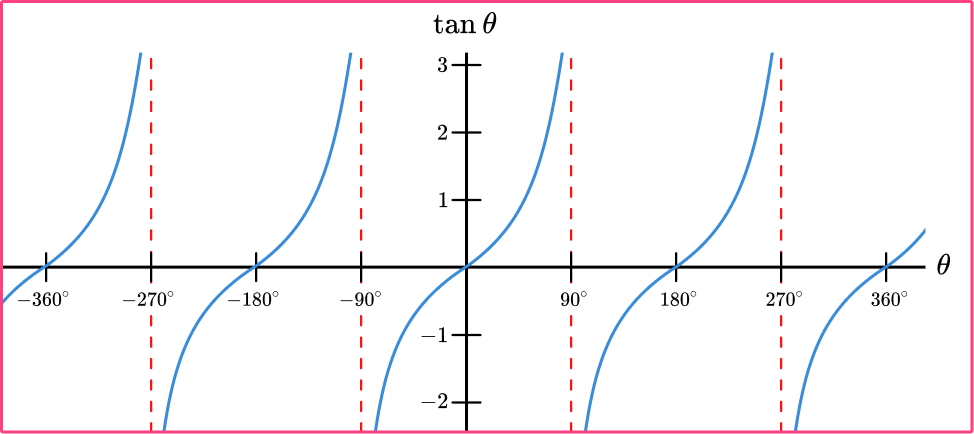
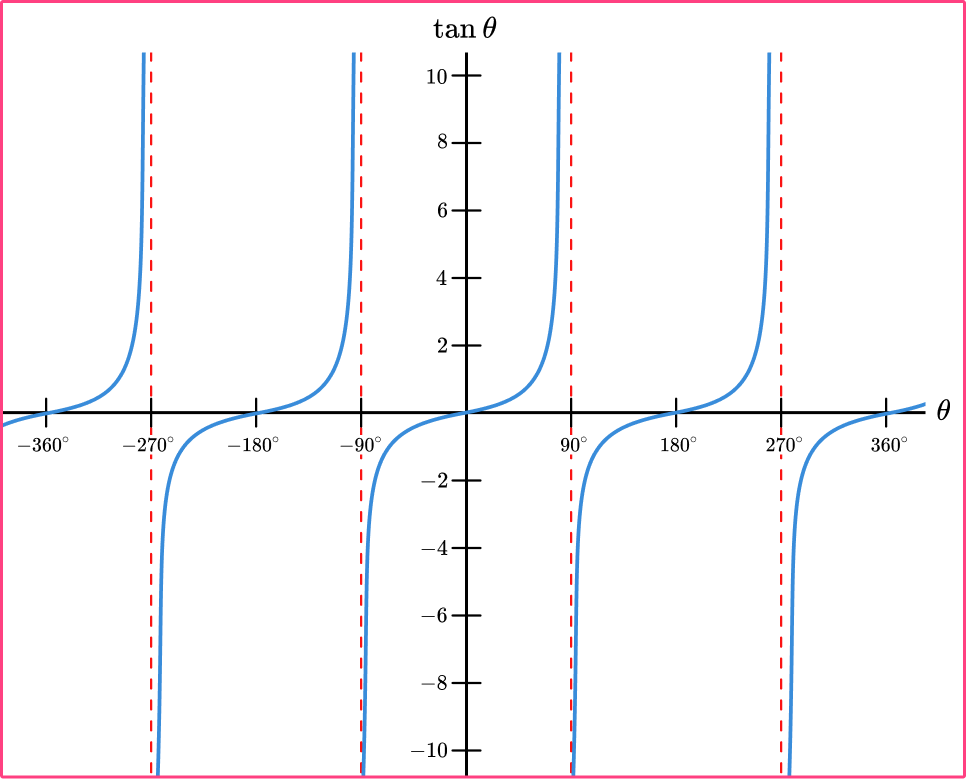
This gives us the graph of the tangent function for -360^{\circ}\leq\theta\leq{360}^{\circ} .
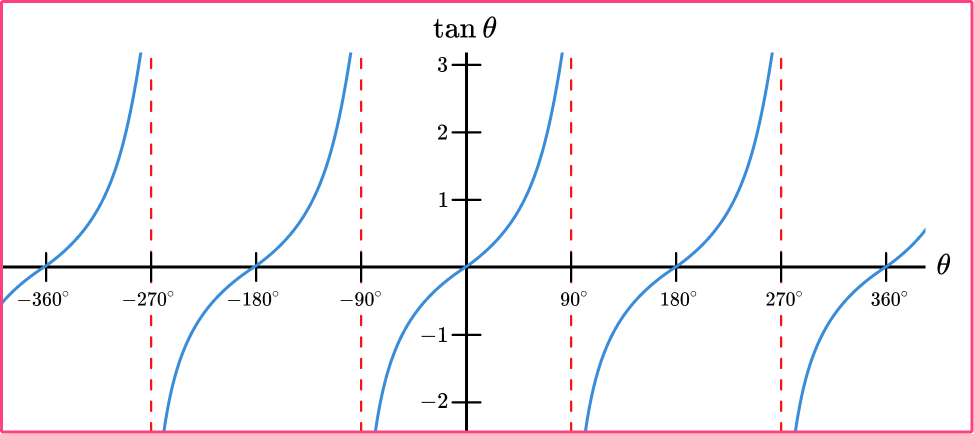
- The graph repeats every 180^{\circ} (it is periodic).
- The graph is not a continuous curve (also known as disjointed).
- Vertical asymptotes occur at 90^{\circ}\pm{180}^{\circ}.
An asymptote is a line that a curve gets closer and closer towards but never touches as the curve goes towards infinity. You may have seen asymptotes when looking at the graph of y=\frac{1}{x}. The values of \tan \theta for any of these values of \theta is therefore undefined as they would all be the result of dividing by 0, which we cannot do.
Here you can see the curve getting closer and closer to the asymptotes as \tan \theta approaches infinity.
Step-by-step guide: Tan graph
Interpreting sin cos tan graphs
We can use the sin, cos and tan graphs to determine values for \theta and \sin \theta, \cos \theta and \tan \theta.
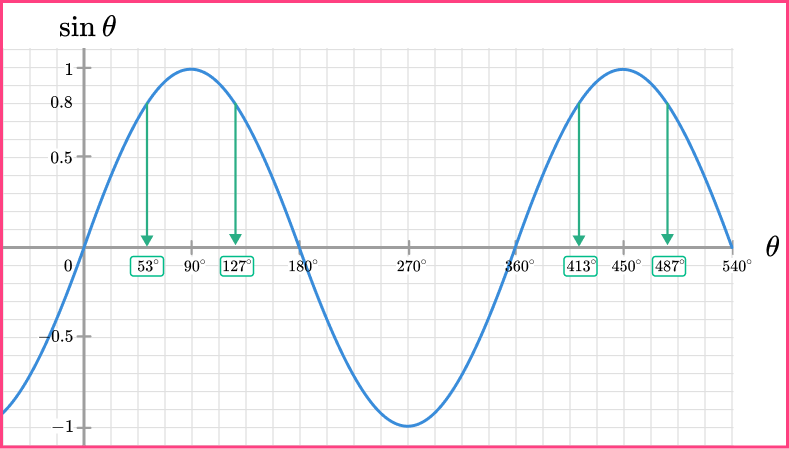
For example, let’s look at the graph of y=\sin\theta, if \sin \theta=0.8, we can draw a horizontal line across from 0.8 on the vertical axis to the graph and then down to the horizontal axis and read off the value.
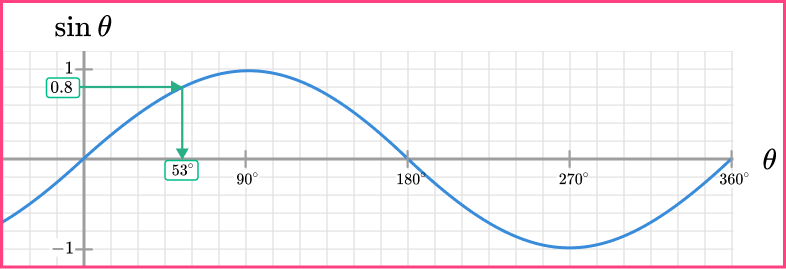
So when \sin \theta=0.8, we can see that \theta=53^{\circ}.
But this is not the only solution. If we extended the horizontal line from 0.8 further, we also get the same value of \sin \theta=0.8 when \theta=127^{\circ}.
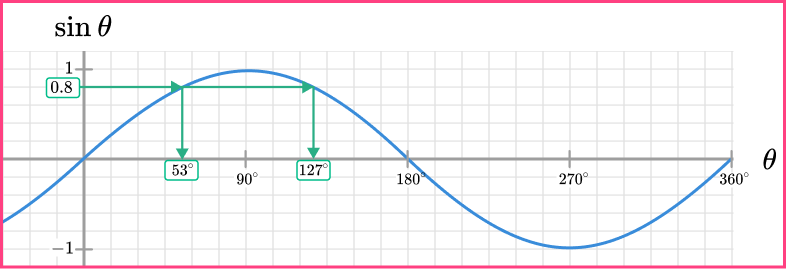
As the function is periodic over 360^{\circ}, if we added 360 to each angle, we would also have \theta=53+360=413^{\circ} and \theta=127+360=487^{\circ}. This can also occur for values of \theta in the negative direction.
Continuing with this lesson, we are going to focus on sketching and labelling key parts of trigonometric graphs.
See also: Trig graphs
How to sketch sin cos tan graphs
In order to sketch sin cos and tan graphs:
- Draw the axes for the required range of \textbf{θ}.
- Mark key features of the trig function onto the graph.
- Sketch the graph.
Explain how to sketch sin cos tan graphs
Sin cos tan graphs examples
Example 1: sketch y = sin θ
Using the axes below, sketch the graph of y=\sin\theta for 0\leq\theta\leq{360}^{\circ}.
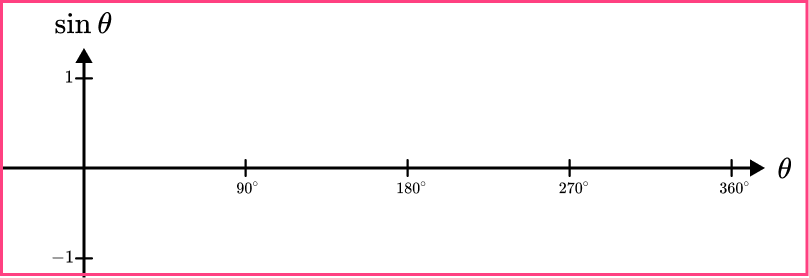
- Draw the axes for the required range of \textbf{θ}.
Here we are given the axes for the range 0\leq\theta\leq{360}^{\circ} and so we can move on to the next step, remembering that we still need to label the vertical axes tick marks.
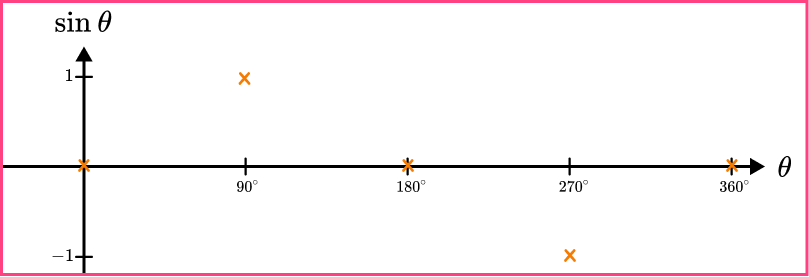
2Mark key features of the trig function onto the graph.
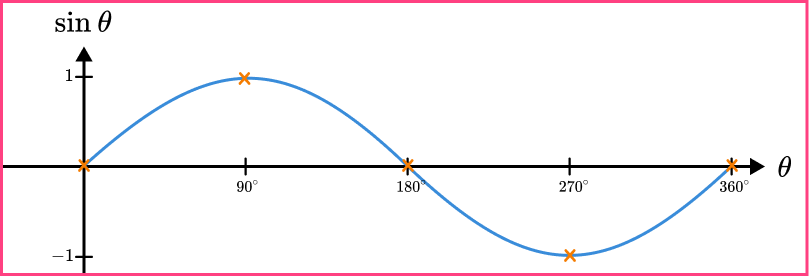
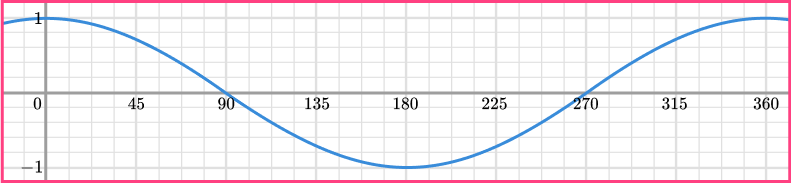
The graph of y=\sin \theta passes through the origin and crosses the horizontal axis every 180 degrees. It has a maximum value at 1 when \theta=90^{\circ} and a minimum value at -1 when \theta=270^{\circ}.
Marking these points onto the graph and labelling the vertical axis with the values of 1 and -1, we have
3Sketch the graph.
Joining the points together using a smooth curve, we get the sketch of the graph y=\sin\theta for 0\leq\theta\leq{360}^{\circ} to be,
Example 2: sketch y = cos θ
Using the axes below, sketch the graph of y=\cos\theta for 0\leq\theta\leq{360}^{\circ}.
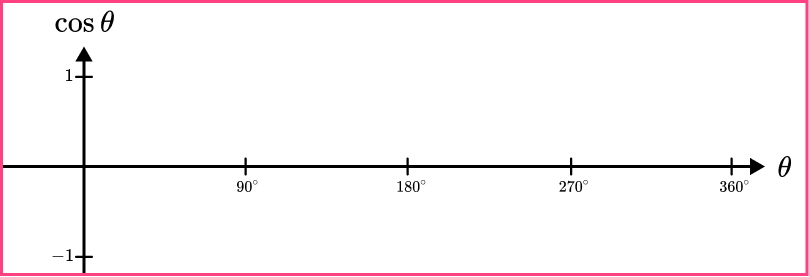
Here we are given the axes for the range -1\leq \cos \theta\leq 1 and so we can move on to the next step, remembering that we will need to label the horizontal axes tick marks.
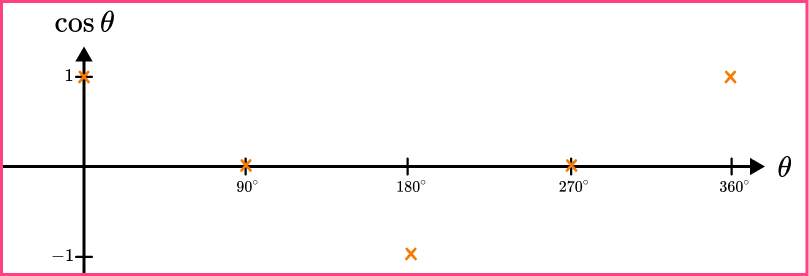
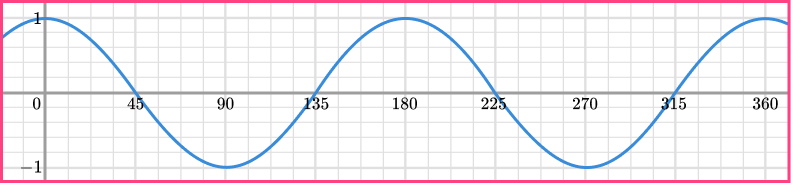
The graph of y=\cos \theta passes through the point (0,1) and crosses the horizontal axis at 90^{\circ} and again for every 180 degrees. It has a maximum value at 1 when \theta=0^{\circ} and a minimum value at -1 when \theta=180^{\circ}.
Marking these points onto the graph and labelling the horizontal axis with the values of 0, 90, 180, 270, and 360, we have,
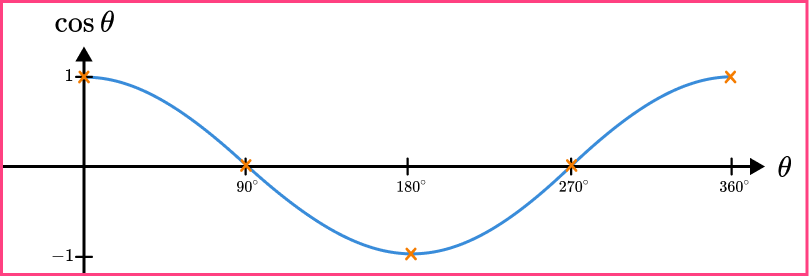
Joining the points together using a smooth curve, we get the sketch of the graph y=\cos \theta for 0\leq \theta \leq{360}^{\circ} to be,
Example 3: sketch y = tan θ
Using the axes below, sketch the graph of y=\tan \theta for 0\leq\theta\leq{360}^{\circ}.
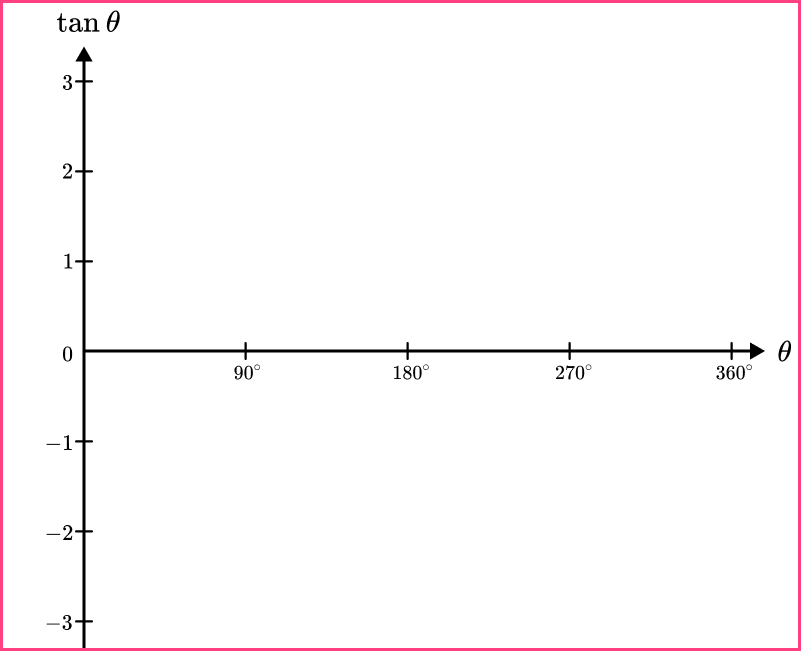
Here we are given the axes for the range 0\leq\theta\leq{360}^{\circ} with tick marks labelled on each axis so we can move on to the next step.
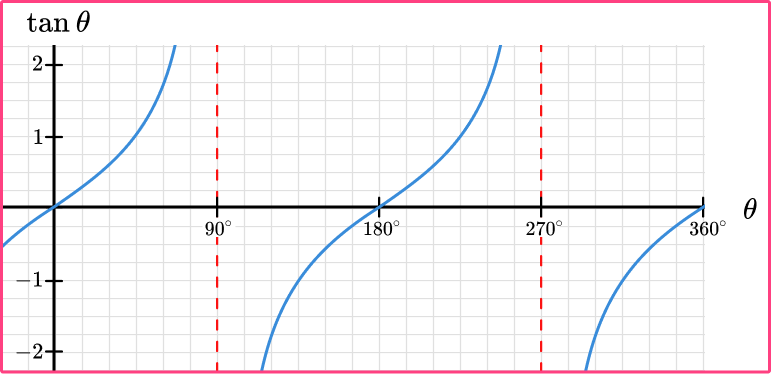
The graph of y=\tan \theta passes through the origin and crosses the horizontal axis every 180 degrees. It has an asymptote at \theta=90^{\circ} which occurs every 180 degrees and the graph does not have a maximum or minimum value (it extends up and down towards the asymptote).
Marking these points onto the graph, we have,
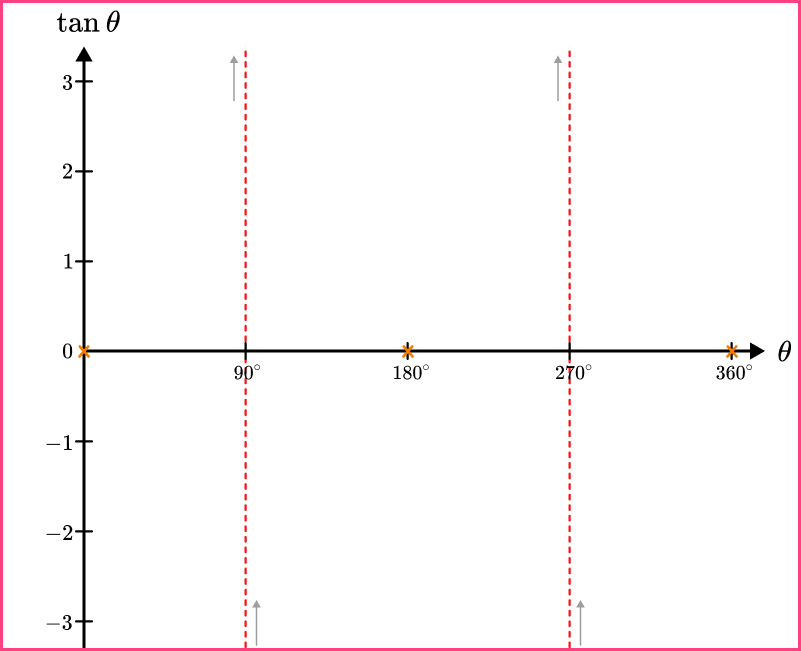
Note that the arrows are indicating the direction of the graph either side of the asymptotes and do not feature in the final sketch.
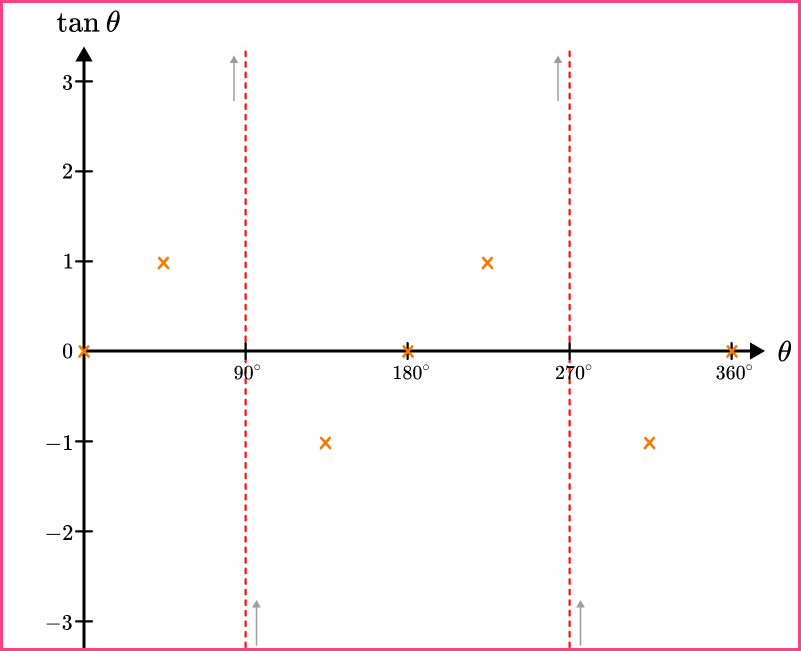
We can also use the trigonometric identity that \tan45=1. So, other useful points to add on are (45,1),(135,-1),(225,1) and (315,-1).
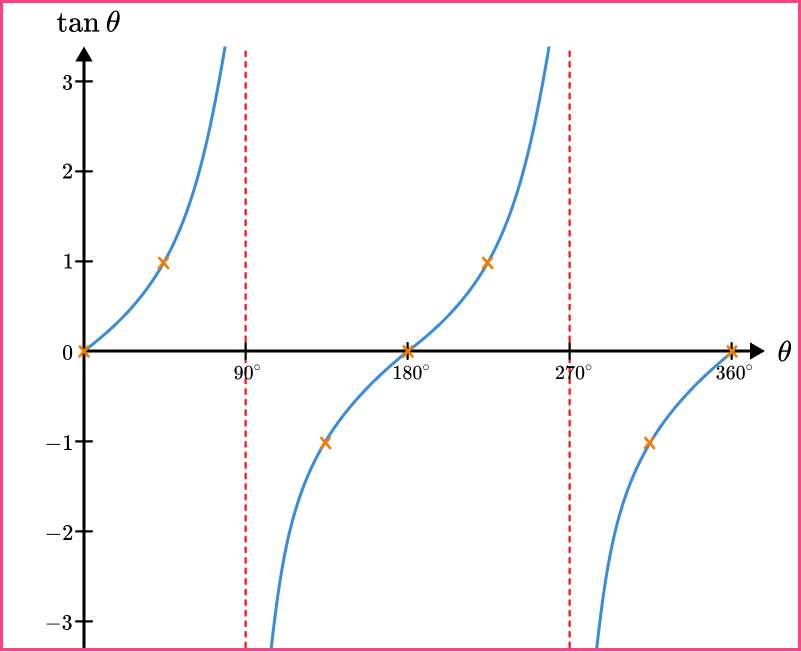
Joining the points together using a smooth curve between each pair of asymptotes, we get the sketch of the graph y=\tan \theta for 0\leq\theta\leq{360}^{\circ} to be,
Example 4: sketch y = cos θ for a different range of θ
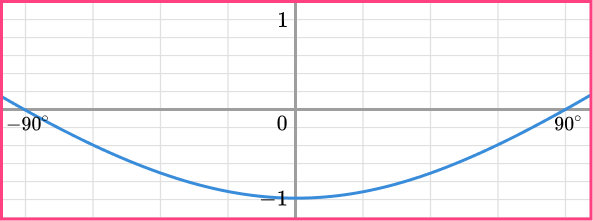
Using the axes below, sketch the graph of y=\cos\theta for 90\leq\theta\leq{270}^{\circ}.
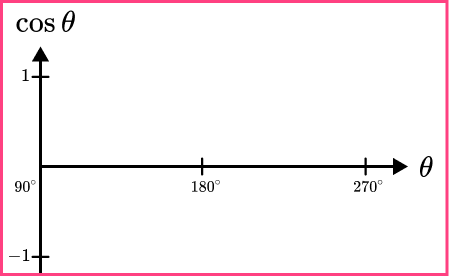
Here we are given the axes for the range 90\leq\theta\leq{270}^{\circ} and so we can move on to the next step, remembering that we will need to label the vertical axes tick marks.
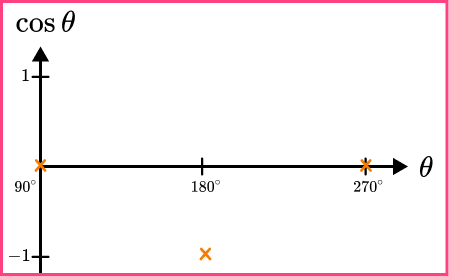
The graph of y=\cos \theta crosses the horizontal axis at 90^{\circ} and again for every 180 degrees. It has a minimum value at -1 when \theta=180^{\circ}.
Marking these points onto the graph and labelling the vertical axis with 1 and -1, we have,
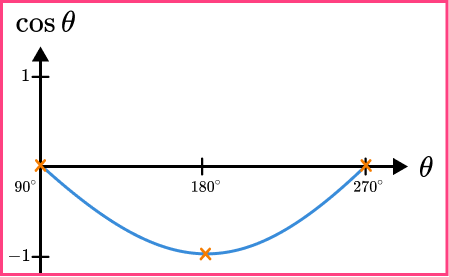
Joining the points together using a smooth curve, we get the sketch of the graph y=\cos \theta for 90\leq\theta\leq{270}^{\circ} to be,
Example 5: sketch y = sin θ for a different range of θ
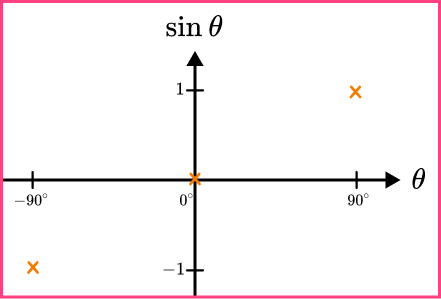
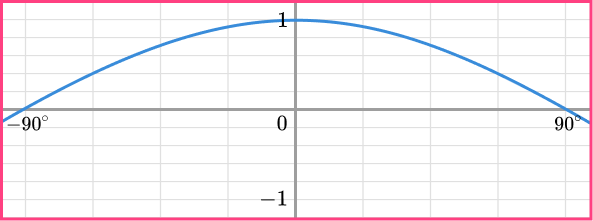
Using the axes below, sketch the graph of y=\sin\theta for -90\leq\theta\leq{90}^{\circ}.
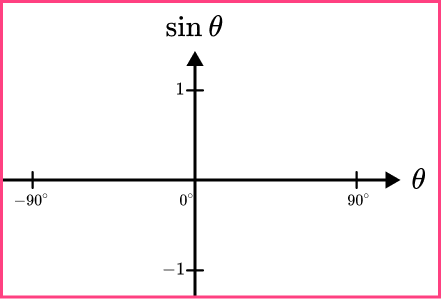
Here we are given the axes for the range -90\leq\theta\leq{90}^{\circ} and so we can move on to the next step, remembering that we still need to label the vertical axes tick marks.
The graph of y=\sin \theta passes through the origin. It has a maximum value at 1 when \theta=90^{\circ} and a minimum value at -1 when \theta=270^{\circ}. As the function is periodic over 360 degrees, we can subtract 360 from 270 to obtain the value of -90^{\circ}. Here, \sin(-90)=-1.
Marking these points onto the graph and labelling the vertical axis with the values of 1 and -1, we have,
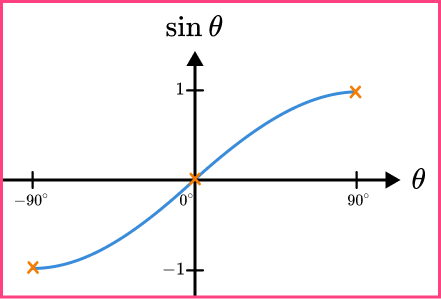
Joining the points together using a smooth curve, we get the sketch of the graph y=\sin \theta for -90\leq\theta\leq{90}^{\circ} to be,
Example 6: sketch y = tan θ for a different range of θ
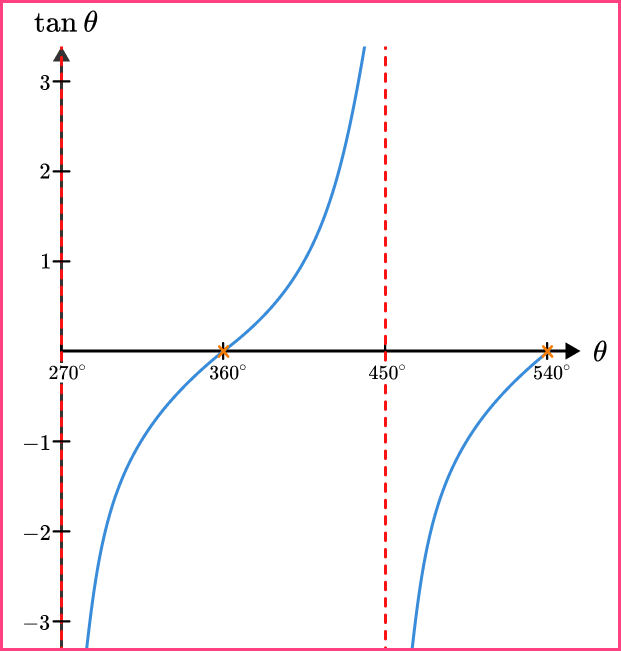
Using the axes below, sketch the graph of y=\tan\theta for 270\leq\theta\leq{540}^{\circ}.
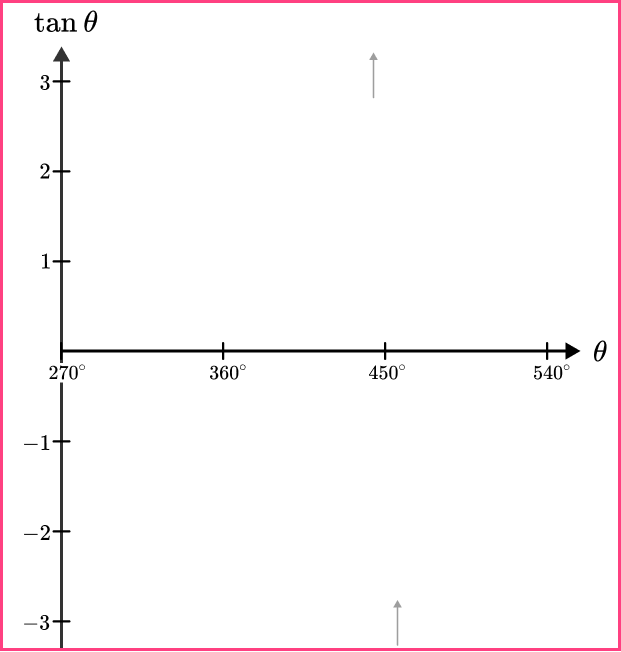
Here we are given the axes for the range 270\leq\theta\leq{540}^{\circ} with tick marks labelled on each axis so we can move on to the next step.
The graph of y=\tan \theta passes through the origin and crosses the horizontal axis every 180 degrees. As an asymptote would feature at \theta=90^{\circ} and they occur every 180 degrees, we need to add 180 to 90 to get the location of the next asymptote at \theta=270^{\circ}.
The next asymptote would then occur at \theta=270+180=450^{\circ}. The graph does not have a maximum or minimum value (it extends up and down towards the asymptote).
Marking these points onto the graph, we have,
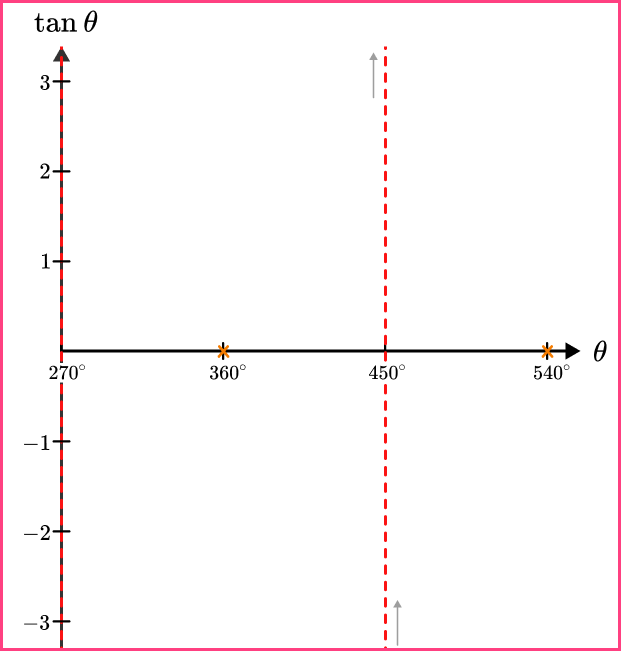
Note that the arrows are indicating the direction of the graph either side of the asymptotes and do not feature in the final sketch.
Joining the points together using a smooth curve between each pair of asymptotes, we get the sketch of the graph y=\tan \theta for 270\leq\theta\leq{540}^{\circ} to be,
Common misconceptions
- Sine and cosine graphs switched
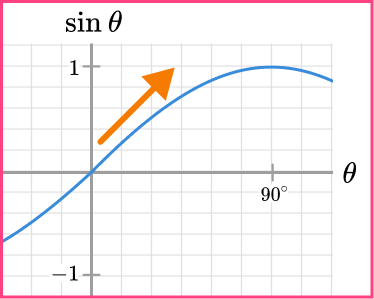
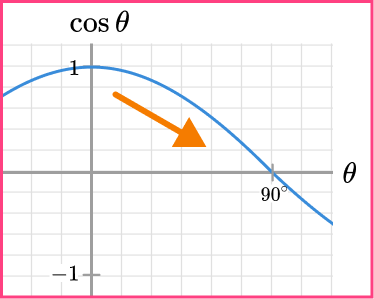
The sine and cosine graphs are very similar and can easily be confused with one another. A tip to remember is that you “sine up” from 0 for the sine graph so the line is increasing whereas you “cosine down” from 1 so the line is decreasing for the cosine graph.
- Asymptotes are drawn incorrectly for the graph of the tangent function
The tangent function has an asymptote at 90^{\circ} because this value is undefined. As the curve repeats every 180^{\circ}, the next asymptote is at 270^{\circ} and so on.
- The graphs are sketched using a ruler
Each trigonometric graph is a curve and therefore the only time you are required to use a ruler is to draw a set of axes. Practice sketching each curve freehand and label important values on each axis.
- Value given out of range
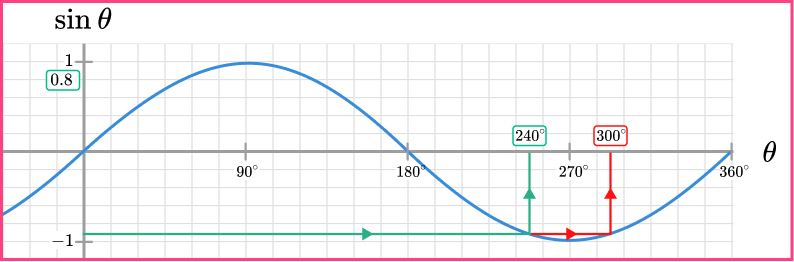
When finding a value of \theta using a trigonometric graph, you must make sure that the value of \theta is within the range specified in the question.
For example, the range of values for \theta is given as 0^{\circ}\leq\theta\leq{360}^{\circ} and only the value of \theta=240^{\circ} is written for the solution, whereas the solution \theta=300^{\circ} is also correct.
Practice sin cos tan graphs questions
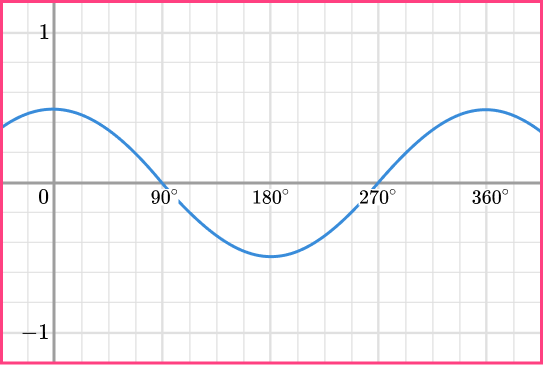
1. Which is the correct sketch of the graph y=\sin \theta for 0\leq\theta\leq{360}^{\circ}?
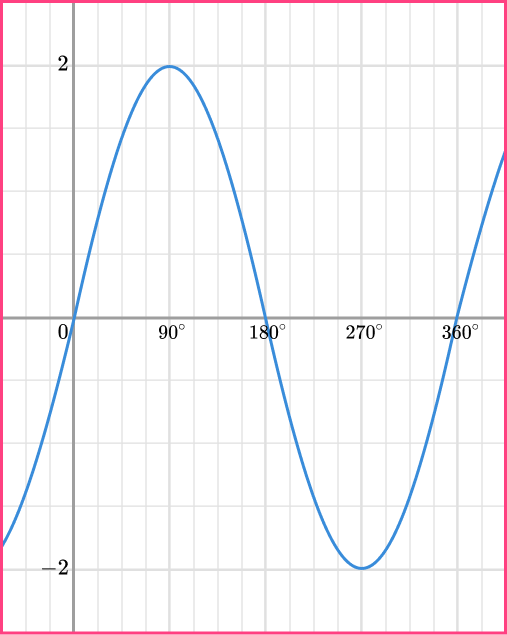

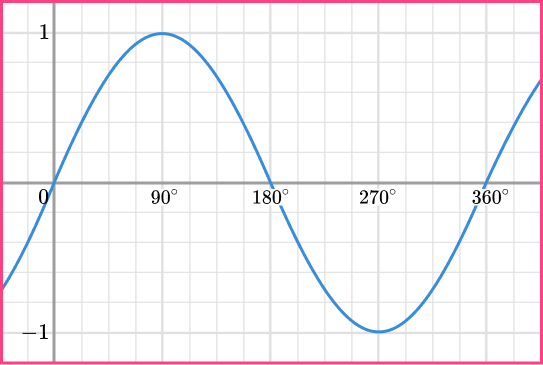

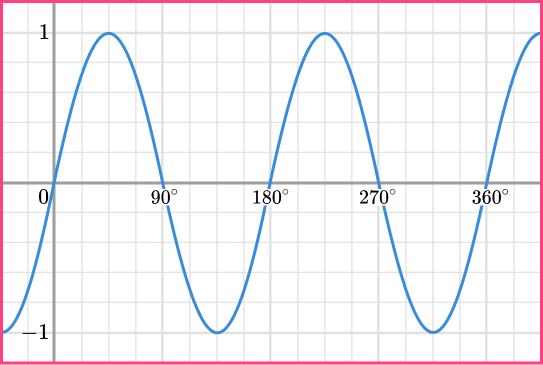
The sine graph y=\sin \theta passes through the origin and crosses the horizontal axis every 180 degrees. It has a maximum value at 1 when \theta=90^{\circ} and a minimum value at -1 when \theta=270^{\circ}.
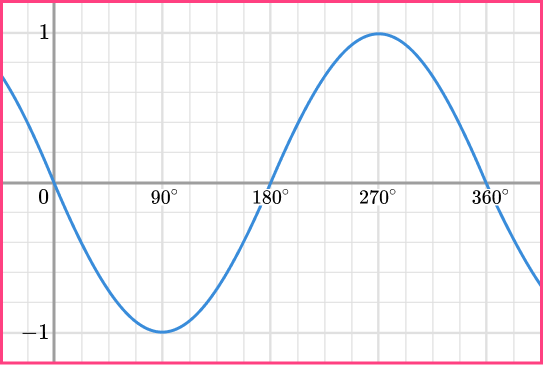
2. Which is the correct sketch of the graph y=\cos \theta for 0\leq\theta\leq{360}^{\circ}?
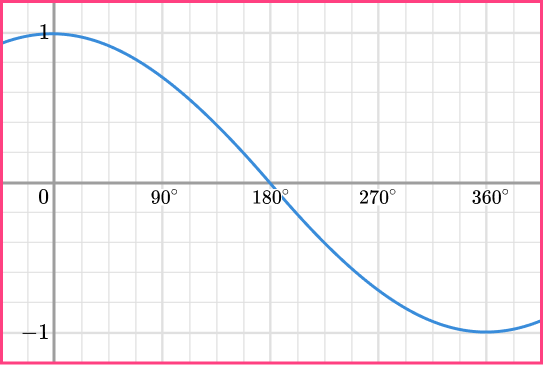
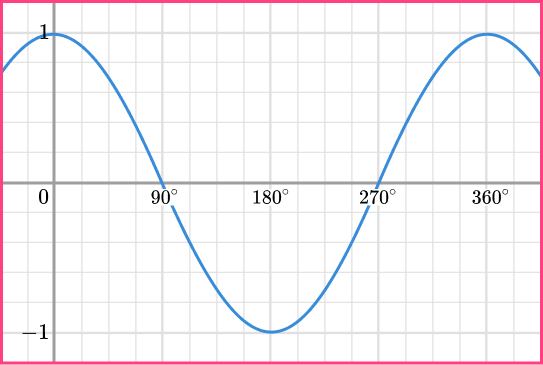
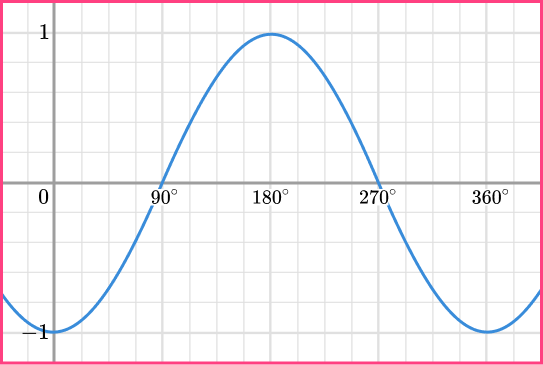
The cosine graph y=\cos \theta passes through the point (0,1) and crosses the horizontal axis at 90^{\circ} and again for every 180 degrees. It has a maximum value at 1 when \theta=0^{\circ} and a minimum value at -1 when \theta=180^{\circ}.
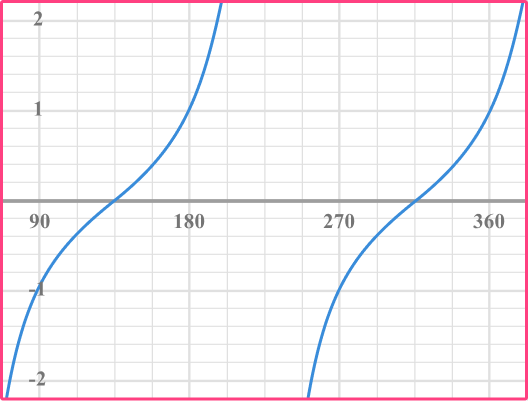
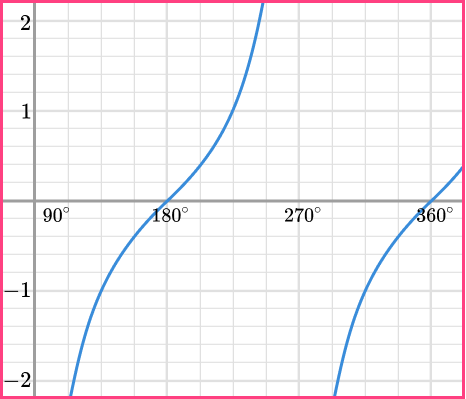
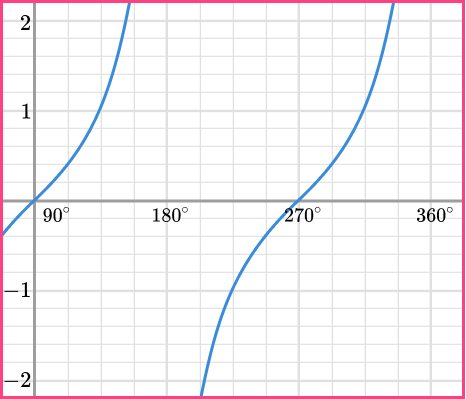
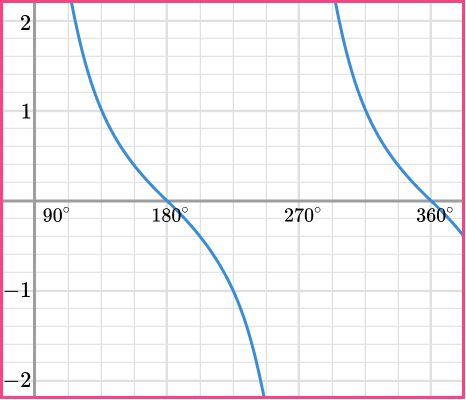
3. Which is the correct sketch of the graph y=\tan \theta for 0\leq\theta\leq{360}^{\circ}?
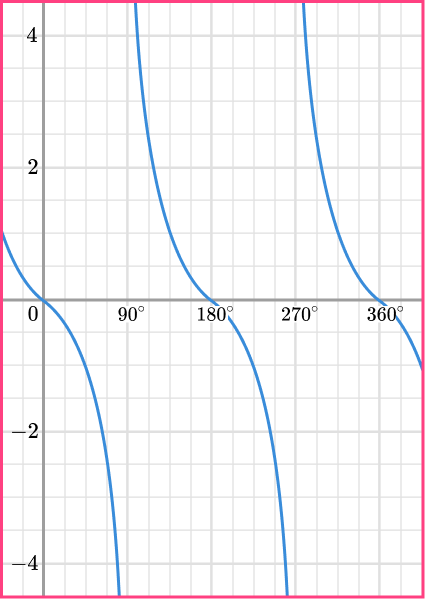
The tangent graph y=\tan \theta passes through the origin and crosses the horizontal axis every 180 degrees. It has an asymptote at \theta=90^{\circ} which occurs every 180 degrees and the graph does not have a maximum or minimum value (it extends up and down towards the asymptote).
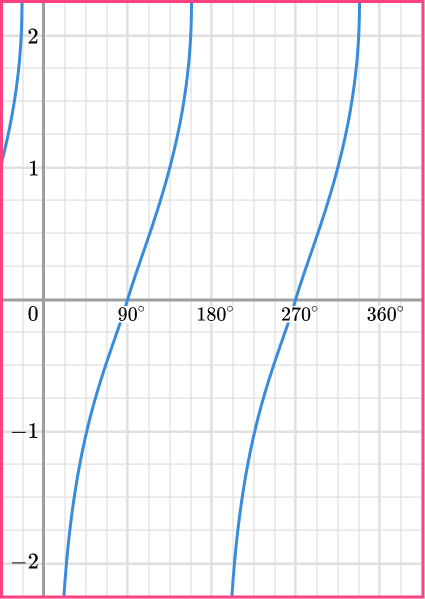
4. Which is the correct sketch of the graph y=\tan \theta for 90\leq\theta\leq{270}^{\circ}?
The graph of y=\tan \theta between the range of 90\leq\theta\leq{270}^{\circ} passes through the horizontal axis at 180^{\circ}. It has asymptotes at \theta=90^{\circ} and \theta=270^{\circ}. The graph does not have a maximum or minimum value and extends towards the asymptote in both directions (up and down).
5. Which is the correct sketch of the graph y=\cos \theta for -90\leq\theta\leq{90}^{\circ}?
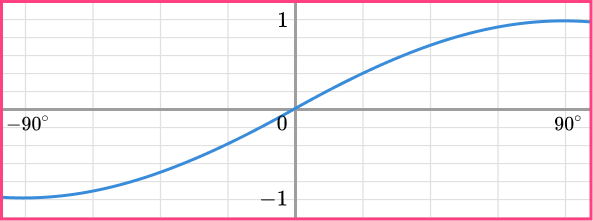
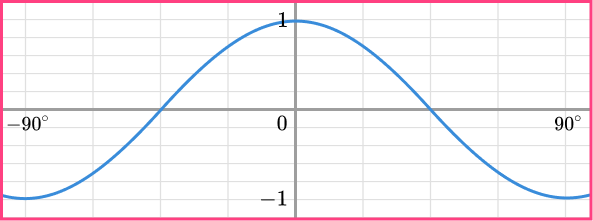
The graph of y=\cos \theta passes through the point (0,1) and crosses the horizontal axis at 90^{\circ} and again for every 180 degrees. This means that it also crosses the horizontal axis at -90^{\circ}. It has a maximum value at 1 when \theta=0^{\circ}.
6. Which is the correct sketch of the graph y=\sin \theta for 360\leq\theta\leq{720}^{\circ}?
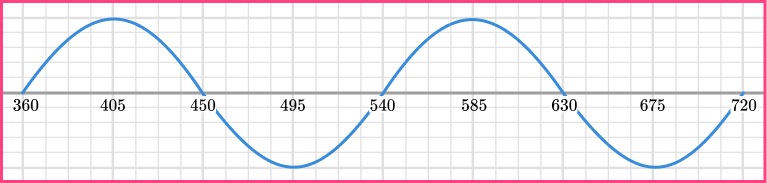
The graph of y=\sin \theta passes through the origin and crosses the horizontal axis every 180 degrees. It has a maximum value at 1 when \theta=90^{\circ} and a minimum value at -1 when \theta=270^{\circ}.
This means that it repeats itself exactly every 360^{\circ} and so if we add 360 to every value of \theta, we get the points (360,0),(450,1),(540,0),(630,-1), and (720,0).
Sin cos tan graphs GCSE questions
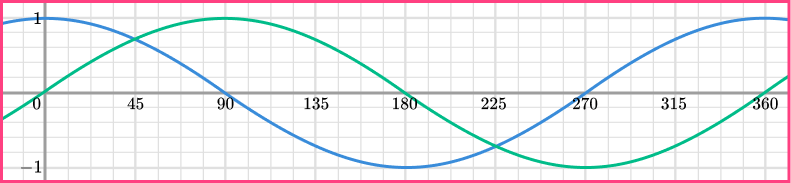
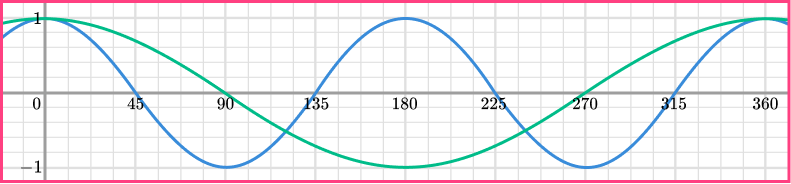
1. (a) Below is the graph of y=\cos \theta for 0\leq\theta\leq{360}^{\circ}. On the same axes below, sketch the graph of y=\sin\theta.
(b) What values of \theta satisfy the equation \sin \theta=\cos \theta for 0\leq\theta\leq{360}^{\circ}?
(4 marks)
(a)
Passes through all five points
(0,0),(90,1),(180,0), (270,-1),(360,0)(1)
Smooth curve
(1)
Correct sketch:
(b)
\theta=45^{\circ}
(1)
\theta=225^{\circ}(1)
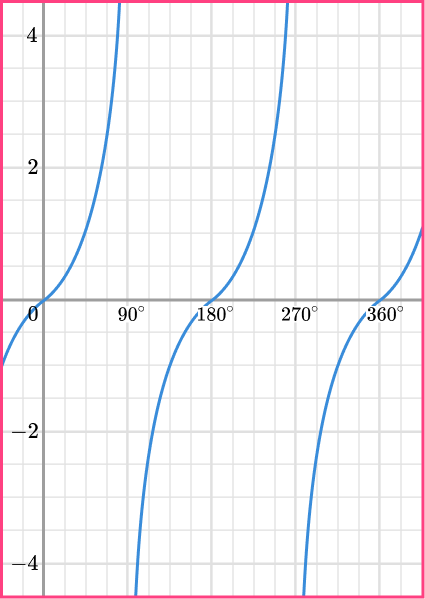
2. (a) Below is the graph of y=\tan \theta for 0\leq\theta\leq{360}^{\circ}. Use the graph to estimate the value of \tan{225}.
(b) What other value of \theta between the range of 0\leq\theta\leq{360}^{\circ} also has the same value as \tan{225}
(2 marks)Sin-cos-tan-graphs-examples
(a) \tan{225}=1
(1)
(b) \theta=45^{\circ}
(1)
3. (a) Below is the graph of y=\cos{(2\theta)} for 0\leq\theta\leq{360}^{\circ}. On the same set of axes, sketch the graph of y=\cos \theta.
(b) Use the graph to approximate the value of \theta when \cos\theta=\cos{2\theta} for -180\leq\theta\leq{-90}^{\circ}
(4 marks)
(a)
Passes through all five points
(0,1),(90,0),(180,-1),(270,0),(360,1)(1)
Smooth curve
(1)
Correct sketch:
(b)
Their value of \theta=[112-118]^{\circ}
(1)
The negative of their value of \theta=-[112-118]^{\circ}
(1)
Learning checklist
You have now learned how to:
The next lessons are
Still stuck?
Prepare your KS4 students for maths GCSEs success with Third Space Learning. Weekly online one to one GCSE maths revision lessons delivered by expert maths tutors.

Find out more about our GCSE maths tuition programme.