GCSE Tutoring Programme
Our chosen students improved 1.19 of a grade on average - 0.45 more than those who didn't have the tutoring.
In order to access this I need to be confident with:
SOHCAHTOA Straight line graphs Functions in algebra Linear graph Quadratic graphs Reciprocal graph Cubic graph Fractions, decimals and percentages Rearranging equations Solving equations Exact trig valuesThis topic is relevant for:

Trig Graphs
Here we will learn about trig graphs, including what each type of trigonometric graph looks like for a range of angles, labelling key features on each graph, and interpreting the graphs of the trig functions y=\sin{x}, \; y=\cos{x} and y=\tan{x}.
You can also download the following free trig graphs resources all suitable for those following Edexcel, AQA or OCR exam boards:
What are trig graphs?
Trig graphs are the graphs of the trigonometric functions.
At GCSE we need to be able to sketch the graphs of the trigonometric functions of sine (y=\sin{\theta}), cosine (y=\cos{\theta}), and tangent (y=\tan{\theta}), and then use these graphs to find unknown values.
What are trig graphs?
The unit circle
We can use the unit circle to help understand where the values for each of the trigonometric ratios come from any angle.
Here is the unit circle (a circle with the radius of 1 ) with the centre at (0,0).
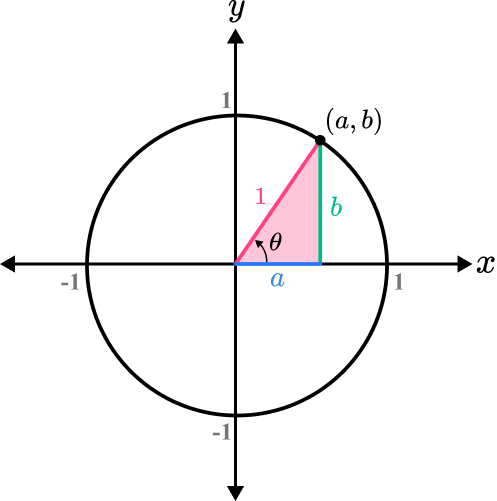
Using the three trigonometric ratios involved with SOH CAH TOA, we can label the point on the circumference of the unit circle as (\cos{\theta}, \sin{\theta}) :
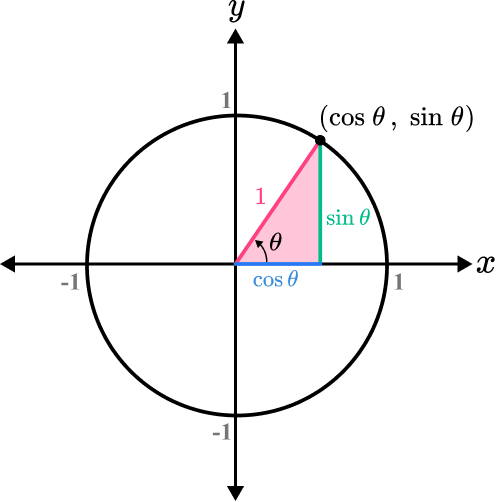
As the value of \theta increases, the point on the circumference moves between the four quadrants and after a full turn of 360^{\circ}, the point returns back to the coordinate (1,0).
Furthermore, as the coordinate is the respective width and height of a right-angled triangle, we can state the value of \theta and determine what the value of \sin{\theta}, \cos{\theta} or \tan{\theta} is.
As \tan{\theta}=\frac{\text{opposite}}{\text{adjacent}}, we can work out the value of \tan{\theta} as \frac{\text{opposite}}{\text{adjacent}}=\frac{\sin{\theta}}{\cos{\theta}} and so \tan{\theta}=\frac{\sin{\theta}}{\cos{\theta}}.
Step-by-step guide: Sin cos tan

Trigonometry worksheet
Get your free trigonometry worksheet of 20+ questions and answers. Includes reasoning and applied questions.
DOWNLOAD FREE Trigonometry worksheet
Get your free trigonometry worksheet of 20+ questions and answers. Includes reasoning and applied questions.
DOWNLOAD FREEGraph of sin θ
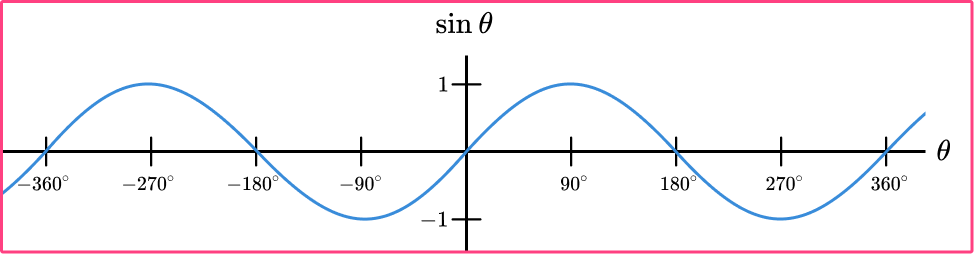
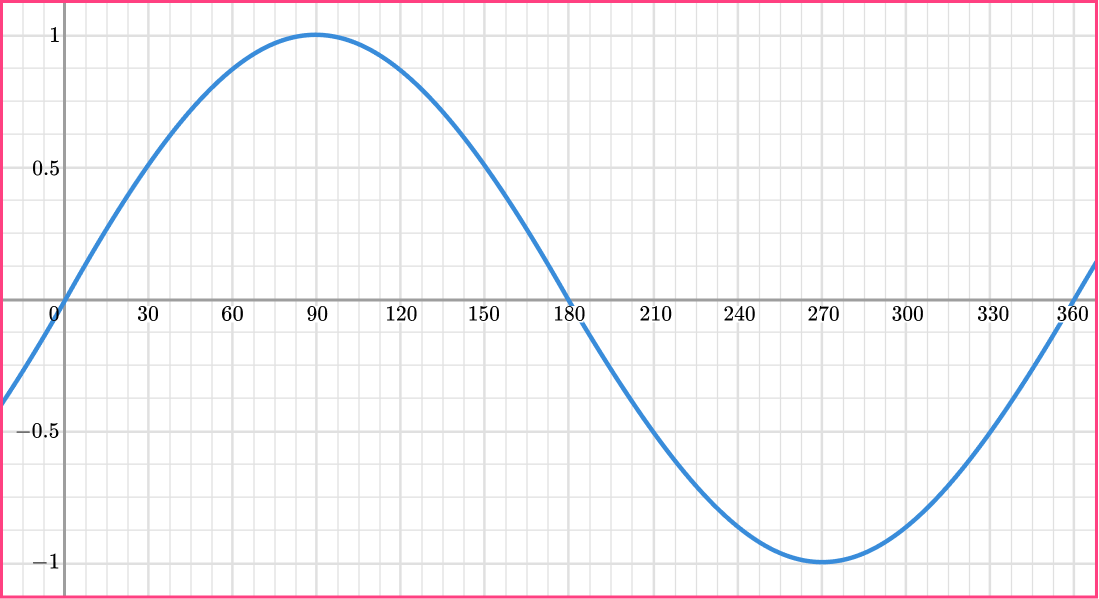
Using the unit circle we can obtain the graph of y=\sin{\theta} for any value of \theta.
We need to know the graph of y=\sin{\theta} for the range -360\leq\theta\leq{360}^{\circ}.
The horizontal x axis of a trigonometric graph represents the angle, usually written as \theta, and the y -axis is the sine function of that angle.
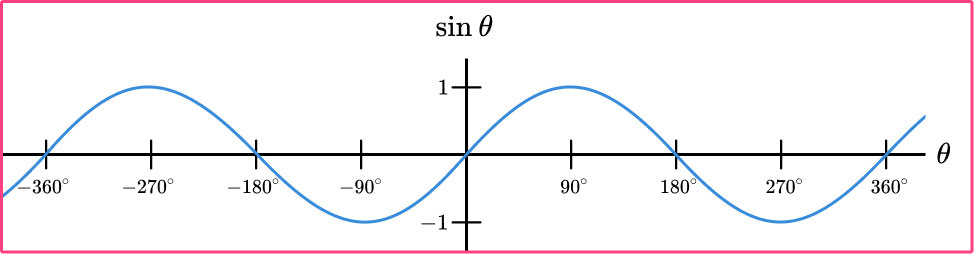
- The graph does not start at the origin but it does pass through it.
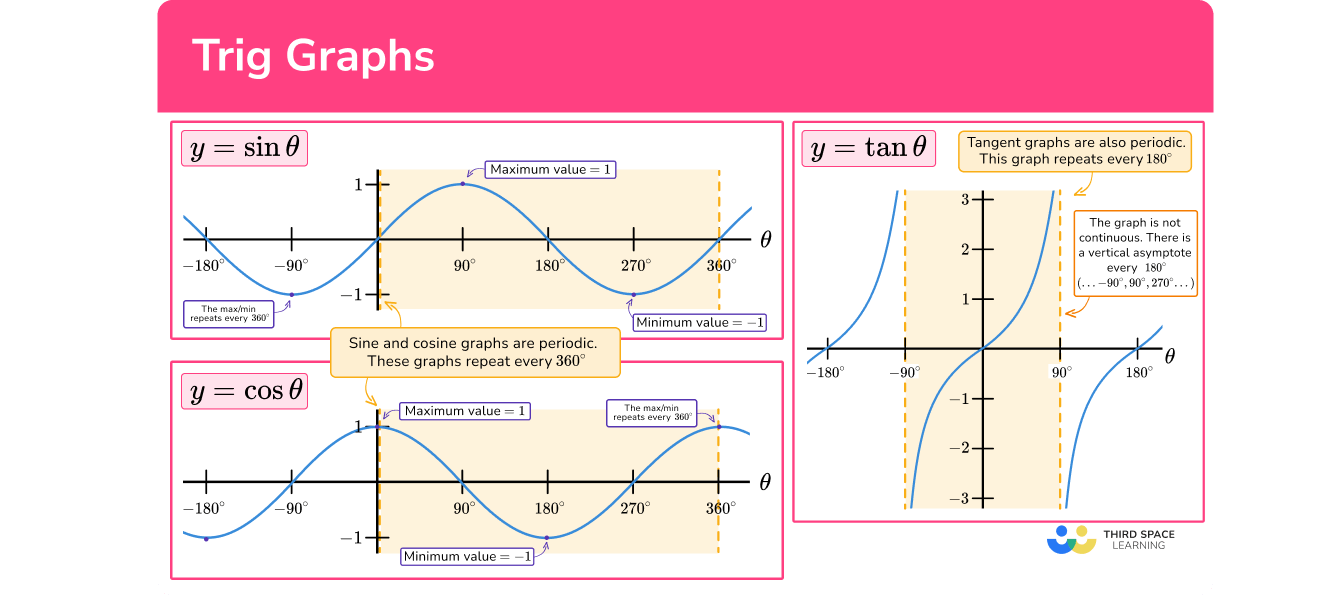
- The graph is continuous and repeats every 360^{\circ} (the graph is periodic).
- The maximum value of \sin{\theta} is 1.
- The minimum value of \sin{\theta} is -1.
Interpreting sin graphs
We can use the sin graph to work out \theta.
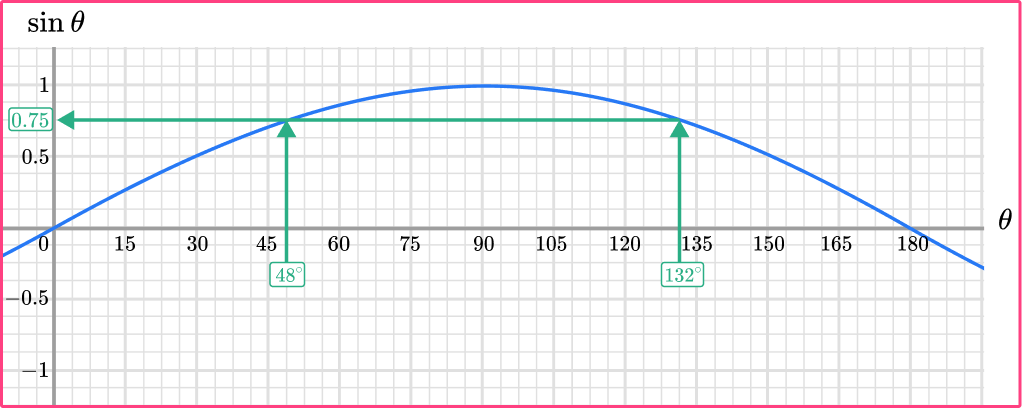
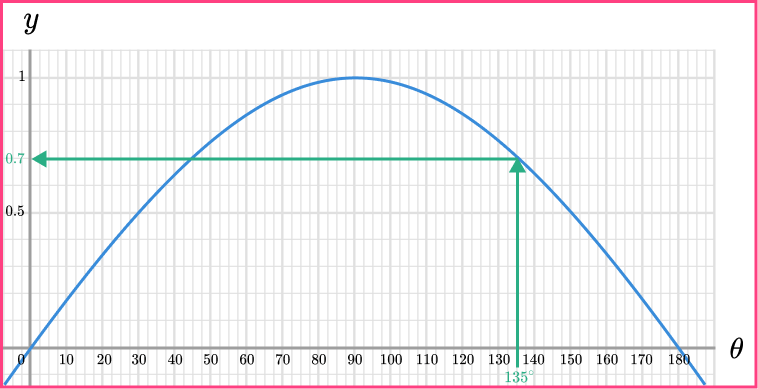
For example, let’s look at the graph of y=\sin{\theta} for 0\leq\theta\leq{180}^{\circ}. If \sin\theta=0.75, we can draw a horizontal line across from 0.75 on the vertical axis to the graph and then down to the horizontal axis and read off the value.
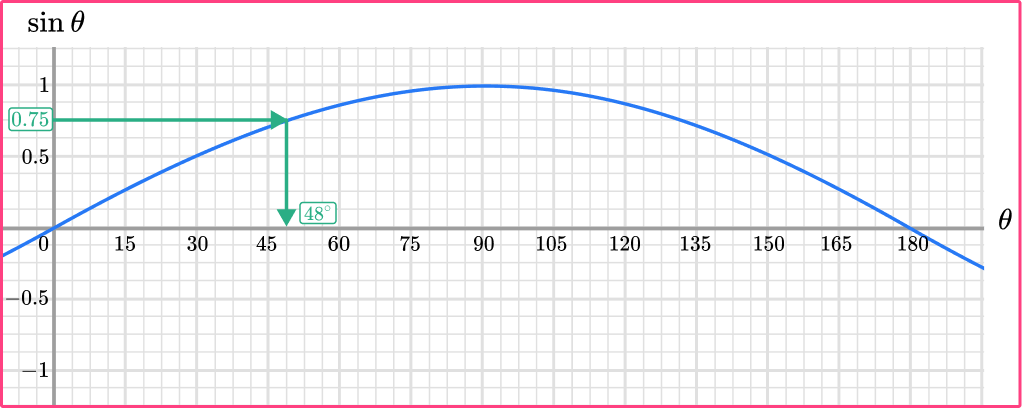
So when \sin{\theta}=0.75, we can see that \theta\approx{48}^{\circ}.
Note that this is exactly the same as \sin^{-1}(0.75)\approx{48}^{\circ}.
But this is not the only solution. If we extended the horizontal line from 0.75 further, we also get the same value of \sin{\theta} \approx 0.75 when \theta=132^{\circ}.

Notice that 180^{\circ}-48^{\circ}=132^{\circ}. In fact for any angle 0\leq\theta\leq{90}^{\circ}, if we calculate \sin\theta we will get the same value as \sin(180-\theta).
We can also inverse this method to show that \sin{48} \approx 0.75. To do this, we change the direction of the arrows, so we start from 48 on the horizontal axis, move vertically towards the graph, then read off the value on the vertical axis.
As the function is periodic over 360^{\circ}, if we added 360 to each angle, we would also have \theta=48+360=408^{\circ} and \theta=132+360=492^{\circ}. This can also occur for values of \theta in the negative direction.
Step-by-step guide: Sin graph
Graph of cos θ
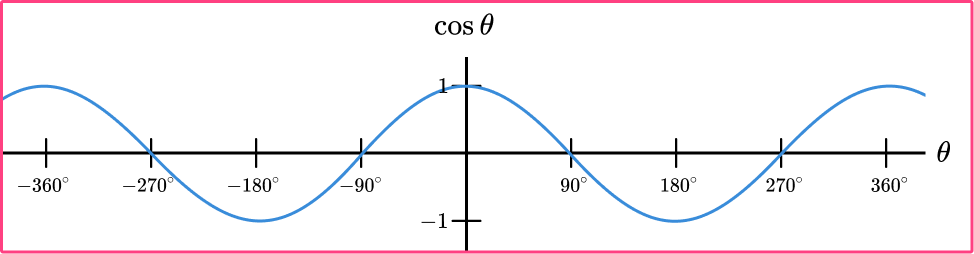
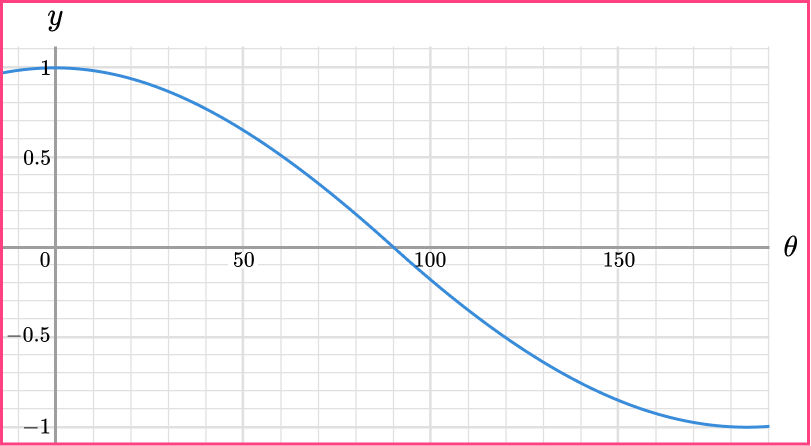
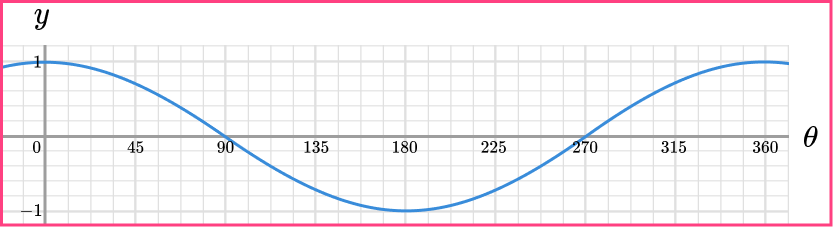
Using the unit circle we can obtain the graph of y=\cos{\theta} for any value of \theta. We need to know the graph of y=\cos{\theta} for the range -360\leq\theta\leq{360}^{\circ}.
The horizontal axis of a trigonometric graph represents the angle, usually written as \theta, and the y -axis is the cosine function of that angle.
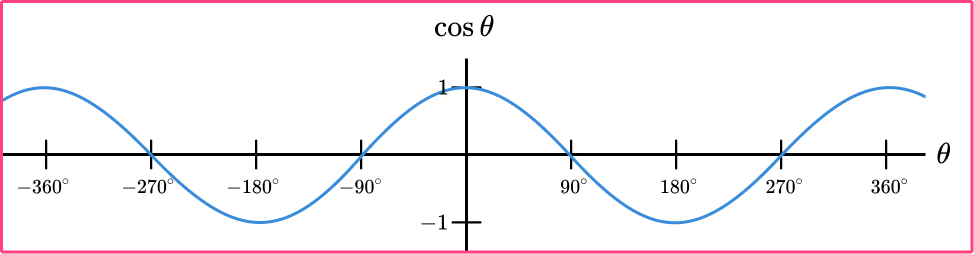
- The graph does not pass through the origin unlike the graphs for \sin{\theta} and \tan{\theta}.
- The graph is continuous and repeats every 360^{\circ} (the graph is periodic).
- The maximum value of \cos{\theta} is 1
- The minimum value of \cos{\theta} is -1.
- The graph is symmetrical about the vertical axis.
Interpreting cos graphs
We can use the cos graph to work out \theta.
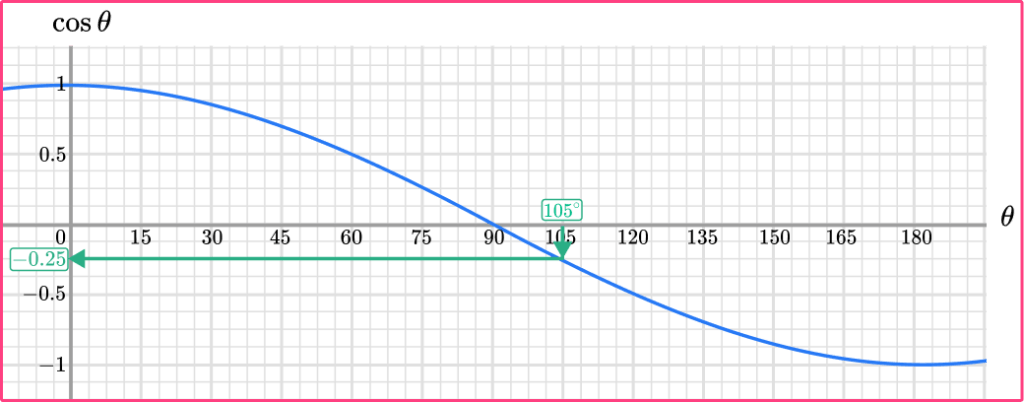
For example, let’s look at the graph of y=\cos\theta for 0\leq\theta\leq{180}^{\circ}. If \cos\theta=-0.25, we can draw a horizontal line across from -0.25 on the vertical axis to the graph and then up to the horizontal axis and read off the value.
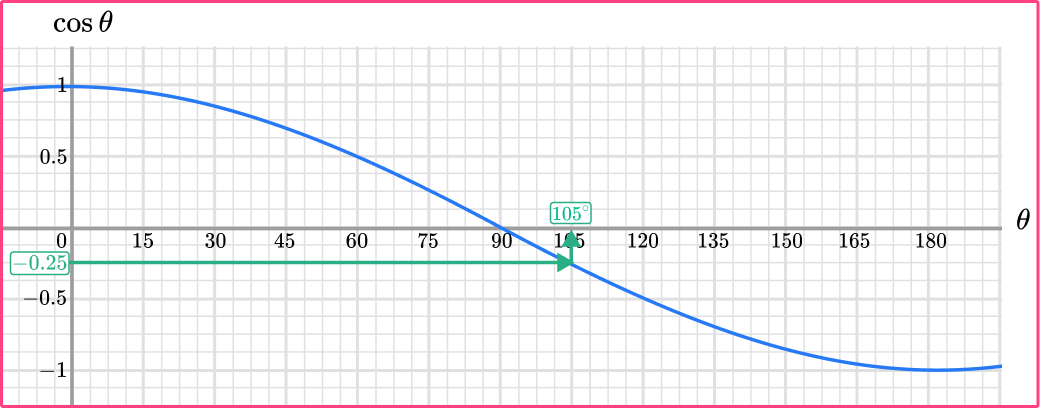
So when \cos\theta=-0.25, we can see that \theta\approx{105}^{\circ}.
Note that this is exactly the same as \cos^{-1}(-0.25)\approx{105}^{\circ}.
Again, this is not the only solution however as we are only looking at the range of values between 0 and 180 degrees, another value for \cos\theta=-0.25 does not occur in this range. If we extended the horizontal line from -0.25 further, we also get the same value of \cos\theta=-0.25 when \theta=255^{\circ}.
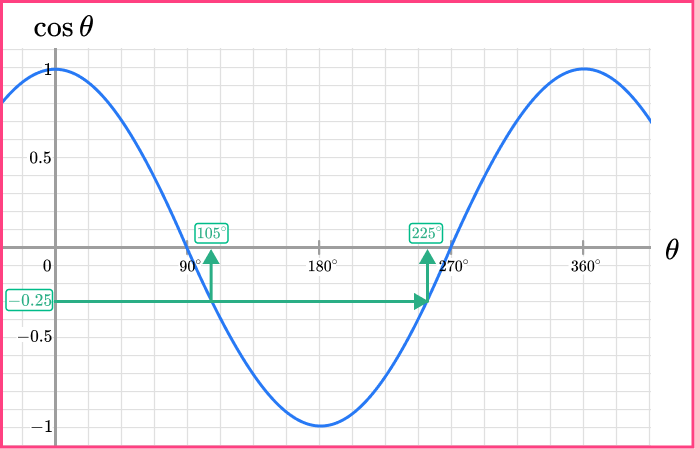
Notice again that 360^{\circ}-105^{\circ}=255^{\circ}. In fact for any angle 0\leq\theta\leq{180}^{\circ}, if we calculate \cos\theta we will get the same value as \cos(360-\theta).
We can also inverse this method to show that \cos(105)\approx{-0.25}. To do this, we change the direction of the arrows, so we start from 105 on the horizontal axis, move vertically towards the graph, then read off the value on the vertical axis.
As the function is periodic over 360^{\circ}, if we added 360 to each angle, we would also have \theta=105+360=465^{\circ} and \theta=255+360=615^{\circ}. This can also occur for values of \theta in the negative direction.
Step-by-step guide: Cos graph
Graph of tan θ
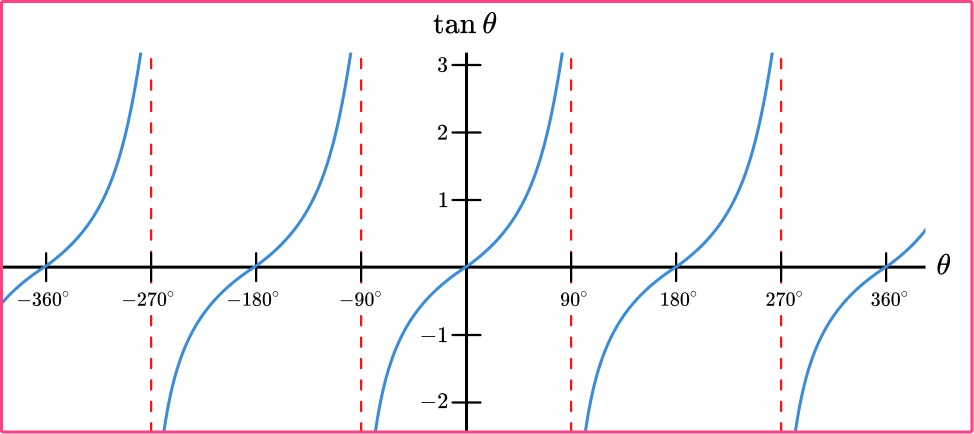
Using the unit circle and the fact that \tan{\theta}=\frac{\sin{\theta}}{\cos{\theta}}, we can obtain the graph of y=\tan{\theta} for any value of \theta. We need to know the graph of y=\tan{\theta} for the range -360\leq\theta\leq{360}^{\circ}.
The horizontal axis of a trigonometric graph represents the angle, usually written as \theta, and the y -axis is the tangent function of that angle.
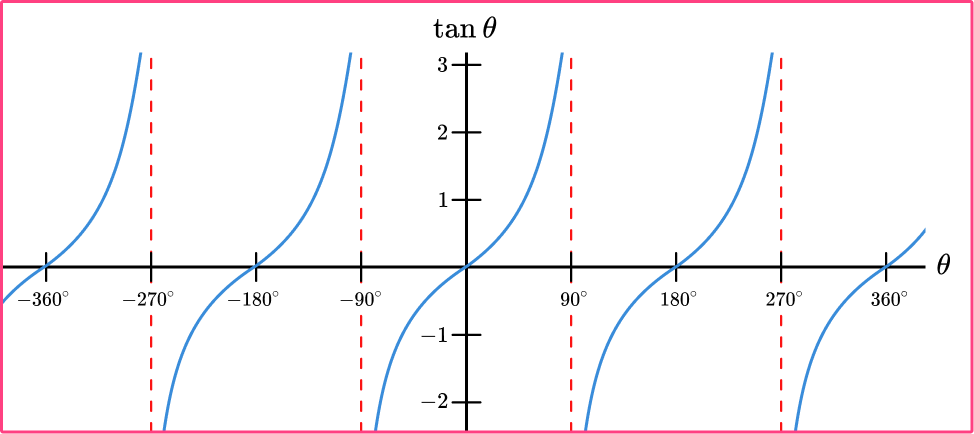
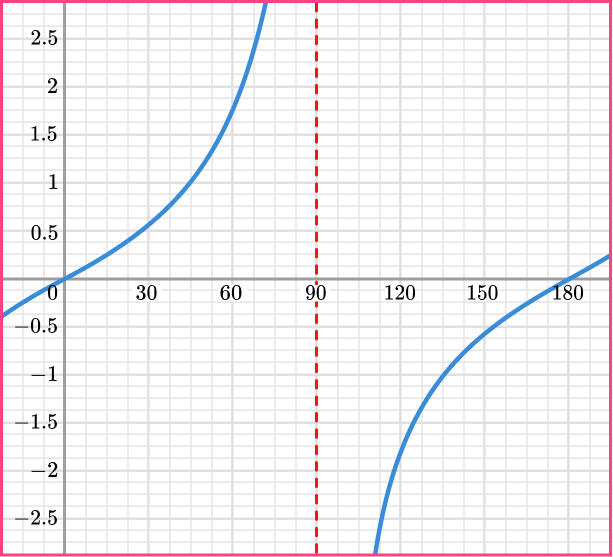
- The graph repeats every 180^{\circ} (the graph is periodic).
- The graph is not a continuous curve; instead the graph is disjointed.
- Vertical asymptotes occur at 90^{\circ}\pm{180}^{\circ} .
Interpreting tan graphs
We can use the tan graph to work out \theta.
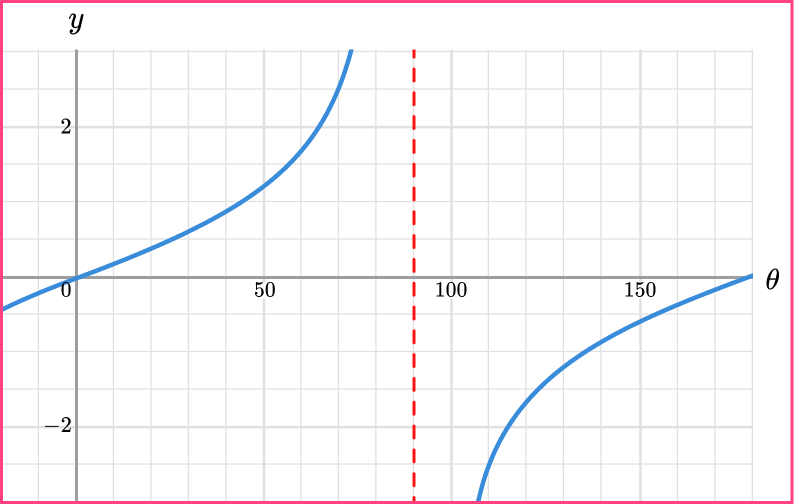
Looking at the graph of y=\tan\theta for 0\leq\theta\leq{180}^{\circ}, if we know that \tan\theta=4, we can draw a horizontal line across from 4 on the vertical axis to the graph and then down to the horizontal axis and read off the value.
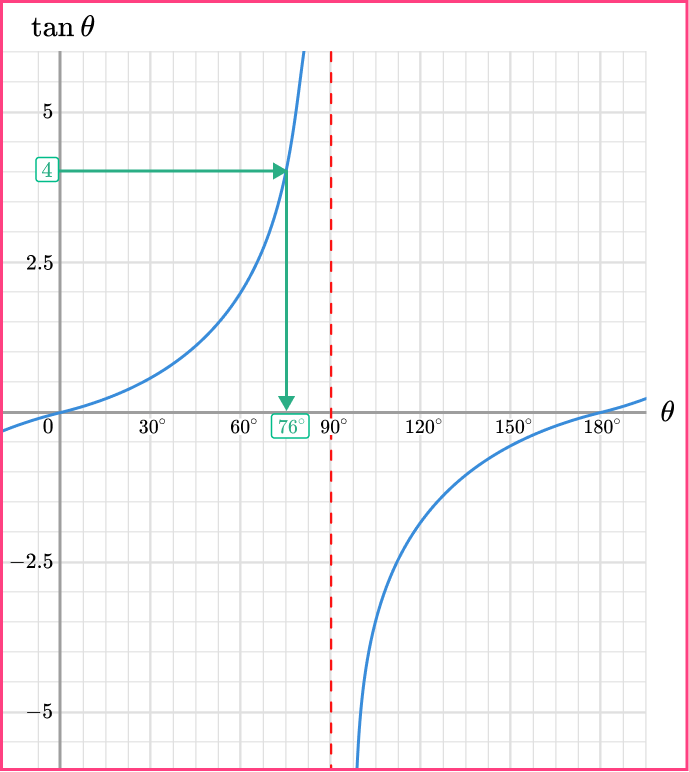
So when \tan\theta=4, we can see that \theta\approx{76}^{\circ}.
Note that this is exactly the same as \tan^{-1}(4)\approx{76}^{\circ}.
Again, this is not the only solution however as we are only looking at the range of values between 0 and 180 degrees, another value for \tan{\theta}=4 does not occur in this range. If we extended the horizontal line from 4 further, we also get the same value of \tan{\theta}=4 when \theta=256^{\circ}.
Notice again that 76^{\circ}+180^{\circ}=256^{\circ}. In fact for any angle 0\leq\theta\leq{180}^{\circ}, if we calculate \tan\theta we will get the same value as \tan(\theta+180).
We can also inverse this method to show that \tan{(76)}\approx{4}. To do this, we change the direction of the arrows, so we start from 76 on the horizontal axis, move vertically towards the graph, then read off the value on the vertical axis.

As the function is periodic over 360^{\circ}, if we added 360 to each angle, we would also have \theta=76+360=436^{\circ} and \theta=256+360=616^{\circ}. This can also occur for values of \theta in the negative direction.
Step-by-step guide: Tan graph
How to use trig graphs
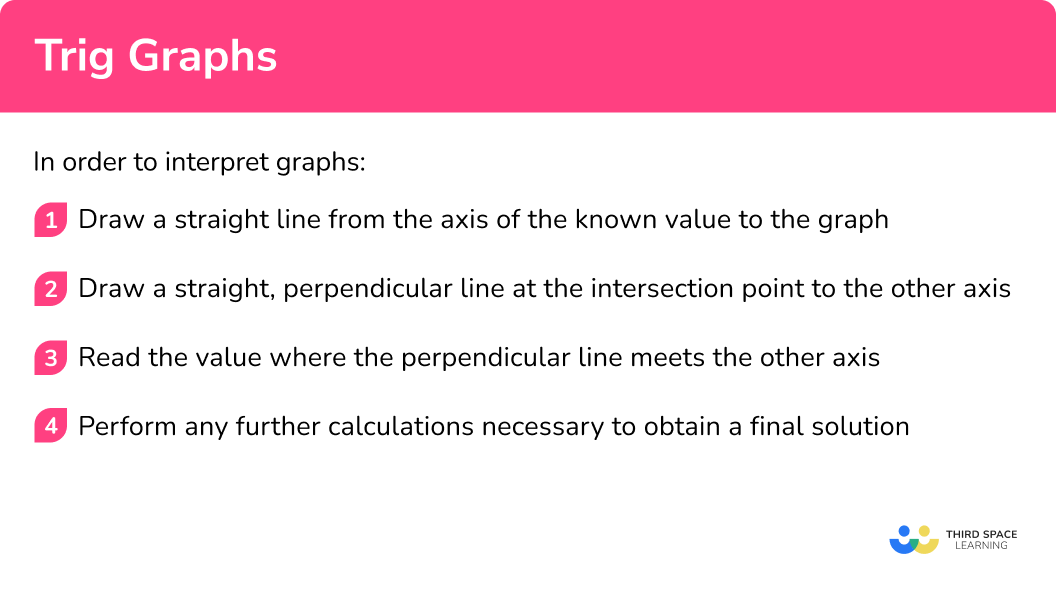
In order to interpret trig graphs:
- Draw a straight line from the axis of the known value to the graph.
- Draw a straight, perpendicular line at the intersection point to the other axis.
- Read the value where the perpendicular line meets the other axis.
- Perform any further calculations necessary to obtain a final solution.
Explain how to use trig graphs
Trigonometric graphs examples
Example 1: interpreting trig graphs of sin θ
Using the graph of y=\sin{\theta} for 0\leq\theta\leq{360}^{\circ}, estimate the value of \sin(225).

- Draw a straight line from the axis of the known value to the graph
Here we know the value \theta=225^{\circ} on the horizontal axis and so we need to draw a vertical line down to the graph.
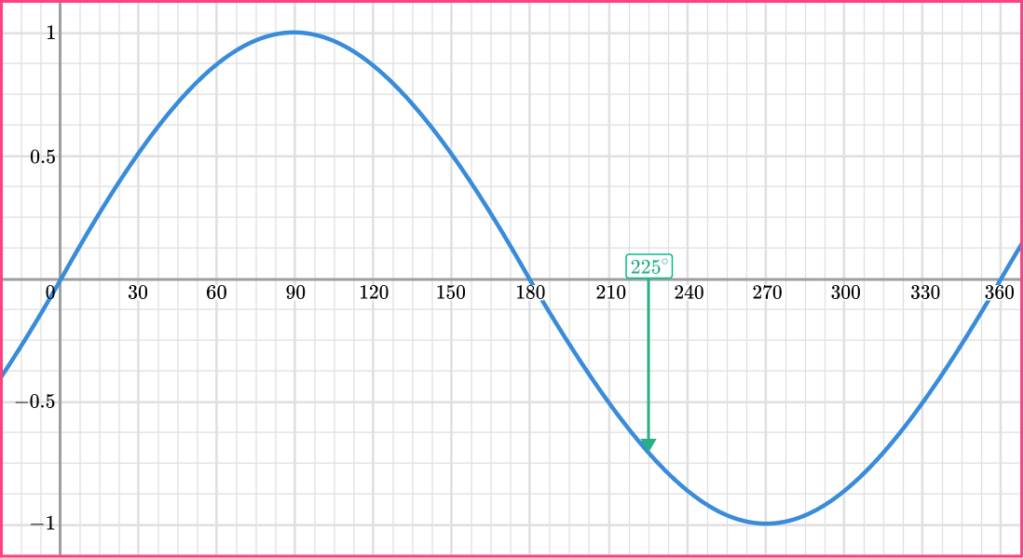
2Draw a straight, perpendicular line at the intersection point to the other axis.
3Read the value where the perpendicular line meets the other axis.
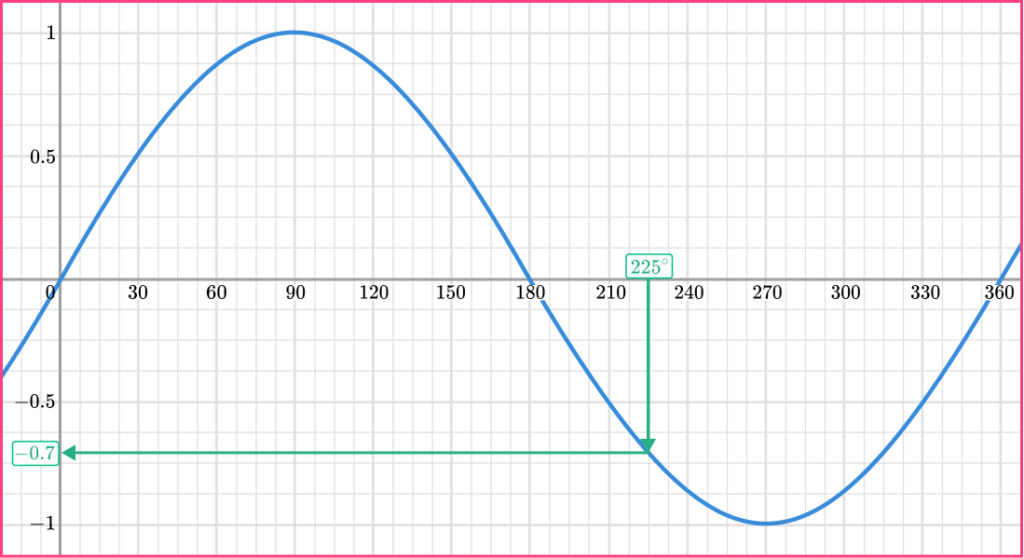
The value of \sin{225}\approx-0.7
4Perform any further calculations necessary to obtain a final solution.
Not required.
Example 2: interpreting trig graphs of sin θ
Using the graph of y=\sin{\theta}, estimate the value of \theta when \sin{\theta}=-0.5 for 240\leq\theta\leq{360}^{\circ}.
Here we know the value \sin\theta=-0.5 on the vertical axis and so we need to draw a horizontal line across the graph. As we need to find \theta within the range of 240\leq\theta\leq{360}^{\circ} we need to make sure our line crosses the graph between these values.
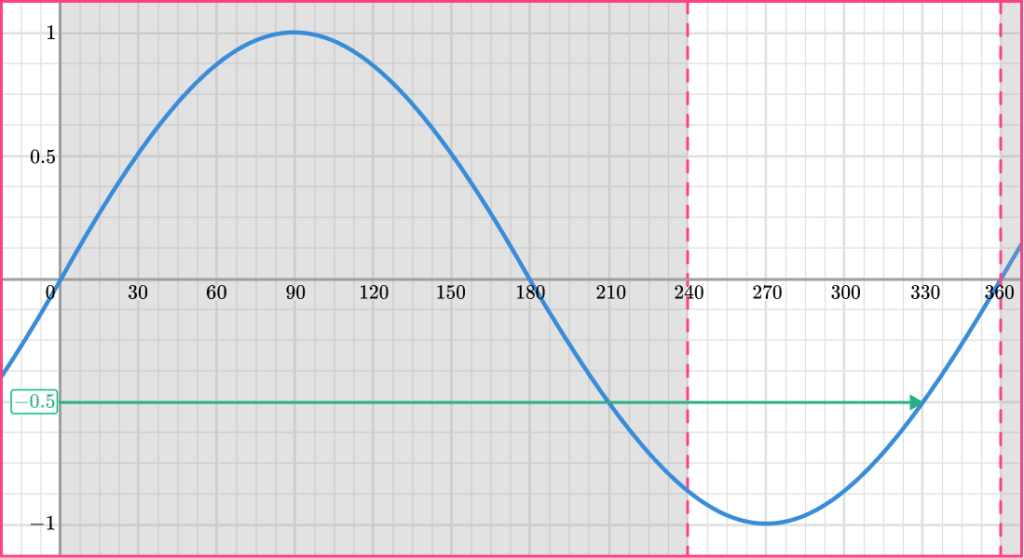
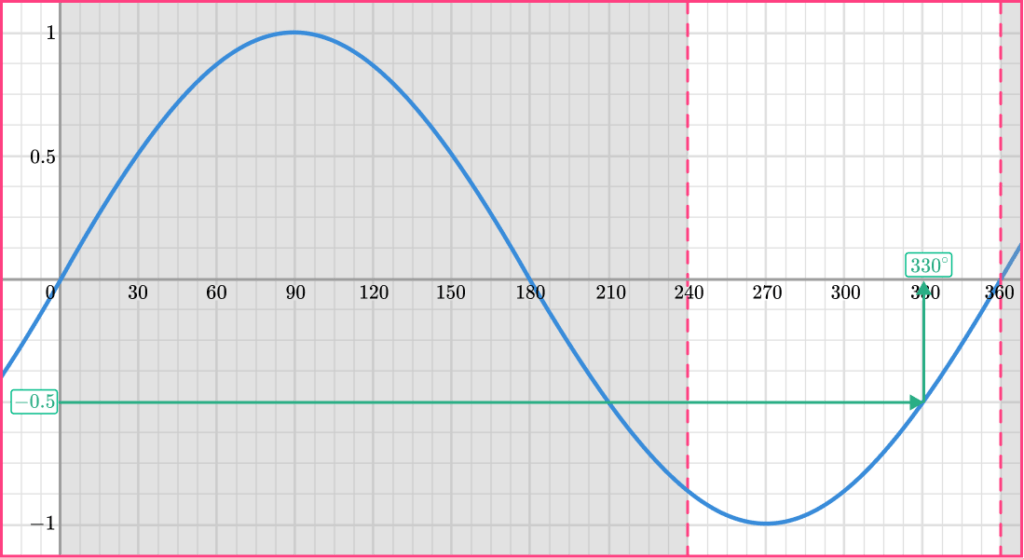
The value of \sin^{-1}(-0.5)=330^{\circ} for 240\leq\theta\leq{360}^{\circ}.
Not required.
Example 3: interpreting trig graphs of cos θ
Using the graph of y=\cos{\theta} for 0\leq\theta\leq{180}^{\circ}, estimate the value of \cos(-70).
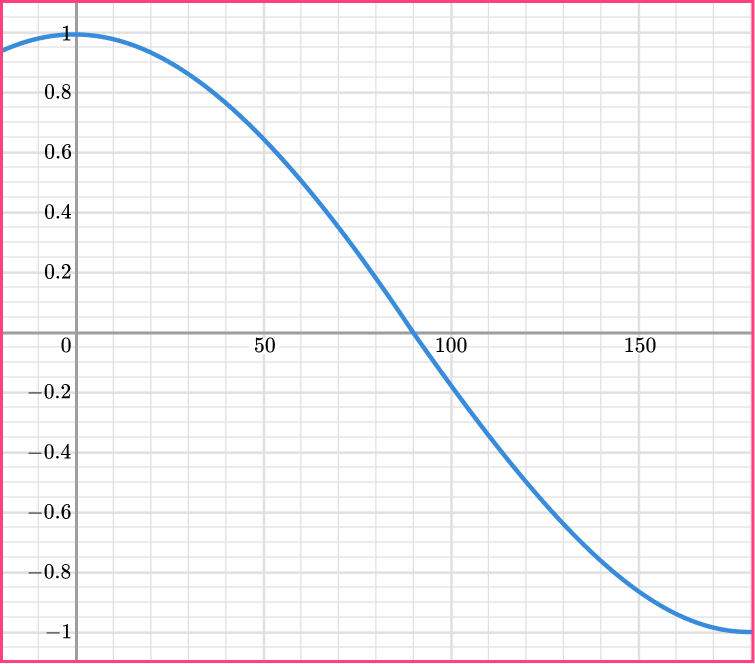
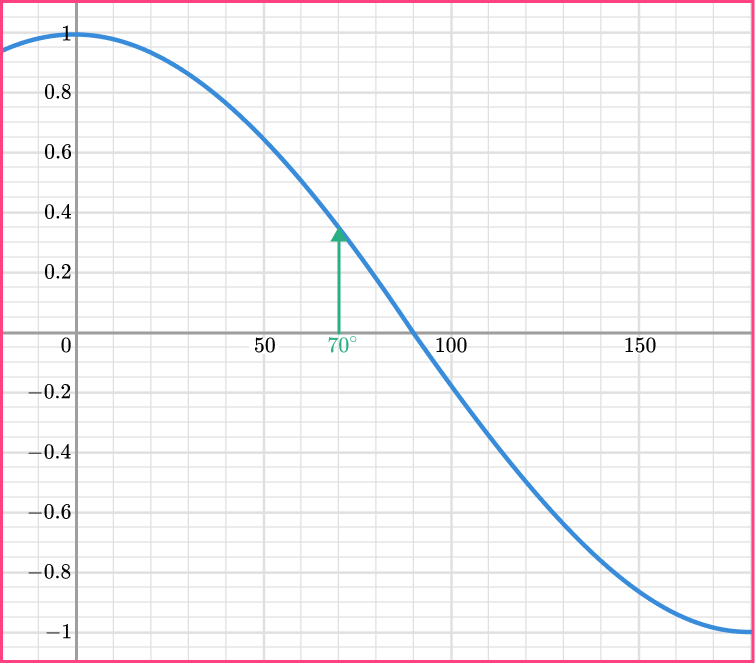
Here we cannot directly work out the value of \cos(-70) as we do not have the graph for this value. However, as the graph is symmetrical about the vertical axis, we can work out the value of \cos(70) as this will be the same as the value of \cos(-70). We therefore need to draw a vertical line from the horizontal axis at 70^{\circ}.
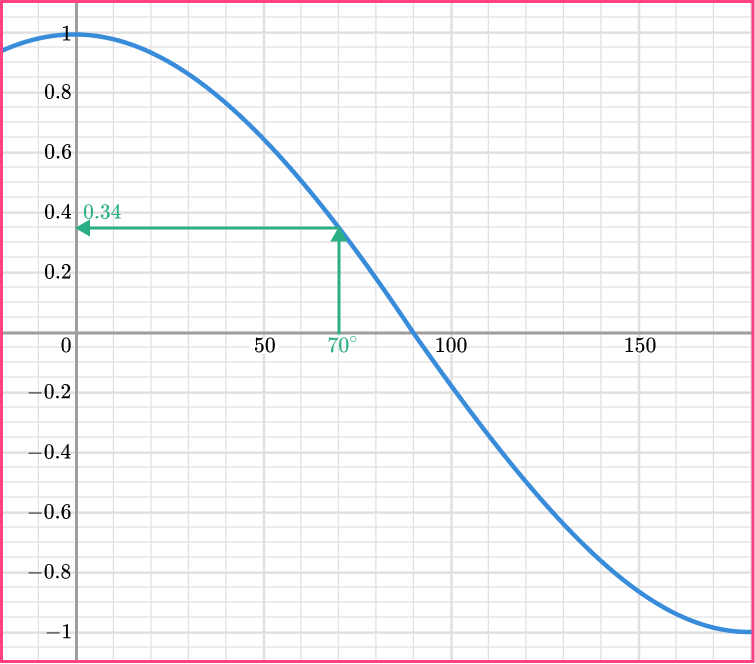
The value of \cos{70}\approx{0.34}.
As we previously determined that \cos70=\cos(-70), the value of \cos(-70)\approx{0.34} as well.
Example 4: interpreting trig graphs of cos θ
Using the graph of y=\cos{\theta}, estimate the value of \theta when \cos{\theta}=-0.2 for 180\leq\theta\leq{360}^{\circ}.
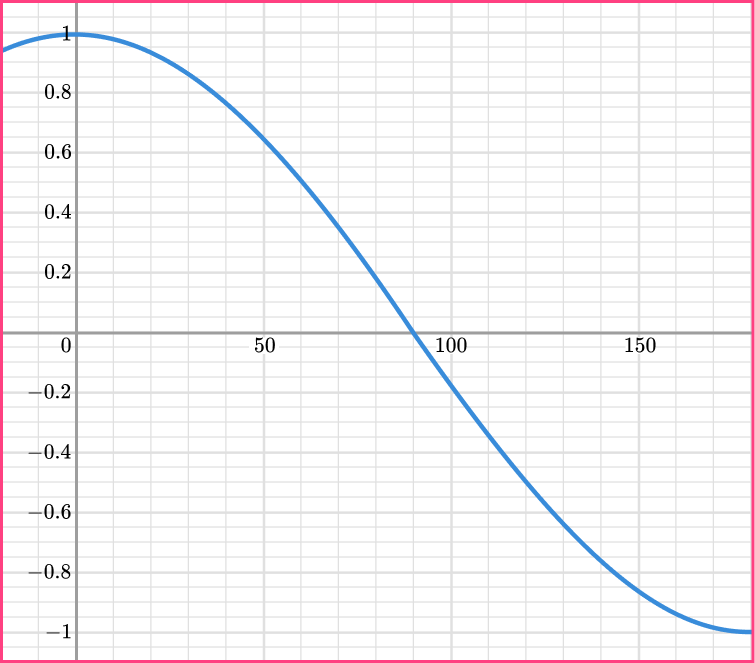
Here we know the value \cos\theta=-0.2 on the vertical axis and so we need to draw a horizontal line across the graph. However, the graph does not exceed 180 degrees and so we need to determine the angle for \cos\theta=-0.2 within the range we do have, and then calculate the value beyond this range.
Drawing a horizontal line from -0.2 on the vertical axis to the graph, we have,
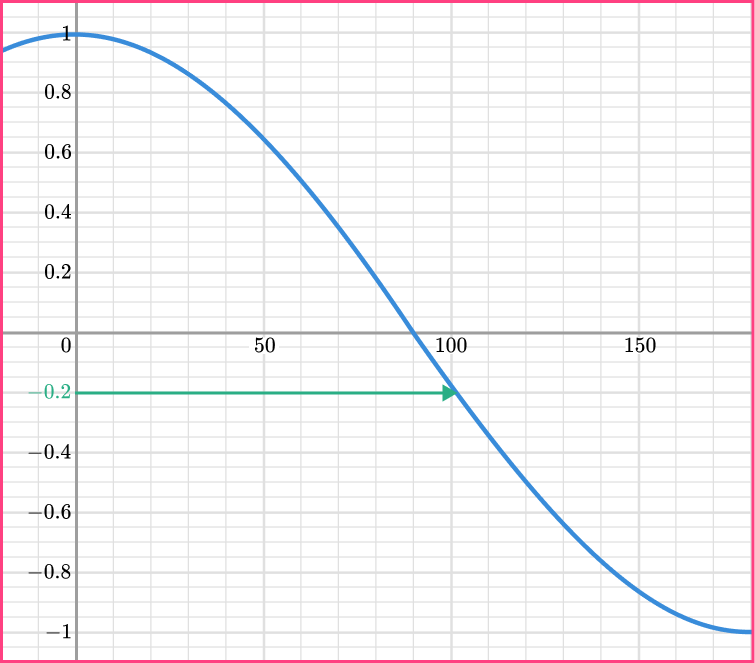
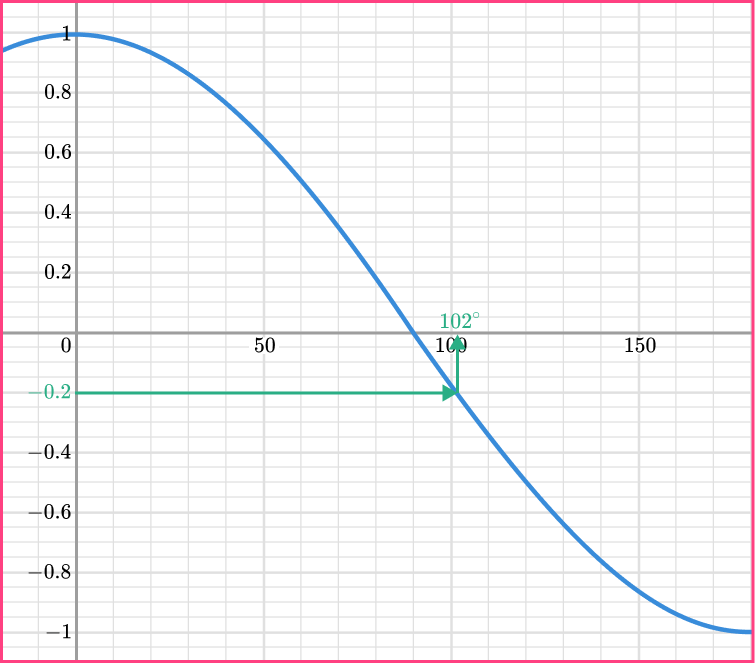
The value of \cos^{-1}(-0.2)\approx{102}^{\circ} for 0\leq\theta\leq{180}^{\circ}.
We need to subtract 102^{\circ} from 360^{\circ} to get the value of \theta in the range 180\leq\theta\leq{360}^{\circ}.
360-102=258^{\circ}.
The value of \cos^{-1}(-0.2)\approx{258}^{\circ} for 180\leq\theta\leq{360}^{\circ}
Example 5: interpreting trig graphs of tan θ
Using the graph of y=\tan{\theta} for 0\leq\theta\leq{180}^{\circ}, estimate the value of \tan(-45).
Here we cannot directly work out the value of \tan(-45) as we do not have the graph for this value. However, as the graph has rotational symmetry about the origin, if we can find \tan(45) we can use this to work out the value of \tan(-45).
We now need to find \tan(45). The angle 45^{\circ} is on the horizontal axis and so we need to draw a vertical line to the graph first.
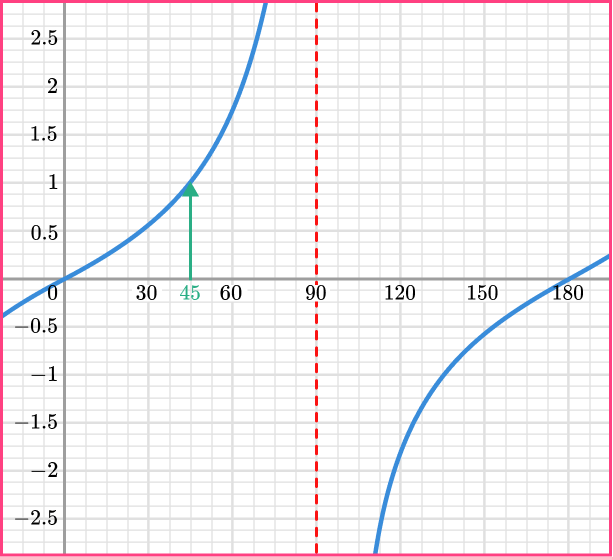
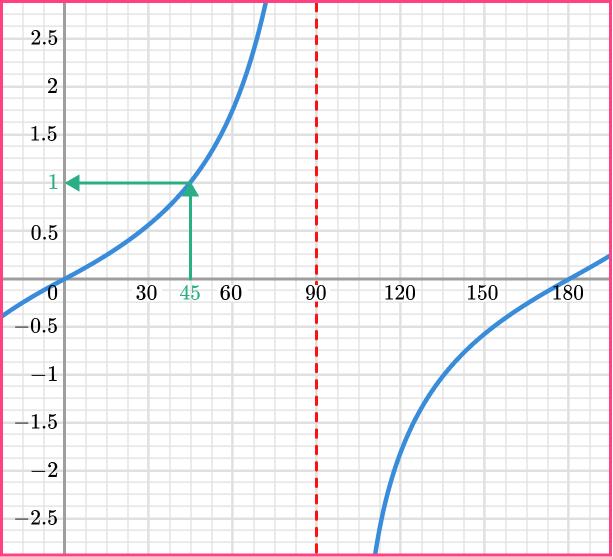
The value of \tan{45}=1.
We already found that \tan{(-45)}=-\tan(45) and so the value of \tan{(-45)}=-1.
Example 6: interpreting trig graphs of tan θ
Using the graph of y=\tan{\theta}, estimate the value of \theta when \tan{\theta}=2 for -540\leq\theta\leq{-450}^{\circ}.
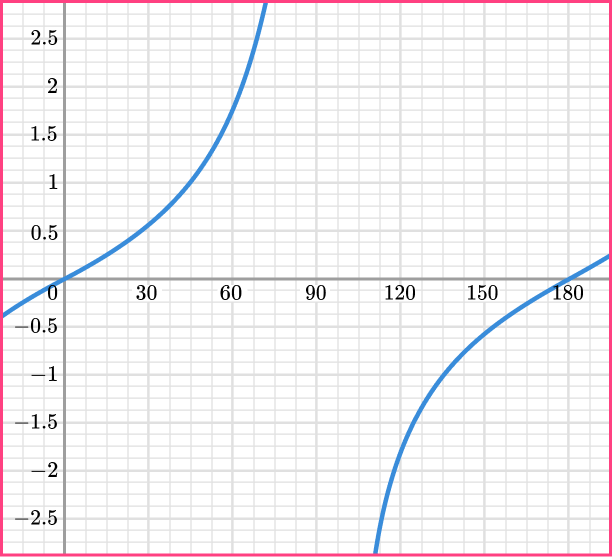
Here we know the value \tan{\theta}=2 on the vertical axis and so we need to draw a horizontal line across the graph. However, the graph does not go below 180 degrees and so we need to determine the angle for \theta within the range we do have, and then calculate the value beyond this range.
Drawing a horizontal line from 2 on the vertical axis to the graph, we have,
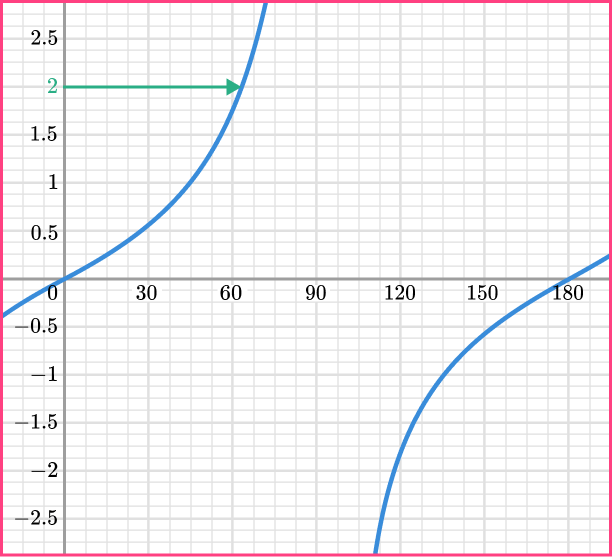
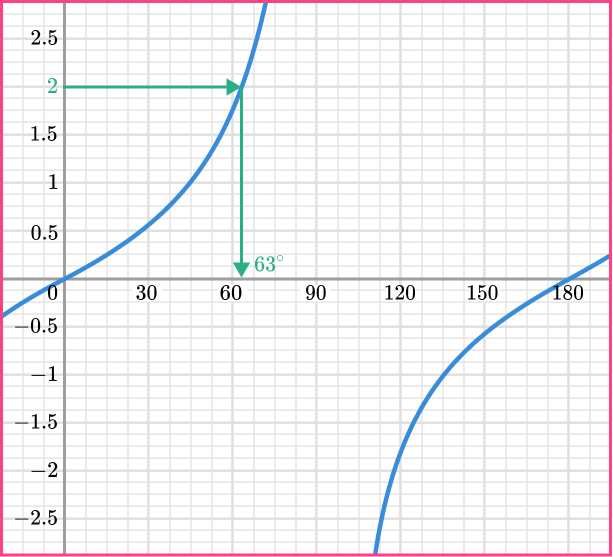
The value of \tan^{-1}(2)\approx{63}^{\circ} for 0\leq\theta\leq{180}^{\circ}.
As the graph repeats every 180 degrees, we need to subtract 180 from 63 enough times to get the value of \theta in the range -540\leq\theta\leq{-450}^{\circ}.
63-180=-117
-117-180=-297
-297-180=-477^{\circ}
The value of \tan^{-1}(2)\approx{-477}^{\circ} for -540\leq\theta\leq{-450}^{\circ}.
Common misconceptions
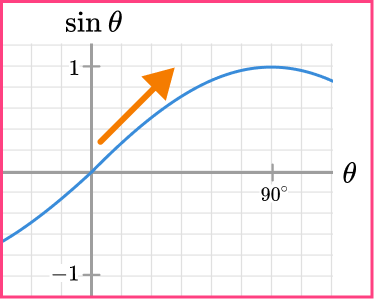
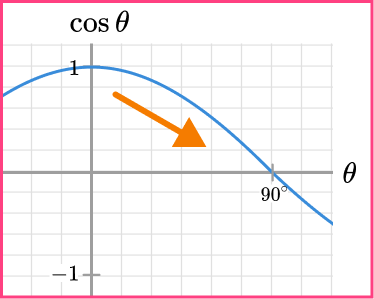
- Sine and cosine graphs switched
The sine and cosine graphs are very similar and can easily be confused with one another. A tip to remember is that you “sine up” from 0 for the sine graph so the line is increasing whereas you “cosine down” from 1 so the line is decreasing for the cosine graph.
- Asymptotes are drawn incorrectly for the graph of the tangent function
The tangent function has an asymptote at 90^{\circ} because this value is undefined. As the curve repeats every 10^{\circ}, the next asymptote is at 270^{\circ} and so on.
- The graphs are sketched using a ruler
Each trigonometric graph is a curve and therefore the only time you are required to use a ruler is to draw a set of axes. Practice sketching each curve freehand and label important values on each axis.
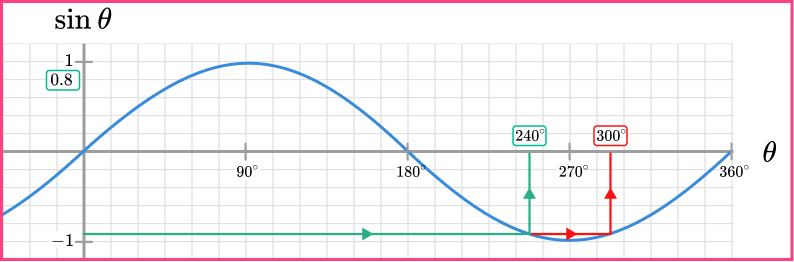
- Value given out of range
When finding a value of \theta using a trigonometric graph, you must make sure that the value of \theta is within the range specified in the question.
For example, the range of values for \theta is given as 0\leq\theta\leq{360}^{\circ} and only the value of \theta=240^{\circ} is written for the solution, whereas the solution \theta=300^{\circ} is also correct.
- Incorrect calculation to find values of beyond the range shown
When finding a value of \theta using a trigonometric graph, you must make sure that you can base your calculation on a value that you can see on the graph drawn. From here, you need to either use the trigonometric equations or visualise how the value of \theta changes for each function around key values of 0^{\circ}, 180^{\circ} and 360^{\circ}.
Practice trigonometric graphs questions
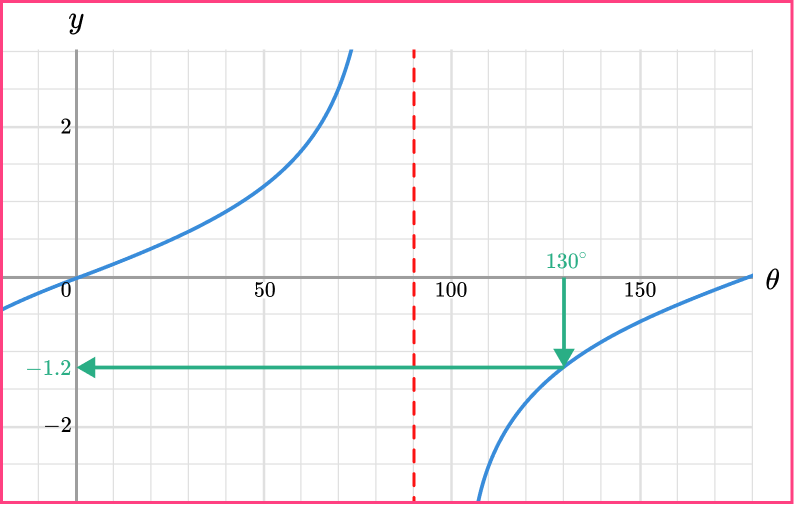
1. Using the graph of y=\tan\theta for 0\leq\theta\leq{180}^{\circ} below, estimate the value of \tan(-50).


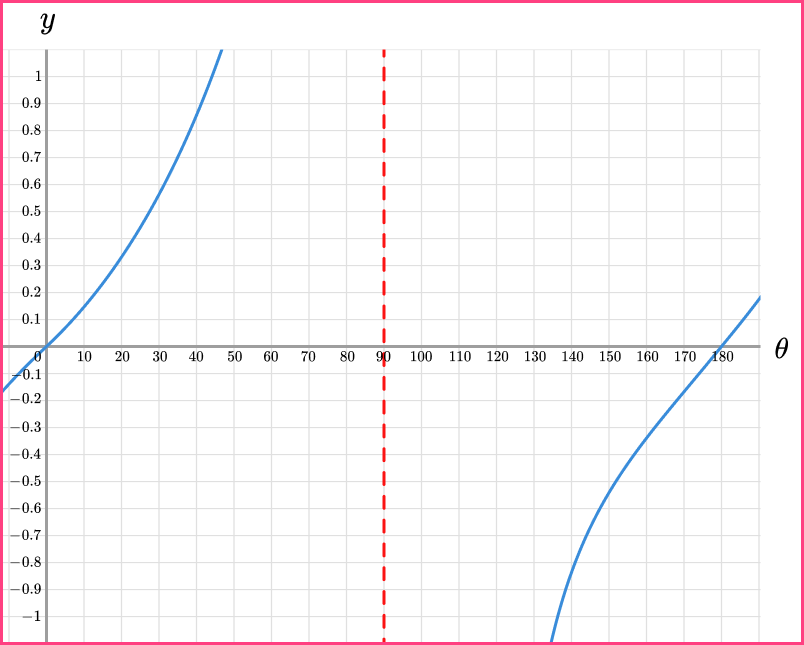
2. Using the graph of y=\tan\theta for 0\leq\theta\leq{180}^{\circ} below, estimate the value of \theta for 450\leq\theta\leq{540}^{\circ} when \tan\theta=-0.1.
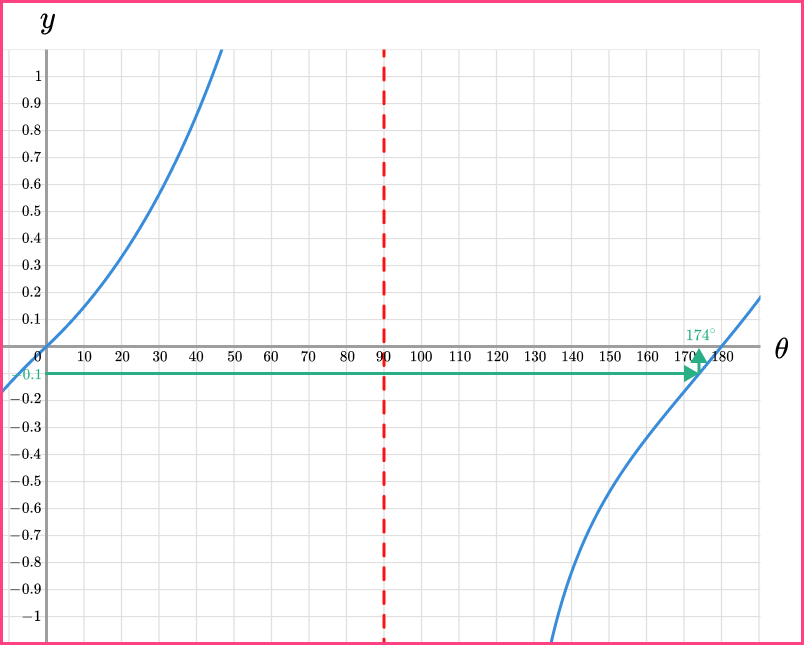
174+180+180=534^{\circ}
3. Using the graph of y=\cos\theta for 0\leq\theta\leq{180}^{\circ} below, estimate the value of \theta for 450\leq\theta\leq{540}^{\circ} when \cos\theta=0.9.
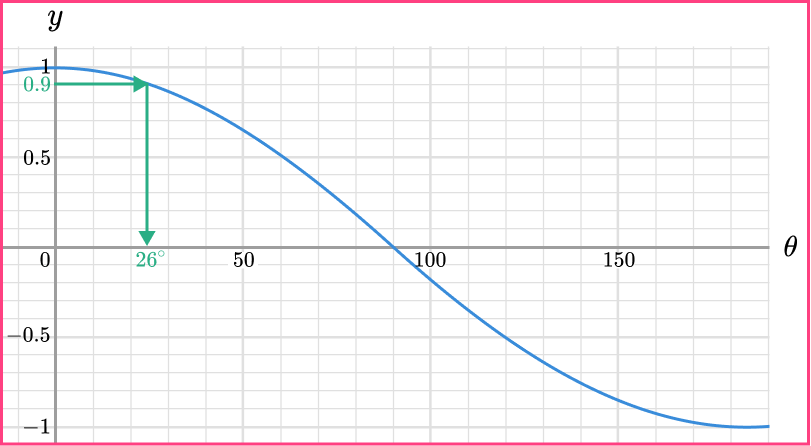
The cosine graph in the range of 450\leq\theta\leq{540}^{\circ} is on the upwards slope and so we need to determine the same value for \cos\theta=0.9 when 180\leq\theta\leq{360}^{\circ}.
180-26=154^{\circ}
We then add 360 degrees to the angle to obtain the value in the required range.
154+360=514^{\circ}
4. Using the graph of y=\cos\theta for 0\leq\theta\leq{180}^{\circ} below, estimate the value of \cos(-485).

To obtain a value of \theta for 0\leq\theta\leq{360}^{\circ}, we need to add 360 degrees twice to get,
\cos(-485)=\cos(-485+360+360)=\cos(235).
We need the value of \theta for 0\leq\theta\leq{180}^{\circ} and so we need to subtract our angle from {360}^{\circ}.
\cos(235)=\cos(360-235)=\cos(125)
Using the graph,
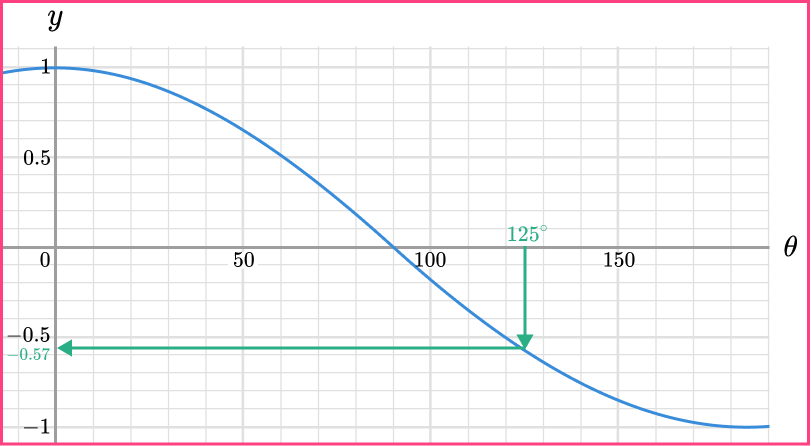
\cos(125)=-0.57 and so \cos(-485)=\cos(125)=-0.57.
5. Using the graph of y=\sin\theta for 0\leq\theta\leq{180}^{\circ} below, estimate the value of \sin(-225).
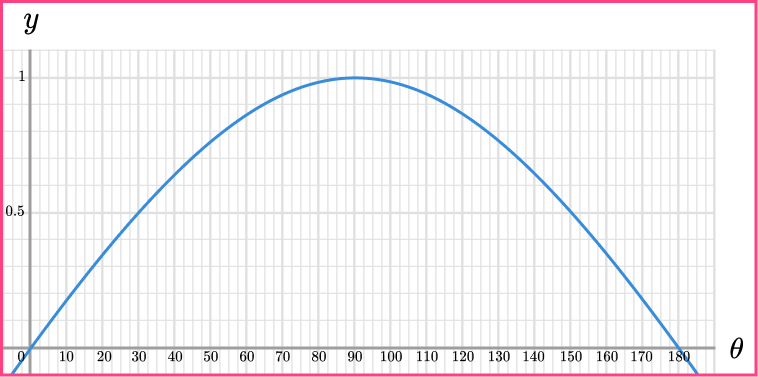
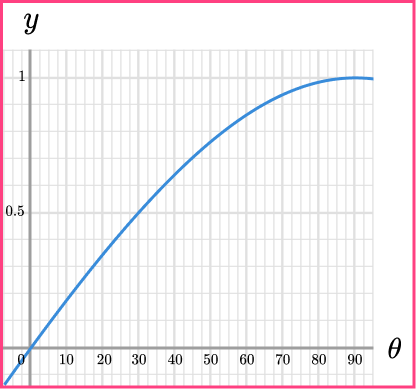
6. Using the graph of y=\sin\theta for 0\leq\theta\leq{90}^{\circ} below, estimate the value of \theta for -450\leq\theta\leq{-360}^{\circ} when \sin\theta=-0.3.
Using the graph,
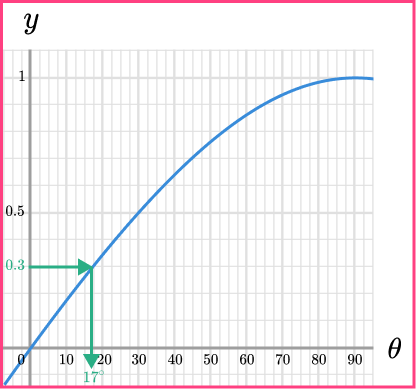
\sin^{-1}(0.3)=17^{\circ} and so \sin^{-1}(-0.3)=-\sin^{-1}(0.3)=-17^{\circ}.
The sine graph in the range of -450\leq\theta\leq{-360}^{\circ} is on the downwards slope below the horizontal axis and so we need to determine the same value for \sin\theta=-0.3 when -450\leq\theta\leq{-360}^{\circ} by simply subtracting 360 degrees from -17.
-17-360=-377^{\circ}
Trig graphs GCSE questions
1. (a) Below is the graph of y=\cos\theta for 0\leq\theta\leq{360}^{\circ}.
Determine all of the values of \theta when y=0 for the range -360\leq\theta\leq{360}^{\circ}.
(b) What value of \theta is equal to \cos{(-60)} for -90\leq\theta\leq{0}^{\circ}?
(5 marks)
(a)
\theta=90^{\circ}, 270^{\circ} from graph
(1)
\theta=-90^{\circ}(1)
\theta=-270^{\circ}(1)
(b)
\cos(60)=\cos(-60)
(1)
0.5(1)
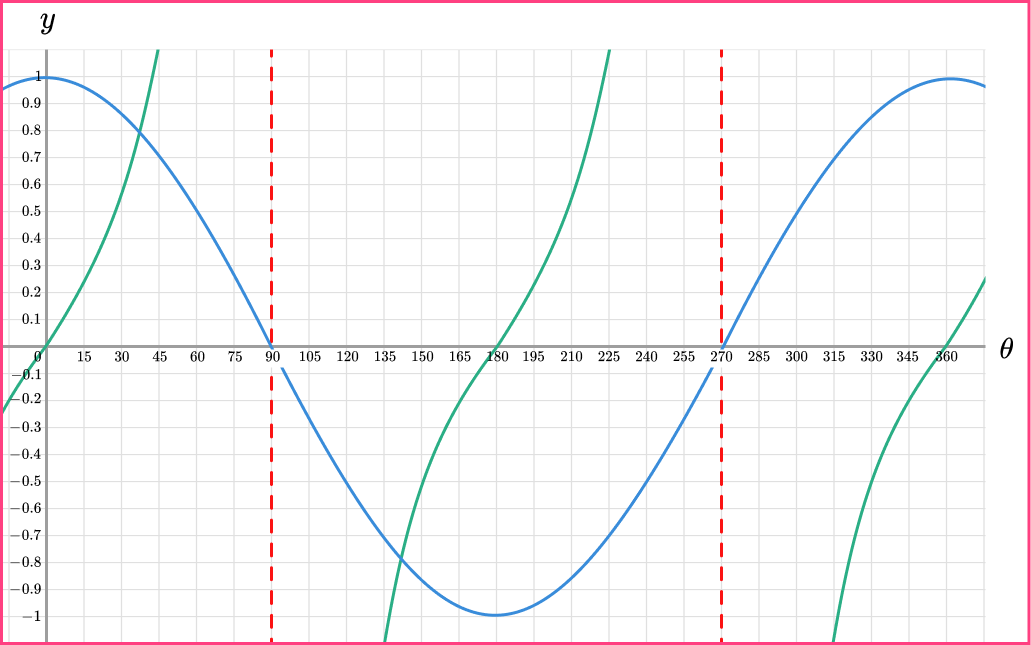
2. Below is the graph of y=\cos\theta and y=\tan\theta for 0^{\circ}\leq \theta \leq 360^{\circ}. Use the graph to determine the value of \theta where \sin\theta=\tan\theta for 360^{\circ}\leq \theta \leq 450^{\circ}.
(2 marks)
Answer in range 35 to 40.
(1)
Answer in range 395^{\circ} to 400^{\circ}.
(1)
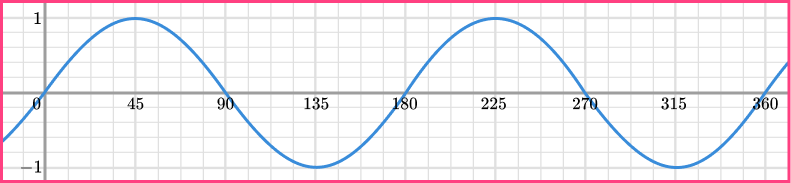
3. Below is the graph of y=\sin(2\theta) for 0\leq\theta\leq{360}^{\circ}.
Determine the values of \theta such that y=0.5 for -180\leq\theta\leq{-90}^{\circ}.
(3 marks)
(1)
\theta=15-180=-165^{\circ}(1)
\theta=((90-15)-180)=-105^{\circ}(1)
Learning checklist
You have now learned how to:
The next lessons are
Still stuck?
Prepare your KS4 students for maths GCSEs success with Third Space Learning. Weekly online one to one GCSE maths revision lessons delivered by expert maths tutors.

Find out more about our GCSE maths tuition programme.