GCSE Tutoring Programme
Our chosen students improved 1.19 of a grade on average - 0.45 more than those who didn't have the tutoring.
In order to access this I need to be confident with:
Trigonometry Trigonometric functions Exact trig values Plotting graphs Sketching graphsThis topic is relevant for:

Tan Graph
Here we will learn about tan graphs or tangent graphs, including how to recognise the graph of the tangent function, sketch the tangent curve and label important values, and interpret the tangent graph.
You can also download the following free tan graph resources all suitable for those following Edexcel, AQA or OCR exam boards:
What is the tan graph?
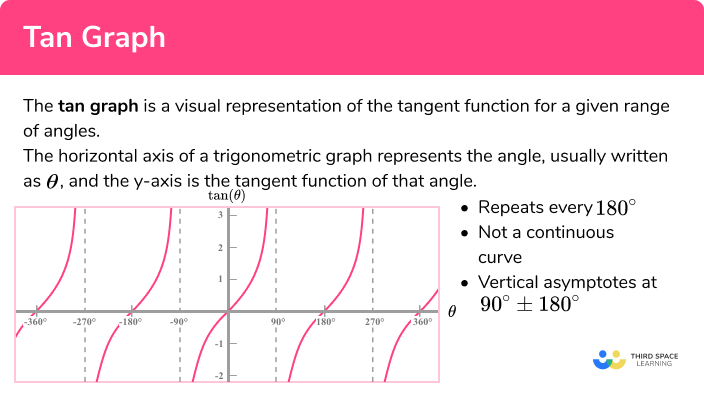
The tan graph is a visual representation of the tangent function for a given range of angles.
The horizontal axis of a trigonometric graph represents the angle, usually written as \theta , and the y -axis is the tangent function of that angle.

- repeats every 180^o
- Not a continuous curve
- Vertical asymptotes at 90^o \pm 180^o
We will only look at the graph of the tangent function in this lesson for angles in degrees although this can also be represented in radians.
What is the tan graph?
Sine, cosine & tangent graphs worksheet
Get your free tan graph worksheet of 20+ sine, cosine & tangent graphs questions and answers. Includes reasoning and applied questions.
DOWNLOAD FREE Sine, cosine & tangent graphs worksheet
Get your free tan graph worksheet of 20+ sine, cosine & tangent graphs questions and answers. Includes reasoning and applied questions.
DOWNLOAD FREEHow to plot the tan graph
Remember that \tan(\theta) is a relationship between the opposite side and the adjacent side of a right angle triangle:

Let’s look at 3 triangles where we would use the tangent ratio to calculate the size of the angle \theta . For each triangle, the adjacent side is the same but the length of the opposite side and the associated angle change.

Here we can see that as \tan(\theta)=\frac{opp}{adj} , as the angle \theta increases, the length of the side opposite to the angle also increases. So for each triangle we have:
- Triangle 1: \tan(\theta)=\frac{3}{10}=0.3
- Triangle 2: \tan(\theta)=\frac{9}{10}=0.9
- Triangle 3: \tan(\theta)=\frac{15}{10}=1.5
So what would happen if the opposite side to the angle is equal to 10 ?
\tan(\theta)=\frac{10}{10}=1
So when the opposite side is equal to the adjacent side, we get \tan(\theta) = 1 .
What about when the opposite side is equal to 0 ?
\tan(\theta)=\frac{0}{10}=0
So when the opposite side is equal to 0, \; \tan(\theta) = 0.
If we plotted a graph to show the value of \tan(\theta) for each value of \theta between 0^o and 90^o , we get the following graph of the tangent function:

Let us add the values of \tan(\theta) for the three triangles from earlier into the graph to show how they would look:

We can now use the graph to find the angle \theta for triangles 1, 2, and 3 :

This graph shows that when \tan(\theta) = 0.3 , \; \theta = 17^o so we have the triangle


This graph shows that when \tan(\theta) = 0.9 , \; \theta = 42^o so we have the triangle


This graph shows that when \tan(\theta) = 1.5 , \; \theta = 56^o so we have the triangle

This shows us that we can use the graph of the tangent function to find missing angles in a triangle. More on this later as we have a large problem to resolve. How can the opposite side of a right angle triangle be equal to 0 ? What if the adjacent side is equal to 0 ?
Unfortunately there is a limit to the use of trig ratios to find angles between 0 and 90^o . For any larger or smaller angles, we need to look at the unit circle.
Explain how to plot the tan graph
Unit circle
The unit circle is a circle of radius 1 with the centre at the origin. We can label the values where the circle intersects the axes because we know that the radius of the unit circle is 1 unit.

We can still construct a triangle within the unit circle with the angle starting from the positive x axis.

Looking at the trigonometric ratios of sine and cosine, we can say that:
- \sin(\theta)=\frac{a}{1} \; \text{so} \; a=\sin(\theta)
- \cos(\theta)=\frac{b}{1} \; \text{so} \; b=\cos(\theta)
- \tan(\theta)=\frac{a}{b} \; \text{so} \; \tan(\theta)=\frac{\sin(\theta)}{\cos(\theta)}
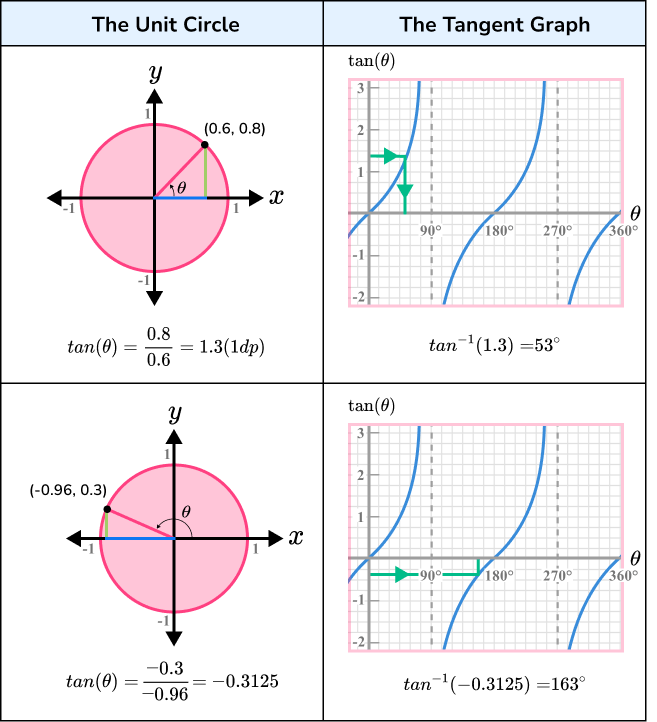
This means that the width of the triangle is equal to \cos(\theta) and the height of the triangle is equal to \sin(\theta) . The point on the unit circle is therefore the coordinate ( \cos(\theta) , \; \sin(\theta) ):

When do we get positive and negative values for tan(θ)
As \tan(\theta)=\frac{\sin(\theta)}{\cos(\theta)} , we can now calculate when the tangent function is positive and negative using division of negative numbers.

\tan(\theta) is as periodic function as we could continue to turn around the origin from the positive x axis beyond 360^o .
We can also turn anticlockwise which would give us the negative values for the value of \tan(\theta) .
The period of the function is 180^o
What is an asymptote?
An asymptote is a line that a curve gets closer and closer to but never touches as the curve goes towards infinity.

We know that \tan(\theta)=\frac{\sin(\theta)}{\cos(\theta)} .
As \tan(\theta) can be expressed as a fraction, we have an issue when \cos(\theta) = 0 as you cannot divide by 0 . This means that the value for \tan(\theta) is undefined every time \cos(\theta) = 0 , which occurs every at 90^o \pm 180^o when y=0 .
Given the angles in the table below, the gradient of the graph increases continuously as the value of \theta tends towards 90^o .

We already know that the graph of the tangent function is periodic and so a vertical asymptote occurs every 180^o before and after the asymptote shown above. See the graph below:

The graph of the tangent function

Key features include:
- Periodic (repeats every 180^o )
- Not a continuous curve
- Vertical asymptotes at 90^o \pm 180^o
- The curve always has a positive gradient
Unlike the graphs for the sine and cosine functions, the tangent function is not a wave. This is because the graph is not continuous.
There is therefore no amplitude to the wave as there is no maximum or minimum value.
The tangent function can change when we transform the function. For more information, see the lesson on transformations of trigonometric functions.
You should be able to interpret the unit circle to determine the value of \theta . Here are a couple of examples to help you.
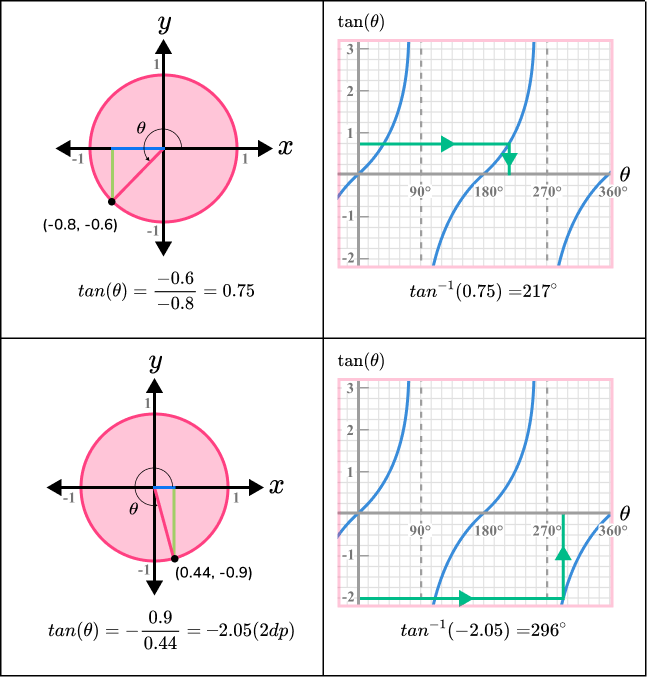
Now that we have generated the graph of \tan(\theta) , we need to be able to interpret it to find values of \theta and \tan(\theta) for any value between the range -360 \leq \theta \leq 360^o (values for between -360^o and 360^o .
The inverse to \tan(\theta)
The inverse function to \tan(\theta) is given as \tan^{-1}(\theta) in GCSE Mathematics. The power of -1 here is used as the inverse function notation and not the reciprocal. In A level Mathematics we learn that the reciprocal to \tan(\theta) is called the cotangent or \cot(\theta) where \cot(\theta)=\frac{1}{\tan(\theta)}=\frac{\cos(\theta)}{\sin(\theta)} . In order to not get confused with with the inverse function notation, we call the inverse of \tan(\theta) \arctan(\theta). We do the same with the inverse functions of the sine and cosine functions, \arcsin(\theta) and \arccos(\theta).
How to interpret tangent graphs
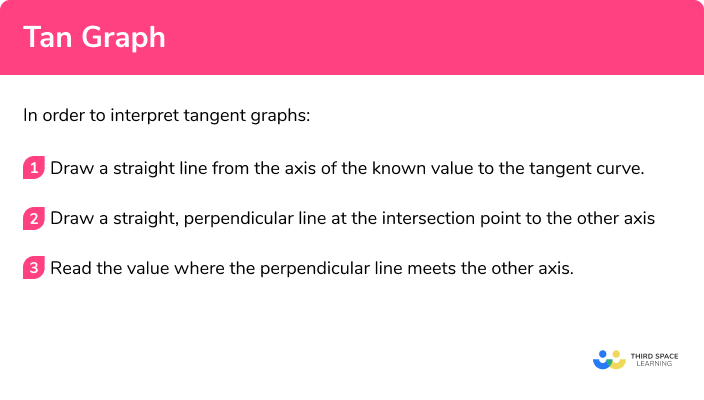
In order to interpret tangent graphs:
- Draw a straight line from the axis of the known value to the tangent curve.
- Draw a straight, perpendicular line at the intersection point to the other axis.
- Read the value where the perpendicular line meets the other axis.
Tangent graph examples
Example 1: 0° ≤ θ ≤ 90°
Use the graph of \tan(\theta) to estimate the value for \theta when \tan(\theta)=1.5 for 0^o \leq \theta \leq 90^o

- Draw a straight line from the axis of the known value to the tangent curve.

2Draw a straight, perpendicular line at the intersection point to the other axis.

3Read the value where the perpendicular line meets the other axis.
When \tan(\theta)=1.5, \; \theta=56^o
Example 2: 90° ≤ θ ≤ 270°
Use the graph of \tan(\theta) to estimate the value for \theta when \tan(\theta)=0.5 for 90^o \leq \theta \leq 270^o


When \tan(\theta)=0.5, \; \theta=207^o
Example 3: 270 ≤ θ ≤ 360°
Use the graph of \tan(\theta) to estimate the value for \tan(\theta) when \theta=300^o .


When \theta=300^o, \; \tan(\theta)=-1.75 .
Example 4: −180 ≤ θ ≤ 0°
Use the graph of \tan(\theta) to estimate the value for \theta when \tan(\theta)=-0.5 for -180 \leq \theta \leq 0^o


When \tan(\theta)=-0.5, \; \theta=-27^o
Example 5: −360° ≤ θ ≤ 0°
Use the graph of \tan(\theta) to estimate the value for \tan(\theta) when \theta=-255^o .


When \theta=-225^o, \; \tan(\theta)=-1 .
Example 6: −360° ≤ θ ≤ 360°
Use the graph of \tan(\theta) to estimate the value for \theta when \tan(\theta)=0.25 for -360^o \leq \theta \leq 360^o


When \tan(\theta)=0.25, \; \theta=-346^o, \; \theta=-166^o, \; \theta=14^o \; \text{and} \; \theta=194^o
Common misconceptions
- Drawing the horizontal line only to one intersection point
When you are finding the value of \theta using a trigonometric graph, only one value is calculated when there are more points of intersection.
For example, only the value of 65^o is read off the graph.

- Sine and cosine graphs switched
The sine and cosine graphs are very similar and can easily be confused with one another. A tip to remember is that you “sine up” from 0 for the sine graph so the line is increasing whereas you “cosine down” from 1 so the line is decreasing for the cosine graph.

- Asymptotes are drawn incorrectly for the graph of the tangent function
The tangent function has an asymptote at 90^o because this value is undefined. As the curve repeats every 180^o , the next asymptote is at 270^o and so on.
- The graphs are sketched using a ruler
Each trigonometric graph is a curve and therefore the only time you are required to use a ruler is to draw a set of axes. Practice sketching each curve freehand and label important values on each axis.
- Value given out of range
When finding a value of \theta using a trigonometric graph, you must make sure that the value of \theta is within the range specified in the question.
For example, the range of values for \theta is given as 0^o \leq \theta \leq 360^o and only the value of \theta=240^o is written for the solution, whereas the solution \theta=300^o is also correct.

See also: Trig graphs
Related lessons
Tan graph is part of our series of lessons to support revision on trigonometry. You may find it helpful to start with the main trigonometry lesson for a summary of what to expect, or use the step by step guides below for further detail on individual topics. Other lessons in this series include:
Practice tangent graphs questions
1. Use the graph of \tan(\theta) to calculate the value of \theta when \tan(\theta)=3 for 0^o \leq \theta \leq 180^o


2. Use the graph of \tan(\theta) to calculate the value of \theta when \tan(\theta)=-1.2 for -180^o \leq \theta \leq 90^o


3. Use the graph of \tan(\theta) to calculate the value of \theta when \tan(\theta)=0 for -180^o \leq \theta \leq 180^o


4. Use the graph of \tan(\theta) to calculate the value of \tan(\theta) when \theta=150^o


5. Use the graph of \tan(\theta) to calculate the value of \tan(\theta) when \theta=-320^o


6. What value for \theta would return the same value for 240^o for -90^o \leq \theta \leq 270^o


Tangent graphs GCSE questions
1. Below is a sketch of the graph of y=\tan(\theta) for 0^o \leq \theta \leq 360^o .

If \tan(x)=1.4 , what two values for x would return the same value of \tan(\theta) ?
(3 marks)
(1)
x+180(1)
234.5^o(1)
2. (a) Write an equation in terms of \theta for the size of the angle ABC .

(b) Use the graph of y=\tan(\theta) to estimate the value of \theta in triangle ABC .

(4 marks)
(a)
\tan(\theta)=\frac{25}{15}=1.6…
(1)
\theta =tan^{-1}(1.67)(1)
(b)

(1)
tan^{-1}(1.67) = [55-65^o](1)
3. Write down the solutions to the equation \tan(\theta)=2 for 360^o \leq \theta \leq 720^o .

(2 marks)
[60-70^o] and [240-250^o] highlighted on graph
(1)
[420-430^o] and [600-610^o]
(1)
4. Below are the graphs of y=\sin(\theta) and y=\tan(\theta). Use the graph to find the solutions for \sin(\theta) = \tan(\theta) for -360^o \leq \theta \leq 360^o .

(3 marks)
(1)
\theta = 0^o(1)
\theta=180^o, \; -360^o(1)
Learning checklist
You have now learned how to:
The next lessons are
Still stuck?
Prepare your KS4 students for maths GCSEs success with Third Space Learning. Weekly online one to one GCSE maths revision lessons delivered by expert maths tutors.

Find out more about our GCSE maths tuition programme.