How to Measure Pupil Attitude and Mindset in Maths
Just like any leadership team in a school, we are constantly monitoring the impact of our one to one interventions. The only difference at Third Space Learning is the scale. Where a school might be looking at the impact of an intervention on 5, 10 or 20 pupils, we will be capturing and analysing data on up to 14,000 pupils each week.
This scale means not only do we have a huge responsibility to make every lesson count in every way we can, but also that we can be quick to identify which lessons work better than others or when children are struggling more than expected, and make the necessary amendments.
We also have a responsibility to report back to our schools on the impact the intervention is having on their pupils. We know that progress made and content secured is an essential part of this process, but it’s not the only thing that matters. Particularly in the current post-lockdown classroom, we know teachers are really keen to see impact on their pupils’ mindset and their attitude to maths. It’s not just about attainment or ‘catching up’, it’s about engagement, helping pupils (re-)learn to love learning, and boosting their confidence too.
That’s why, when we are assessing the success of each pupil’s experience, we don’t just look at their pre and post intervention assessment results. You don’t need us to tell you this is not going to give you the full picture. Instead we use a holistic definition of success which looks at the impact through and on three domains:
- The cognitive domain: pupil attainment and progress through the curriculum
- The meta-cognitive pupils thinking through their own learning
- The affective domain: pupil confidence, enjoyment
We’ve written previously about work we’ve done and our findings on the metacognitive domain teaching primary maths as well as as the cognitive domain. In this post we’ll share what we’ve learnt about how to map changes in the affective domain over time, and the impact this has on learning.
The Primary School Guide to Effective Maths Interventions
Find out how to plan, structure and teach one to one maths lessons to raise attainment in your pupils. Includes a 20 point checklist for improvement.
Download Free Now!What is the affective domain?
To clarify what we mean here first, by affective domain we are referring to a child’s intention, will and attitude towards their maths learning; unsurprisingly there’s a strong overlap here with aspects of Growth Mindset.
It also covers intrinsic motivation as well as self-esteem associated with a child’s belief about their own learning. (The Affective Domain and Mathematics Education, Gregor Lomas, Peter Grootenboer, Catherine Attard, Research in Mathematics Education in Australasia 2008–2011 pp 23-37 )
Observing affective domain in the classroom
As teachers we observe variations in our pupils’ confidence and enjoyment of maths on a daily basis. Some examples may include:
- The pupil who says they don’t like maths;
- The ones who don’t want to try again when a tricky question comes up on a paper;
- And those who simply tell you they’re no good at maths.
You will be well aware of just how much the affective domain can impact on pupil attainment progress in maths.
But how can you measure whether it has changed over time?
And how can you be sure of ways to improve it?
This is where our collection of data from over 890,000 maths lessons since we started tracking this becomes useful. Teaching thousands of pupils one to one maths on a weekly basis gives us a regular opportunity to gather data on pupil confidence, effort, enjoyment and the value they place on maths.
We have collected thousands of answers, and analysed them to provide invaluable insights into this element of maths teaching and learning.
Read more: Tracking pupil progress
How to assess the affective domain
One of the biggest challenges for us initially was working out how to obtain measurements of such ‘fuzzy’ metrics (as a teacher you’ll know how tricky it can be to measure values such as confidence and enjoyment in a quantitative manner.)
Our process was as follows:
- We started by consulting with University College London (UCL).
- We researched a range of different research approaches.
- We ruled out some which would be difficult to implement practically and eventually landed on an educational research questionnaire approached developed in Australia.
- We took this is a starting point then adapted the questions to make them suitable for UK primary school children.
These 4 steps are what we used to decide how we would assess the affective domain of Third Space Learning pupils.
What questions to ask pupils to measure their affective domain?
As we deliver one to one lessons on a weekly basis, usually for a minimum of 12-14 weeks, this gives us a great opportunity to see how pupils affective domain changes across that time period.
To do this we ask every one of our pupils to indicate how much they agree or disagree with 13 key statements at the start and end of all of our intervention programmes.
For each statement the pupil must answer on a scale from Strongly Disagree/Never (1) – Strongly Agree / Always (5). These include statements like “I concentrate hard in maths”, “I like learning new things in maths”, and “If I make a mistake, I work until I have fixed it”.
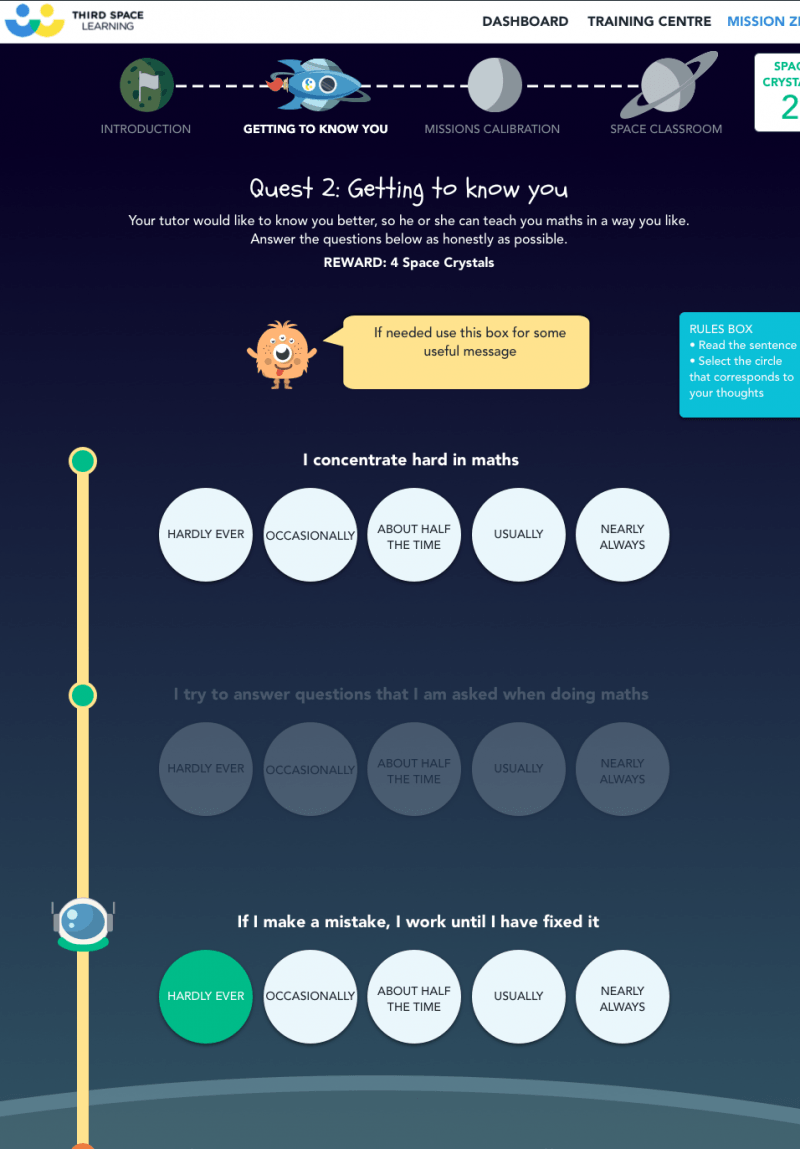
These statements are designed to give us insight into four different aspects of attitude:
- Confidence;
- Enjoyment;
- Effort;
- and Value (the value they put on learning maths).
The statements are aligned with the attitude to which they correspond, giving one four questions and the others three each.
Averaging a pupils’ answers across each aspect gives us an indicative level of that child’s attitude with respect to that aspect.
Visualising pupils’ responses
Once we have pupil responses to all 13 questions we are able to rate them on a scale from low to high in each aspect of the affective domain.
We can then graphically represent this to paint a clearer picture of a child’s self-reported attitude. To do this, we plot the results on a simple spider diagram, as shown below.
If the area is small around the centre the student has reported low attitude values, if it almost fills the chart the child has reported high values and if we see a significant skew in one direction or another the child has reported a significant variation in the different aspects of their own attitudes towards maths.
The example below, shows us one pupil’s attitude before they have started having 1-to-1 lessons with us.
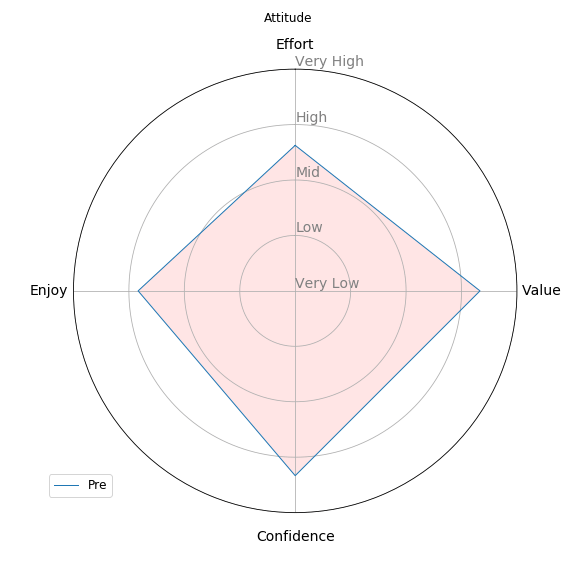
Here you can see that before they started their Third Space sessions, this pupil was quite confident in their maths ability, but the other 3 elements of their affective domain were considerably lower.
What we find on repeating the questions
Once pupils finish their 12-14 weeks of one to one lessons with us, we ask them to respond to the same statements again. We can then repeat the process of plotting the results to show how their attitudes have changed over time.
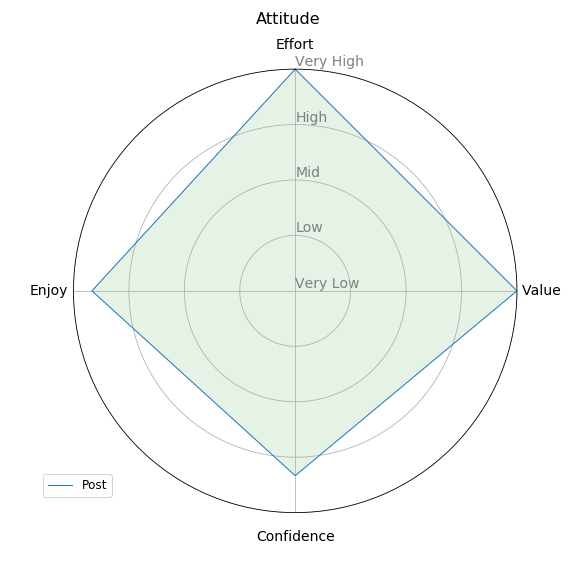
Here you can see that over the course of their Third Space Learning sessions, this pupil’s enjoyment of maths, effort they put into the subject and value they place upon it have all dramatically increased from where they began. You can also see that whilst confidence has not grown, it has remained high.
How we measure our impact with a large number of pupils
As Third Space we are in the unique position of having data from tens of thousands of pupils that we have taught.
We are therefore able to analyse and present data for any individual student, groups of pupils, groups of schools or cohorts of children against an anonymised average of all children we’ve taught (currently around 14,000 per term and growing each term) over the same period of time.
To identify the pupils who have made significant improvements in maths we first need to identify a threshold below which their aspect average is considered low.
This allows us to illustrate how many of those students needed to improve a particular aspect and what the average improvement was.
Effectively, we split pupils into groups:
- Pupils with low confidence;
- Pupils with low effort;
- Pupils with low enjoyment;
- Pupils with low value.
It’s important that we do this so that our figures are not misleading. Without such an approach, those who already have a very high attitude could skew the results as there is nowhere for them to go on our scale, they can only stay at the same level.
How to report on a large amount of pupil data
After splitting our pupils into the four groups mentioned above, we present our results by reporting using the following groups:
- Pre and Post average for all the pupil(s) at a selected school – We do this to see overall average change as a result of Third Space Learning.
- Pre and Post national comparison – We then compare their pre-state with the national average pre-state and their post-state with the national average post-state. This shows how the pupils at the school in question compare to the other 600+ schools we work with before and after the intervention.
- Pupils that have a low attitude score in all 4 aspects – This shows the impact we have had on specific pupils who have self reported one or more aspects as very low at the start of the intervention, and how this has changed after their programme. We do this for each of the four aspects.
The chart below shows the impact we have had on the four aspects of the affective domain based on data from all pupils from this academic year so far. (NB. we are only able to report on this for pupils who answer all the pre and post questions, so the number does not represent the exact number of Third Space pupils.)
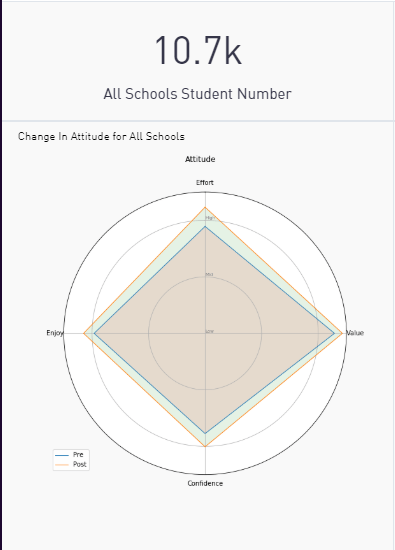
All students, all Schools, 09/09/2018 – 2019-02-28
The blue line shows the average scores pre-intervention.
The orange line the average after the programme, based on responses from over 10,000 pupils.
This shows that overall we are having a positive impact in all areas of the affective domain.
How Third Space Learning Uses Data From Over 890,000 Lessons To Improve Our Teaching At Scale
Having delivered, recorded and analysed over 890,000 primary maths lessons, here at Third Space we are in the unique position of being able to use this huge amount of data to improve our 1-to-1 maths lessons at an unrivalled scale.
By assessing affective domain and gathering pupil generated information on “soft skills” such as effort, confidence, attitude and enjoyment of maths, we are able to adapt our online lessons to help each and every pupil grow their love for maths and increase both confidence and attainment in this subject.
To find out more about how you can use Third Space Learning in your school, book your no commitment 10 minute demo to discover the impact our one to one interventions can have for your pupils – it’s never been easier or more affordable. Call us on 0203 771 0095 or contact us here to learn more about how we can help boost maths attainment and engagement in your school!
Even pupils who begin with high values grow after Third Space Learning sessions
Some primary school pupils do tend to self report high values of attitude even before their one to one lessons, but the exciting conclusion that this visualisation represents, is that even with those high reporters included, we see an average increase, from nearly high to very high.
However, to really see significant meaning, 10,000+ students is too many!
It goes without saying that there is an enormous variety and range of attitudes to maths amongst the thousands of pupils we teach, and these are not visible when you group the results for 10,000 pupils together.
So, we have to break them down into smaller groups.
Getting into the detail of the data – Analysing the progress of a single school
If we look at 11 pupils from one particular school (for the purpose of this blog we will call the school school “A”), we typically see a picture that may be like this:
Pupil Results Pre Third Space Learning vs Post Third Space Learning
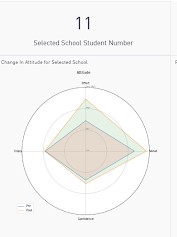
This shows graphic shows where the pupils started on average and where they ended on average, so the impact we have had on the affective domain overall.
In particular, it seems that we have had a significant impact on effort and value, alongside a small but not insignificant impact on confidence.
Pre Third Space Learning sessions for school A vs Pre Third Space Learning sessions for all schools
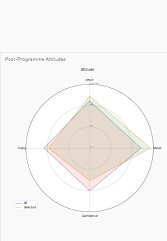
This shows that school A was lower than the national average for both effort and confidence before the intervention.
Post Third Space Learning sessions for school A vs Post Third Space Learning sessions for all schools
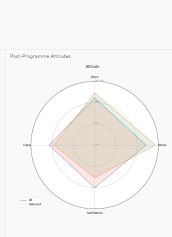
After the Third Space Learning programme we see this school more than closed the gap in terms of effort, now out performing our national school average.
We saw a small improvement on the pupils’ average confidence, enough to start to close the gap.
We also increased the pupils’ perceptions of the value of maths from about national average to considerably above.
The pre & post-intervention pictures and the impact varies from school to school
Clearly the picture is different for each individual school.
This level of insight is really important here as it enables us to cater to the individual needs of each pupil and highlight cohort trends to schools if apparent.
Perhaps a more typical school would have a similar picture to the one below:
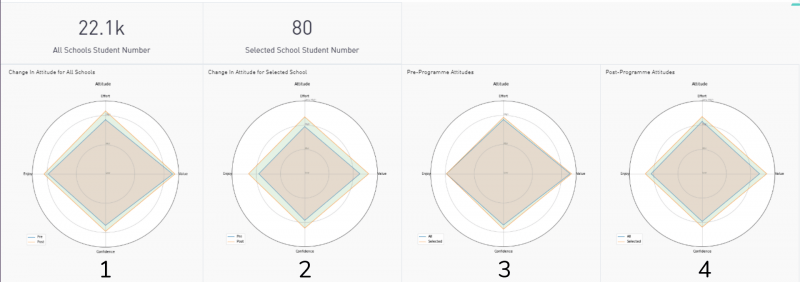
Here we see a large school with 80 primary school pupils signed up to Third Space Learning.
In graphic number 1, we see the national increase from pre to post Third Space session.
Graphic number 2 shows us that these pupils made larger than average progress, relatively equally across all aspects when this school is compared nationally.
Graphic 3 shows us that this schools pre-results were pretty much equivalent to the national average, with slightly higher values in Confidence and Effort.
Graphic 4 demonstrates that we have made more than the average increase with this specific school, as now they are significantly higher than national average at the same stage on all four aspects.
When taking into account the law of diminishing returns this essentially proves we maintained the advantage this school had over the national average by increasing it further, even at very high pre-values.
What about students who start with low attitudes?
One of our key objectives is to help students with a negative attitude towards maths convert to positive, and thereby unlock their potential to become more confident, able and resilient mathematicians.
Whilst we would normally look at these groups from within one school for these purposes, we can display the same information using all Third Space students from this academic year.
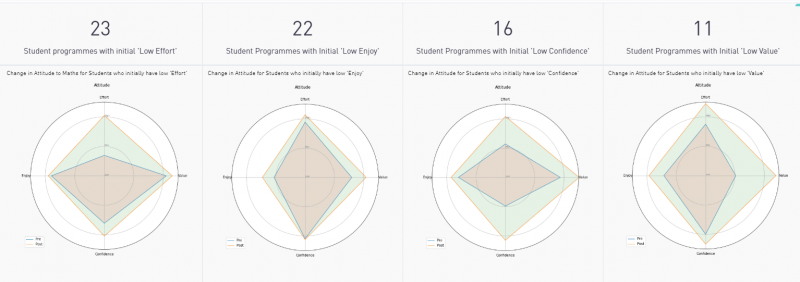
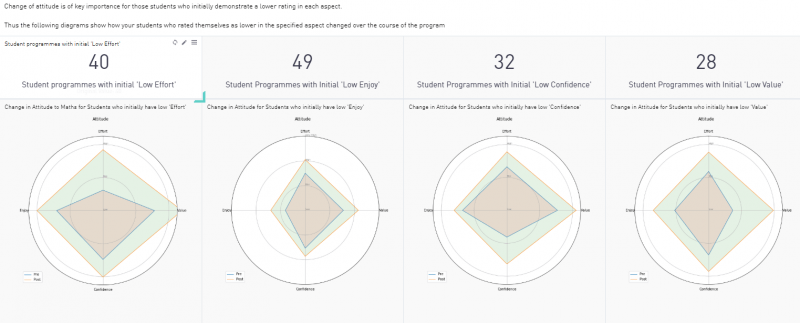
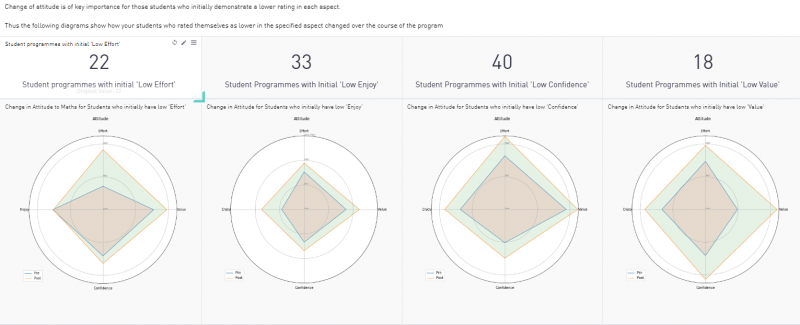
These charts show how many pupils self-reported low attitudes in any of the four aspects and the change in attitudes after the intervention:
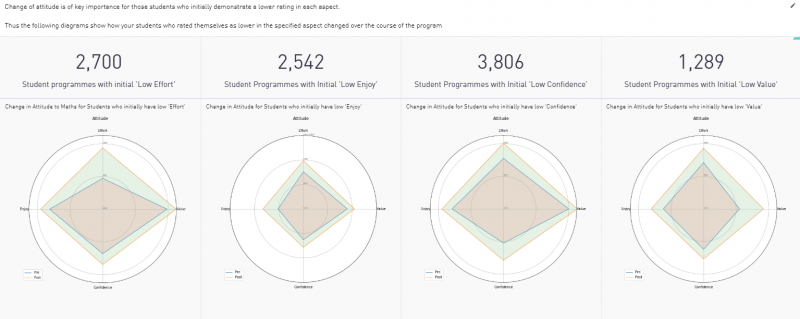
From left to right, the charts represent students with initial: Low Effort, Low Enjoyment of maths, Low Confidence and Low Value (placed on maths).
The orange area with a blue outline represents the values before Third Space sessions, and the green area with the orange outline represents values after Third Space sessions.
The largest improvement is for those who started with low attitude scores in Effort
These pupils were those who strongly disagree or disagree with statements such as “If I can’t do a maths problem, I keep trying different ways”.
This impact is really great to see and is allies to much of the tenets of developing a Growth Mindset, which has been shown to have a positive impact on educational outcomes.
Another takeaway from this view is that the attitude aspect with the most pupils initially scoring low is confidence.
Again, for these pupils with low confidence, the results show a significant increase after the intervention. This is in line with and backs up much of the qualitative feedback that we receive from teachers about their pupils using the intervention such as:
“The children enjoy their sessions and the impact on confidence- seen in class- is excellent.”
and
“The children respond really well to Third space. As a school we see impact not just in the learning of the session and overtime but in the enjoyment, confidence and love of Maths.”
Exploring our impact at a school level
Once we’ve looked at these groups across all our thousands of pupils, we can dive deeper into the data and explore it at a school level.
Each of the rows of visualisations below represents a different school.
Example School 1
Example School 2
Example School 3
The variety shows how attitudes and the areas where we make the most impact varies from school to school. This is what we would expect to see as we work with such a wide range of different pupils and schools across the UK.
Diving down another level to take a look at individual pupils
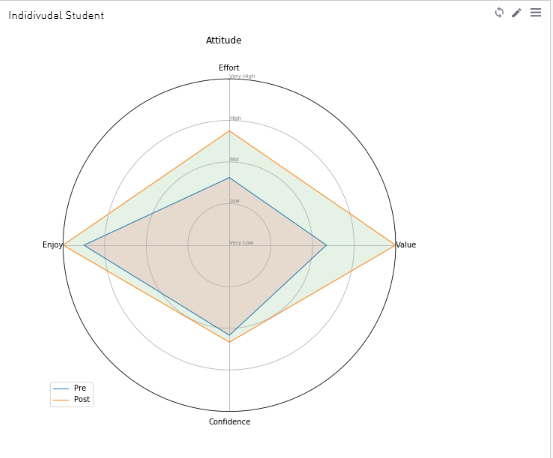
As long as we have pre-intervention and post-intervention response from a pupil, we can look at our impact on an individual pupil level.
The example below shows that for this pupil, whilst Confidence only increased a little, we managed to max out the Value and Enjoyment ratings from medium and high respectively to both Very High (5/5 of the 6 relevant questions!).
This demonstrates the inter-play between these aspects, which shouldn’t be considered as separate but rather allow us to ‘paint’ the particular combination that best represents that students self perception across these four aspects.
For example:
“Do we measure what we treasure?”
Recently, at the headteacher’s roundtable in Birmingham, one of the speakers asked this question, which we loved.
We feel this perfectly captures the importance of reviewing the assessment and data collection we’re doing and evaluating the purpose it serves.
Is it ultimately benefiting our pupils?
And are we measuring the really important things? Not just attainment against arbitrary levels.
At Third Space we strongly believe in not collecting data for data’s sake – the real benefit for us in being able to capture this is to share it with our tutors to help them personalise their teaching during the intervention, and to share with our schools to help further inform planning and teaching.
We are therefore delighted to be able to share this insight about the work we’ve been doing in this area, especially as it enables us to more clearly demonstrate the impact we have on these “softer skills”, which in turn can help boost attainment and progress. There is a lot of value in assessing affective domain, and this is what we have set out to prove.
Read more: KS1 Assessment Framework
What are the next steps?
We value the impact that we have in this area as much as we value our impact on attainment and we know it’s a core benefit for the schools we work with.
For this reason, our next steps will be to work on how we can make these insights even more accessible to our intervention schools.
Over time, as we continue feeding back into our teaching guidance, tutor training and school reports, we will hope to see the average impact on the affective domain increase even further.
How technology has helped us assess affective domain, and how it can help your school too
Third Space Learning is an education company at its core, with our overarching mission being to close the attainment gap, but technology enables to do things we wouldn’t be able to otherwise.
In this case, measuring mindset is possible thanks to the fact that our online lessons mean we can reach thousands of pupils online and measure their attitudes to maths at different points throughout the term.
With growing insight and the ability to carry out such research at scale, Third Space Learning hopes to bring to light the value of children in KS2 having a positive outlook on maths, increasing their confidence in maths, and the benefits for long-term success this can have.
Related articles:
DO YOU HAVE STUDENTS WHO NEED MORE SUPPORT IN MATHS?
Every week Third Space Learning’s maths specialist tutors support thousands of students across hundreds of schools with weekly maths intervention programmes designed to plug gaps and boost progress.
Since 2013 these personalised one to one lessons have helped over 169,000 primary and secondary students become more confident, able mathematicians.
Learn about the diagnostic assessment or request a personalised quote for your school to speak to us about your school’s needs and how we can help.
