GCSE Tutoring Programme
Our chosen students improved 1.19 of a grade on average - 0.45 more than those who didn't have the tutoring.
This topic is relevant for:

Probability – Maths GCSE
Here we will learn about probability, including calculating probability, probability distributions and probability diagrams.
You can also download the following free probability maths resources all suitable for those following Edexcel, AQA or OCR exam boards:
What is probability?
Probability is a measure of how likely something is to happen. You can represent probabilities using fractions, decimals or percentages.
The probability of something happening will lie between 0 and 1 or 0\% and 100\%.
The lower the probability the less chance of that event happening.
The higher the probability the more chance of that event happening.
If something has a probability of \bf{0} then it is impossible and if something has a probability of \bf{1} then it is certain.
We use the notation P(event) to represent the probability of an event happening.
For example, if you wanted to write the probability of getting a 1 you could write P(1).
In this page we will link to lots of other pages that will help with a variety of probability topics that are examined in both foundation and higher GCSE.
What is probability?
Describing probability
You can describe probability in different ways. Including,
- Probability scale
- Probability notation
- Probability symbols
Step-by-step guide: Describing probability (coming soon)
- Probability scale
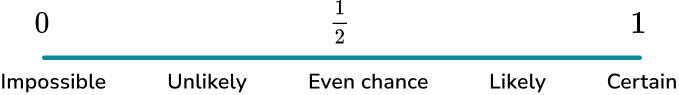
The probability scale is a number line from 0 to 1 where you can place the probability of events occurring. Events can range from ‘impossible’ to ‘certain’.
To do this you need to be able to identify decimals and fractions on the number line from 0 to 1 and calculate the probability of events happening or not happening.
Step-by-step guide: Probability scale (coming soon)
- Probability notation and symbols
Probability notation is an efficient way of writing the probability of events happening or not happening.
To do this we use set notation, which is also used when working with Venn diagrams. Events are usually notated using capital letters and there is the use of some greek letters.
| P(A) | Event A | The probability of event A happening. |
| P(A’) | Complement | The probability of event A not happening. |
| P(A \cup B) | Union | The probability of event A or B happening. |
| P(A \cap B) | Intersection | The probability of event A and B happening. |
Step-by-step guide: Probability notation
Step-by-step guide: Probability symbol
Probability distribution
Probability distributions are a summary of the probabilities of all possible outcomes of an experiment or situation.
In GCSE mathematics they are usually described using a table.
For example,
This table shows the theoretical probability distribution for a fair 5 -sided spinner.
| Number | 1 | 2 | 3 | 4 | 5 |
|---|---|---|---|---|---|
| Probability | 0.2 | 0.2 | 0.2 | 0.2 | 0.2 |
As the spinner is fair, the probability of landing on each value is the same.
This table shows the probability distribution for a 4 -sided spinner, obtained from an experiment.
| Colour | Red | Blue | Green | Yellow |
|---|---|---|---|---|
| Probability | 0.3 | 0.35 | 0.15 | 0.2 |
The probability found from an experiment is referred to as a relative frequency.
Step-by-step guide: Probability distribution
Estimate of probability
As seen above, probabilities can be estimated using information collected from experiments or surveys. The probabilities of events will be the relative frequency of each event occurring.
Relative frequency is the number of times an event happens divided by the total number of outcomes that took place in an experiment, known as the number of trials.
To calculate the relative frequency you can use the formula
\text{Relative frequency} = \frac{\text{frequency of the event occurring}}{\text{total number of trials of the experiment.}}
Step-by-step guide: Relative frequency
Probability calculation
To find the probability of an event happening we use the formula,
\text{Probability}=\frac{\text{number of desired outcomes}}{\text{total number of outcomes}}.
For example,
Let’s look at the probability of getting an even number when a die is rolled.
The desired outcome is getting an even number. There are 3 even numbers on a die.
The total number of possible outcomes is 6 since there are 6 numbers on a die.
The probability of getting an even number =\frac{\text{number of desired outcomes}}{\text{total number of outcomes}}=\frac{3}{6}.
Step-by-step guide: How to calculate probability
Probability maths worksheets
12 probability worksheets ready to download and give to your GCSE students. Each with functional and applied reasoning questions and exam style questions.
DOWNLOAD FREE Probability maths worksheets
12 probability worksheets ready to download and give to your GCSE students. Each with functional and applied reasoning questions and exam style questions.
DOWNLOAD FREEProbability definitions and rules
There are some important terms and rules you need to know when working with probability,
- Mutually exclusive events – events that cannot happen at the same time.
For example, rolling a 4 and a 5 on a die. - Independent events – the outcome of two or more events have no effect on the outcome of the other events.
For example, rolling a 6 on one roll of a die and rolling a 1 on the next roll. - Exhaustive events – events that cover every possible outcome.
For example, rolling an even number or rolling an odd number on a die.
Step-by-step guide: Mutually exclusive events (coming soon)
Step-by-step guide: Independent events
Calculation with the laws of probability
Some useful probability rules to help us perform calculations with probabilities are:
- The sum of the probabilities of exhaustive events is always \bf{1} .
- P(A’) = 1-P(A) .
- For mutually exclusive events, P(A or B)=P(A) + P(B) .
- For independent events P(A AND B) = P(A) x P(B).
For example,
- If the probability of winning a football match is 0.3 and the probability of drawing the football match is 0.45, the probability of losing the football match is 0.25.
0.3 + 0.45 + 0.25 = 1 - If the probability of it raining is 0.2, the probability of it not raining is 1 - 0.2 = 0.8.
- The probability of rolling an odd number or rolling a 2 on a fair six sided die is \frac{3}{6}+\frac{1}{6}=\frac{4}{6}.
- The probability of rolling a 4 on a fair six sided die and a fair coin landing heads is \frac{1}{6}\times \frac{1}{2}=\frac{1}{12}.
Equally likely outcomes and probability
If all of the outcomes from a situation have an equal chance of occurring, the probabilities will all be the same.
For example,
A fair six sided die is rolled. The outcomes are 1, 2, 3, 4, 5 and 6 and because the die is fair, each of these outcomes are equally likely.
The probability of each of these outcomes is \frac{1}{6}.
Probability of equally likely events
Events can be different to outcomes.
For example,
The outcomes of a fair six sided die are 1, 2, 3, 4, 5 and 6.
Rolling a 1 is an event but so is rolling an even number.
Rolling an even number is as equally likely as rolling an odd number. These are known as equally likely events.
Combined events probability
Combined events in probability are events that occur at the same time or in succession. You can calculate the likelihood of a certain combination of outcomes.
To do this you can use the AND probability rule. This rule states that the probability of outcome A occurring from one event AND outcome B occurring from a second event is the probability of outcome A multiplied by the probability of outcome B.
P(A AND B) = P(A) x P(B)
For example,
To find the probability of rolling a 2 on a fair die and drawing a heart from a deck of playing cards we can use the AND rule.
The probability of rolling a two on a six-sided die is \frac{1}{6}.
The probability of drawing a heart from a deck of cards is \frac{1}{4}.
The probability of rolling a two AND drawing a heart is therefore \frac{1}{6} \times \frac{1}{4}=\frac{1}{24}.
Step-by-step guide: Combined events probability
Probability tree diagram
Probability tree diagrams are a way of organising the information of two or more probability events. Probability tree diagrams show all the possible outcomes and can then be used to solve probability questions.
For example,
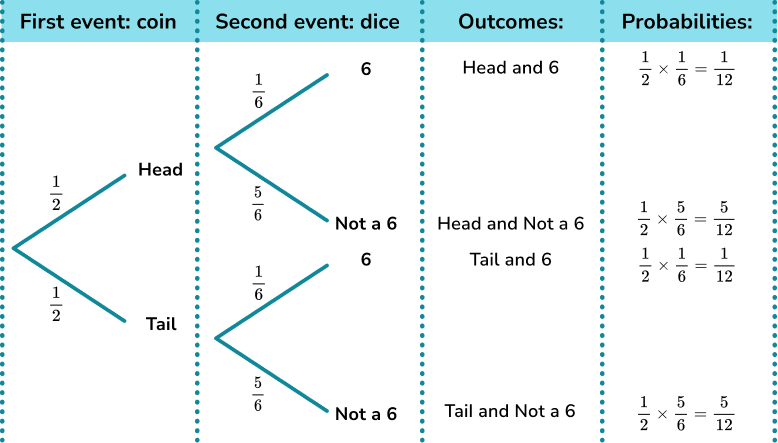
A coin is flipped and a dice is rolled.
What is the probability of getting a ‘tail’ and a ‘6’?
Here is the tree diagram which also includes the different outcomes and their probabilities,
Tree diagrams can also be used to help solve conditional probability problems.
Step-by-step guide: Probability tree diagram
Frequency trees
Frequency trees are a way of organising information. They can then be used to solve probability problems.
Frequency trees look like probability tree diagrams, but frequencies are used.
For example,
A class has 30 children.
There are 16 boys.
4 boys and 5 girls walk to school.
A child is picked at random. What is the probability that they are a girl who does not walk to school?
Here is a frequency tree to show the information.
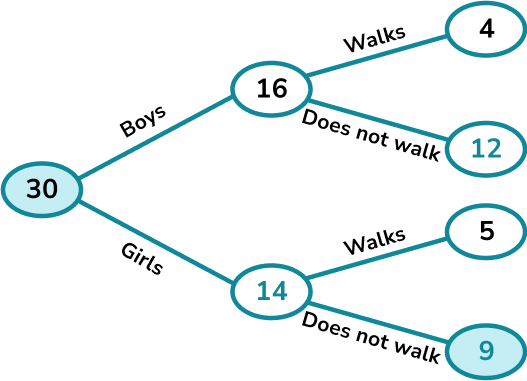
The probability of picking a girl who does not walk to school is \frac{9}{30}. (This cancels to \frac{3}{10} ).
Frequency trees can also be used to help solve conditional probability problems.
Step-by-step guide: Frequency trees
Venn diagram
A Venn diagram is a diagrammatic representation of two or more sets.
For example,
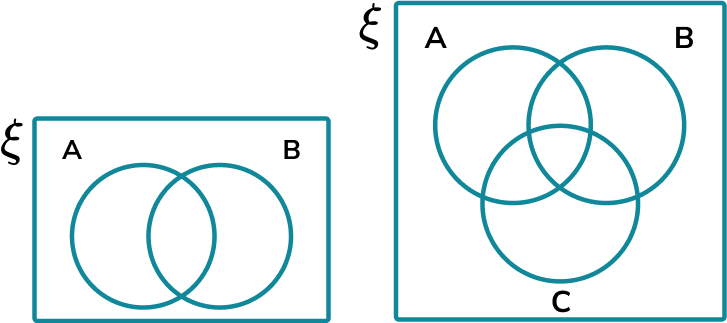
Above are examples of a two set and a three set Venn diagram with the following features:
- The universal set is a rectangle outlining the space in which all values within the smaller sets are found. The universal set is denoted using the symbol \xi.
- The set A, shown using a circle and labelled A.
- The set B, shown using a circle and labelled B.
- The set C, shown using a circle and labelled C (Three set Venn diagram).
- Set A and set B (and set C) overlap, describing how items in set A can also be in set B. This is called the intersection.
Venn diagrams can also be used to help solve conditional probability problems.
Step-by-step guide: Venn diagram
Two way tables
Two way tables are a type of frequency table used for organising data. They are also known as contingency tables.
Two way tables are mostly used for categorical data, though they can be used for numerical data too. Categorical data is data where the items are words rather than numbers such as – colours, sports, car manufacturers.
For example,
This two way table shows a data set about what students eat for lunch. One categorical variable is the gender of the child, the other categorical variable is what type of lunch they have.
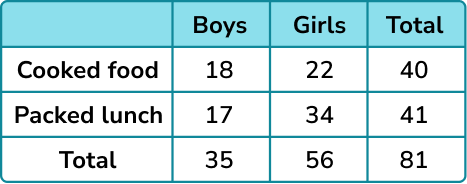
There are row and column totals. So we can see that there are 35 boys and that 41 students have packed lunch. The total number of students in the table is 81.
Sample space diagrams are also a type of two way table.
Step-by-step guide: Two way tables (coming soon)
Did you know?
There have been some great mathematicians who have contributed to probability theory.
Look them up and see what you can find out about them
- Andrey Kolmogorov
- Jacob Bernoulli
- Andrey Markov
And there are many more!
Common misconceptions
- Writing probabilities as a ratio or in words
Probabilities must be written as a fraction, decimal or percentage. The chance of rolling a 1 on a fair six-sided dice is \frac{1}{6}. This cannot be written as a ratio, 1:6, or in words, as ‘1 in 6’ or ‘1 out of 6’.
- Probabilities greater than \bf{1}
The probabilities of all outcomes of an event will always add up to one.
Therefore a probability as a decimal cannot be greater than 1 or a fraction cannot be improper.
For example, 1.4 or \frac{6}{5} cannot be probabilities.
- Adding probabilities instead of multiplying them
For independent events P(A and B) = P(A) \times (P(B).
For mutually exclusive events P(A or B) = P(A) + P(B).
- Multiplying or dividing fractions incorrectly
To multiply fractions, multiply the numerators and multiply the denominators.
To divide fractions, turn the second one upside down and multiply.
- Adding fractions incorrectly
Remember, fractions can only be added or subtracted if they have a common denominator.
Practice probability questions
1. A bag contains three blue counters, four red counters, two green counters and a yellow counter. Calculate the probability of picking a blue counter.


There are ten counters and three of them are blue.
\frac{3}{10}=0.3
2. A fair six sided dice is rolled.
Event A is the dice landing on an even number.
Event B is the dice landing on ‘1’.
Calculate P(A \cup B).
There are three even numbers and one ‘1’. Therefore there are 4 possible outcomes that satisfy event A or event B. There are 6 possible outcomes. Calculate the joint probabilities of these events.
\frac{3}{6} + \frac{1}{6} = \frac{4}{6}
3. \xi = \{1, 2, 3, 4, 5, 6, 7, 8, 9, 10, 11, 12, 13, 14, 15\}
A = \{ multiples of 3\} and B = \{ odd numbers \}.
A number is selected at random. Find P(A \cap B).
You could use a Venn diagram to help here.
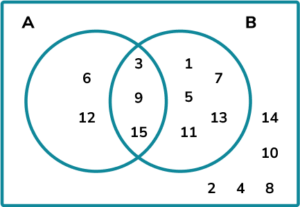
\left( A\cap B \right) = \{3,9,15\}
Therefore P ( A\cap B) = \frac{3}{15}.
4. A bag contains only blue, yellow and green counters.
The probability of selecting a blue counter is 0.4. The number of yellow counters is 3 times the number of green counters.
Which is the correct probability distribution for the counters in the bag?
| Colour | Blue | Yellow | Green |
| Probability | 0.4 | 0.45 | 0.15 |
| Colour | Blue | Yellow | Green |
| Probability | 0.4 | 0.4 | 0.4 |
| Colour | Blue | Yellow | Green |
| Probability | 0.4 | 0.15 | 0.45 |
| Colour | Blue | Yellow | Green |
| Probability | 0.4 | 0.3 | 0.3 |
0.6 \div 4 = 0.15
\text{P(Green)}=0.15
\text{P(Yellow)}=3\times 0.15=0.45
5. Rachel has 9 balls in a bag. 4 of the balls are blue and the other 5 are red. Rachel picks one ball, notes its colour and replaces the ball. She then picks a second ball. Find the probability the two balls she picks are the same colour.
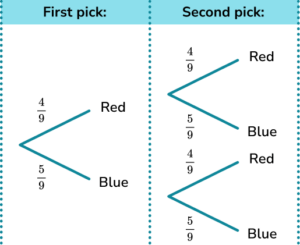
Rachel can pick two red balls or two blue balls.
\text{P(red and red)}=\frac{4}{9} \times \frac{4}{9}=\frac{16}{81}
\text{P(blue and blue)}=\frac{5}{9} \times \frac{5}{9}=\frac{25}{81}
\text{P(same colour)}=\frac{16}{81}+\frac{25}{81}=\frac{41}{81}
The total probability is \frac{41}{81} .
6. 40 people were asked if they ate meat or were vegetarian / vegan.
25 women were asked and 10 of them did not eat meat.
13 men ate meat.
One person is chosen at random. Calculate the probability the person is male and does not eat meat.
You could use a two way table or frequency tree to help with this one.
The values you have been given are,
| Women | Men | Total | |
| Eat meat | 13 | ||
| Vegetarian / vegan | 10 | ||
| Total | 25 | 40 |
Filling in the other values into the two way table you have,
| Women | Men | Total | |
| Eat meat | 15 | 13 | 28 |
| Vegetarian / vegan | 10 | 2 | 12 |
| Total | 25 | 15 | 40 |
The number of males who do not eat meat is 2.
The total number of people is 40.
\text{P(Male who is Vegetarian / vegan)} = \frac{2}{40}
Probability GCSE questions
1. A weather forecast says,
The probability that it will rain on Saturday is 0.6 .
The probability that it will rain on Sunday is 0.3 .
(a) Calculate the probability it will rain on Saturday and Sunday.
(b) Calculate the probability it will rain on just one of the days.
(4 marks)
(a)
Probability that it will rain on Saturday AND rain on Sunday = 0.6 \times 0.3 = 0.18.
(1)
(b)
Probability that it will not rain on Saturday = 1–0.6=0.4.
Probability that it will not rain on Sunday = 1–0.3=0.7.
(1)
Probability that it will rain on Saturday AND not rain on Sunday = 0.6 \times 0.7 = 0.42.
Probability that it will not rain on Saturday AND rain on Sunday = 0.4 \times 0.3 = 0.12.
(1)
Probability that it will rain on Saturday OR rain on Sunday = 0.42 + 0.12 = 0.54 .
(1)
2. Cards numbered 1 to 80 are shuffled and one is selected at random.
If A = \{ square numbers \} and B = \{ cube numbers \}.
(a) Write down the numbers in each of the sets A and B.
A card is drawn at random.
(b) Find P\left( A\cup B \right) .
(c) Find P\left( A\cap B \right) .
(5 marks)
(a)
Correct list of square numbers, A = \{1,4,9,16,25,36,49,64\}.
(1)
Correct list of cube numbers, B = \{1,8,27,64\}.
(1)
(b)
Total number of square and cube numbers = 10.
(1)
\frac{10}{80} or equivalent.
(1)
(c)
1 and 64 are in A \cap B.
(1)
Therefore P(A \cap B) = \frac{2}{100}.
(1)
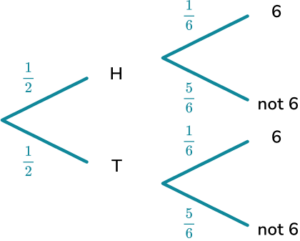
3. A fair coin is flipped and a fair 6 -sided die is rolled.
(a) Complete the tree diagram for flipping the coin and rolling the die.
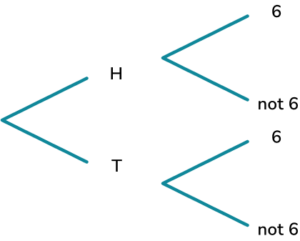
(b) Calculate the probability of the coin landing on tails and the die not landing on a 6.
(4 marks)
(a)
Probabilities correct for the coin.
(1)
Probabilities correct for the die.
(1)
(b)
Attempt to multiply the correct fractions.
(1)
\frac{1}{2} \times \frac{5}{6} = \frac{5}{12}(1)
The most popular lessons are
Still stuck?
Prepare your KS4 students for maths GCSEs success with Third Space Learning. Weekly online one to one GCSE maths revision lessons delivered by expert maths tutors.

Find out more about our GCSE maths tuition programme.