GCSE Tutoring Programme
Our chosen students improved 1.19 of a grade on average - 0.45 more than those who didn't have the tutoring.
In order to access this I need to be confident with:
Arithmetic Decimals Improper fractions and mixed numbers Negative numbers Fractions, decimals and percentages RatioThis topic is relevant for:

Frequency Trees
Here we will learn about frequency trees, including what a frequency tree is, how to complete a frequency tree, and how to use a frequency tree to answer probability questions.
You can also download the following free frequency trees resources all suitable for those following Edexcel, AQA or OCR exam boards:
What are frequency trees?
Frequency trees are a way of organising information. They can then be used to solve probability problems.
To do this we start with the total number of items and then split these items into 2 or more categories, writing down the frequency of items in each category. These are then split into further categories and, again, we write down the frequency in each of these categories.
Frequency trees look like probability tree diagrams, but frequencies are used instead of probabilities.
For example,
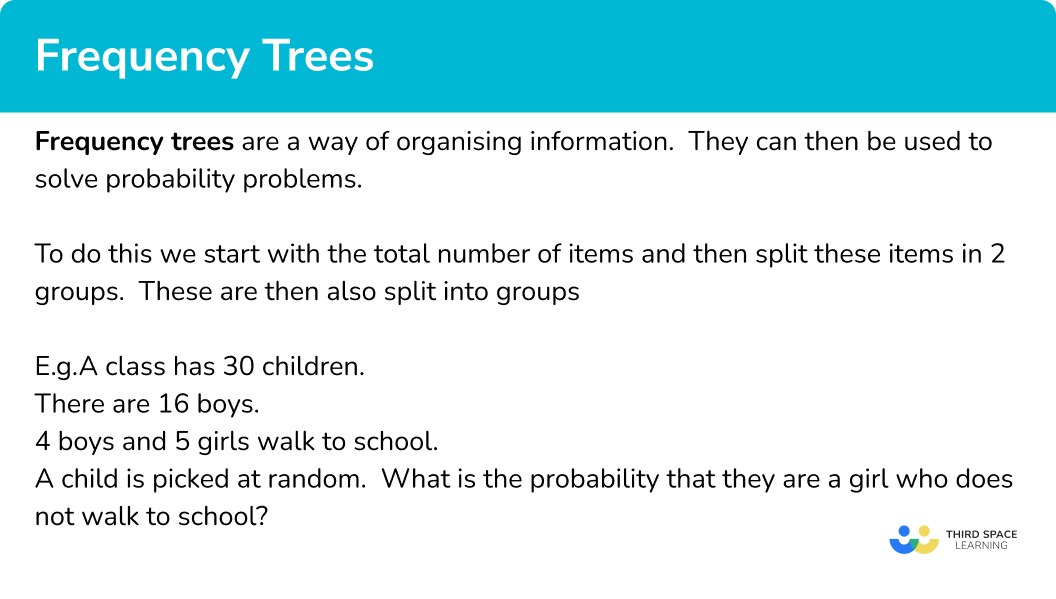
A class has 30 children.
There are 16 boys.
4 boys and 5 girls walk to school.
A child is picked at random. What is the probability that the child is a girl who does not walk to school?
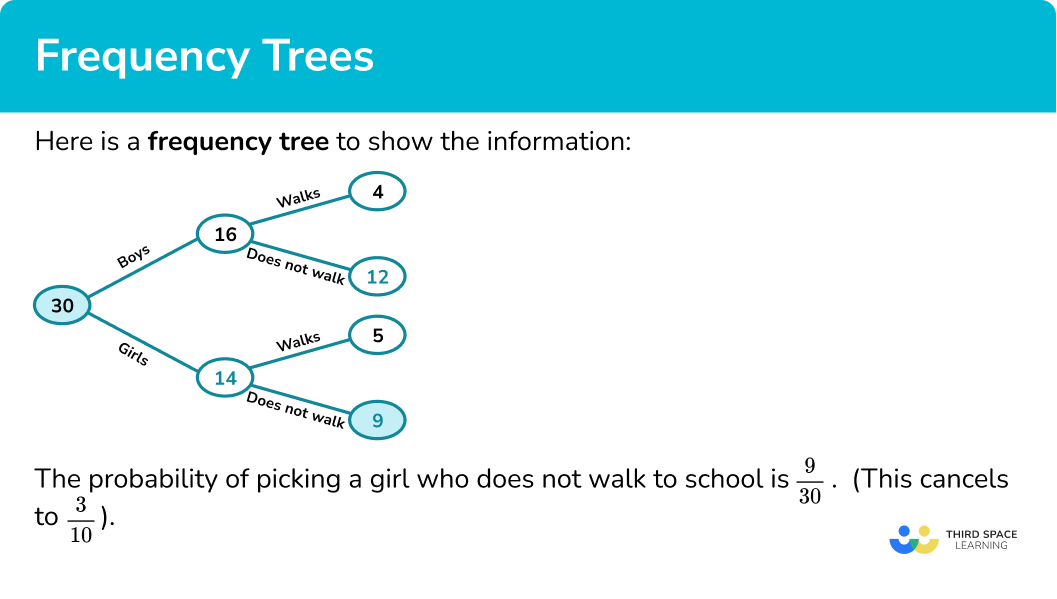
Here is a frequency tree to show the information.
We can work out the missing values using the information we have been given.
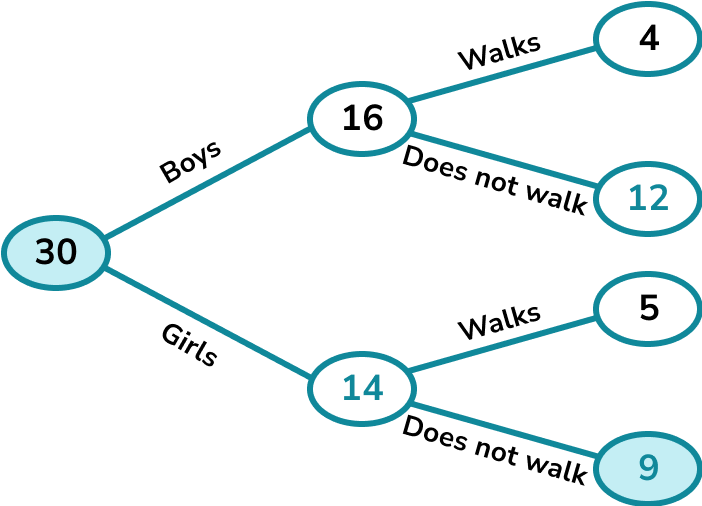
The probability of picking a girl who does not walk to school is \frac{9}{30}. (This cancels to \frac{3}{10}).
What are frequency trees?
What are frequency trees?
How to use a frequency tree
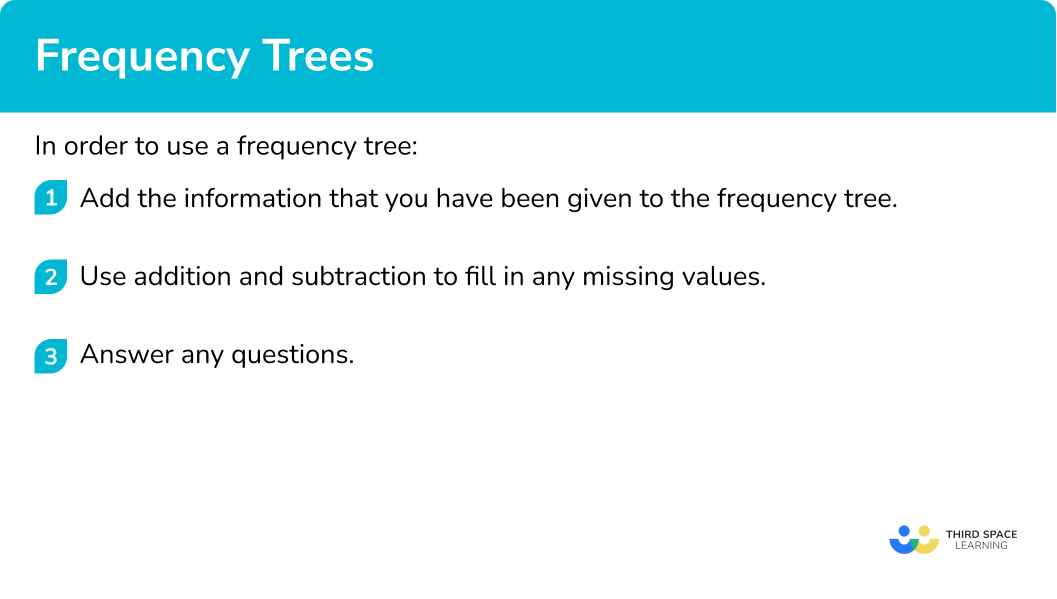
In order to use a frequency tree:
- Add the information that you have been given to the frequency tree.
- Use addition and subtraction to fill in any missing values.
- Answer any questions.
Explain how to use a frequency tree
Frequency trees worksheet
Get your free frequency trees worksheet of 20+ questions and answers. Includes reasoning and applied questions.
DOWNLOAD FREE Frequency trees worksheet
Get your free frequency trees worksheet of 20+ questions and answers. Includes reasoning and applied questions.
DOWNLOAD FREEFrequency trees examples
Example 1: completing a frequency tree
A class has 32 children.
There are 15 boys.
6 boys and 8 girls like tennis.
Complete the frequency tree diagram.
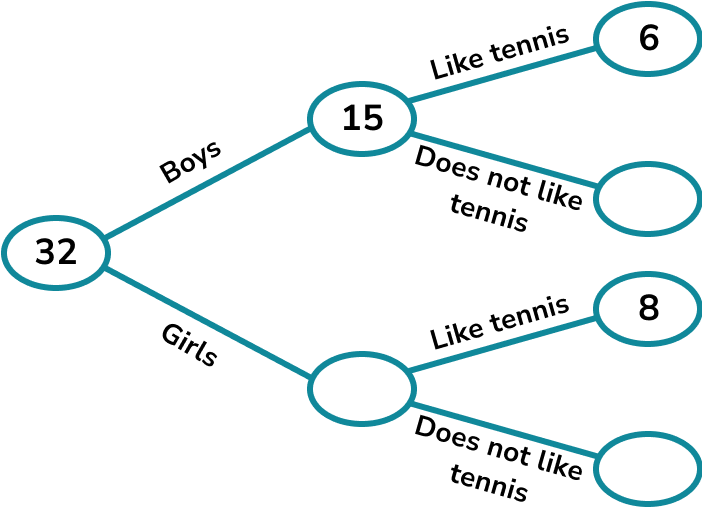
A child is picked at random. What is the probability that the child is a boy who doesn’t like tennis?
- Add the information that you have been given to the frequency tree.
In this case we are given the frequency tree with the initial information included.
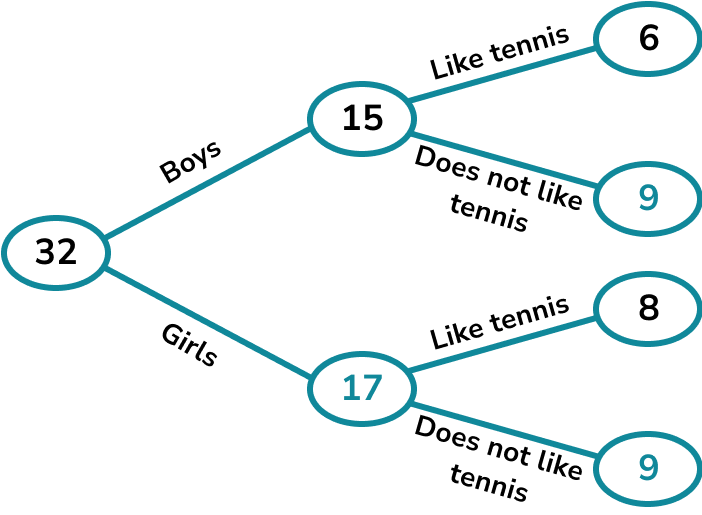
2Use addition and subtraction to fill in any missing values.
We can fill in the number of girls.
32-15=17
We can then find the number of boys who do not like tennis.
15-6=9
Finally we can find the number of girls who do not like tennis.
17-8=9
3Answer any questions.
We can see that 9 boys do not like tennis and we know that there are 32 children altogether.
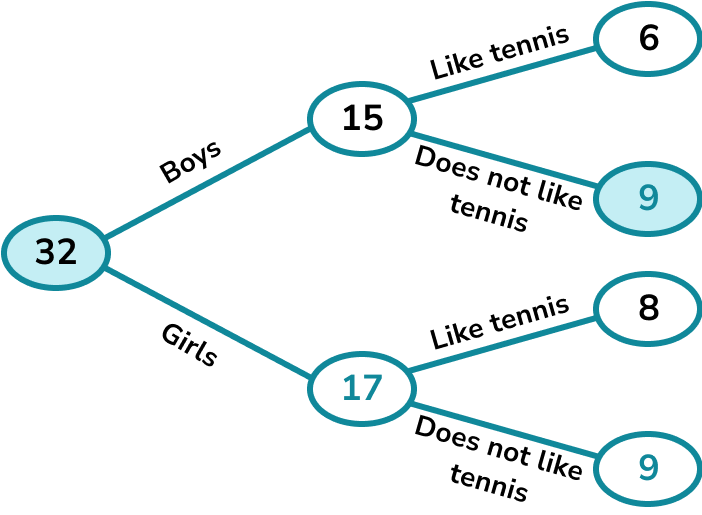
The probability that a child picked at random is a boy who does not like tennis is \frac{9}{32}.
Example 2: completing a frequency tree
An office has 40 workers.
There are 19 females.
14 males and 11 females like coffee.
Complete the frequency tree diagram.
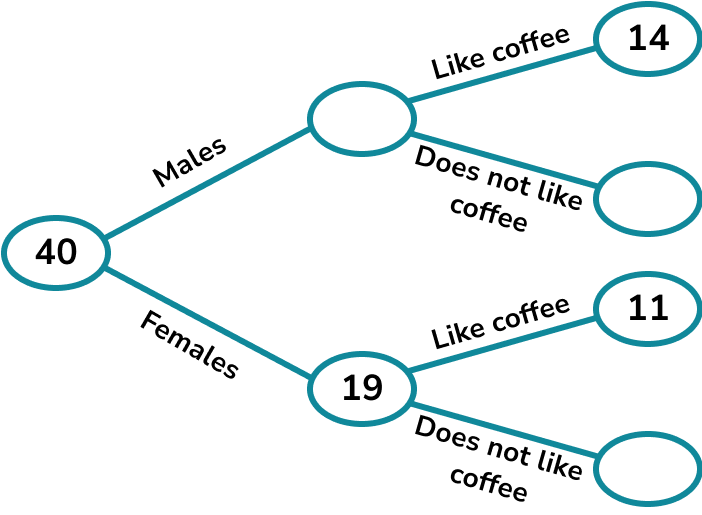
A worker is picked at random. What is the probability that the worker is a female who does not like coffee?
In this case we are given the frequency tree with the initial information included.
We can fill in the number of males.
40-19=21
We can then find the number of males who do not like coffee.
21-14=7
Finally we can find the number of females who do not like coffee.
19-11=8
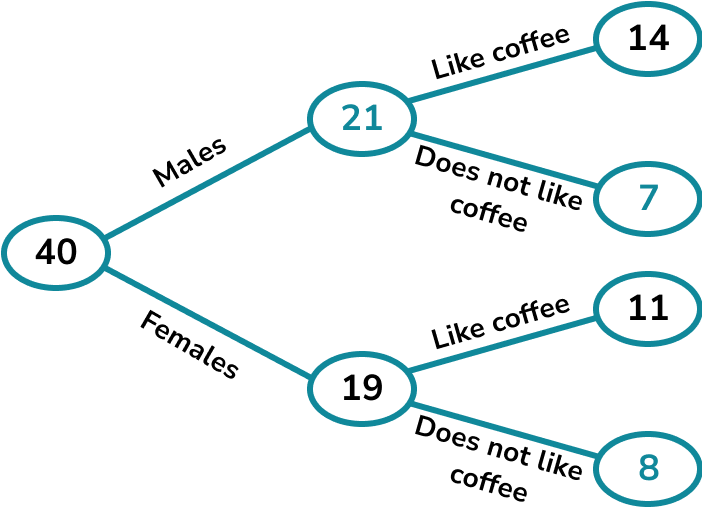
We can see that 8 females do not like coffee and that there are 40 workers altogether.
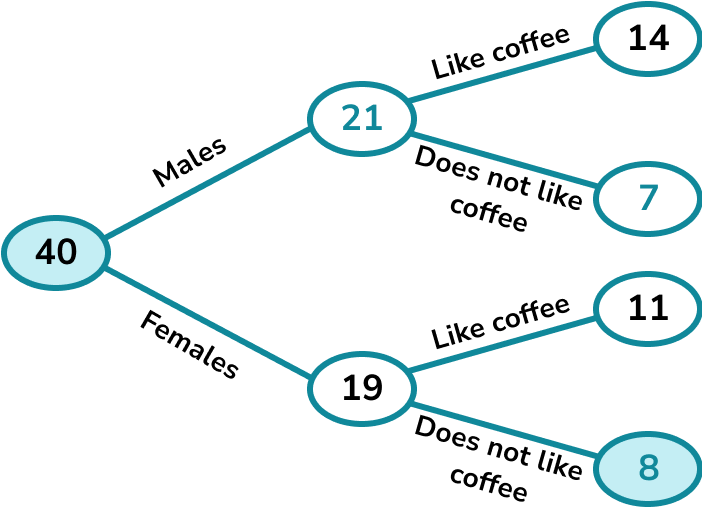
The probability that a worker picked at random is a female who does not like coffee is \frac{8}{40}.
This cancels to \frac{1}{5}.
Example 3: completing a frequency tree
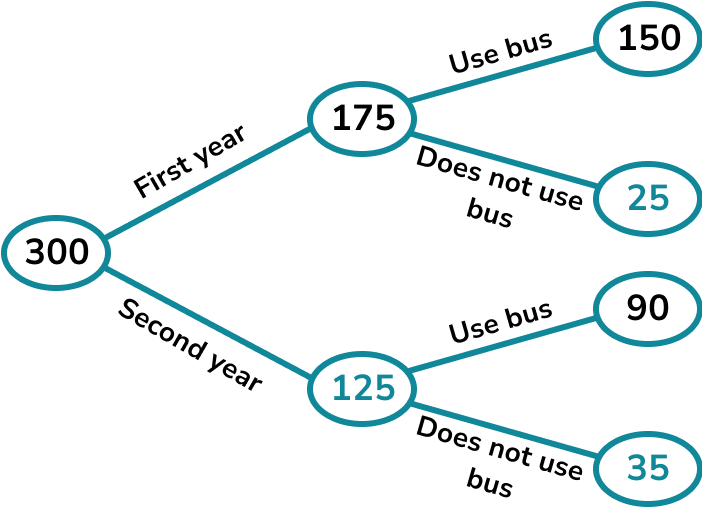
A sixth-form college has 300 learners.
There are 175 in the first year.
150 learners in the first year and 90 learners in the second year arrive by bus.
Complete the frequency tree diagram.
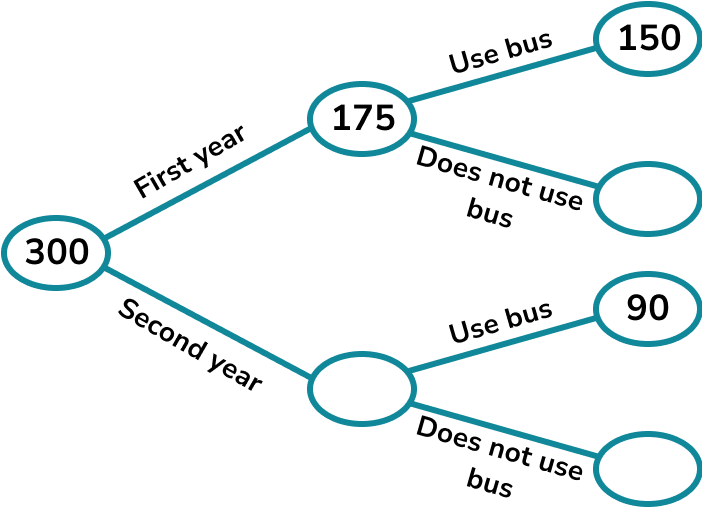
A second year learner is picked at random. What is the probability that the learner does not use the bus?
In this case we are given the frequency tree with the initial information included.
We can fill in the number of second year learners.
300-175=125
We can then find the number of first years who do not use the bus.
175-150=25
Finally we can find the number of second years who do not use the bus.
125-90=35
We can see that 35 second year learners do not use the bus. In this question we know that a second year learner was chosen so we don’t include the first year learners when writing the probability. There are 125 second year learners to choose from.
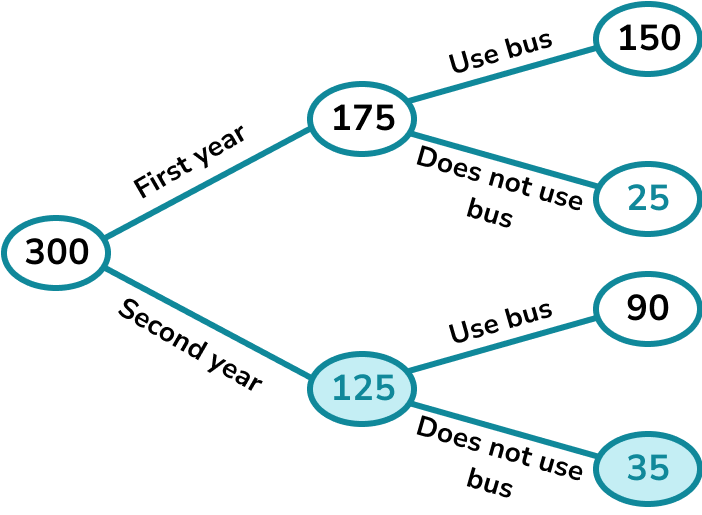
The probability that a second year learner picked at random does not use the bus is \frac{35}{125}.
This cancels to \frac{7}{25}.
Example 4: fill in a frequency tree
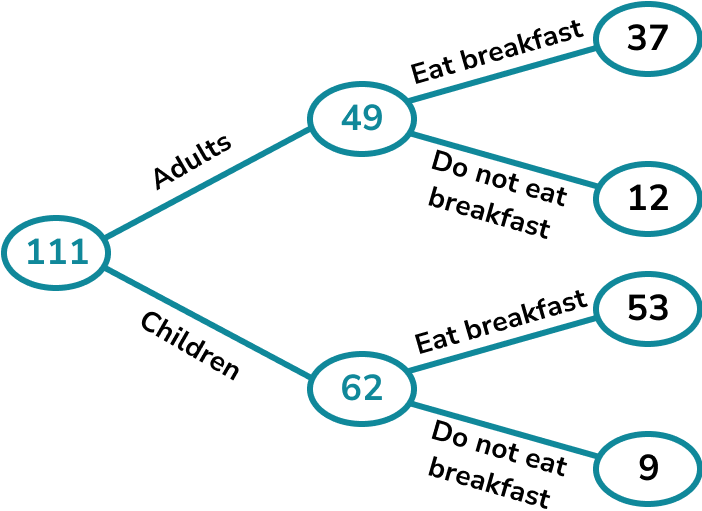
37 adults eat breakfast and 12 adults do not eat breakfast.
53 children eat breakfast and 9 children do not eat breakfast.
Complete the frequency tree.
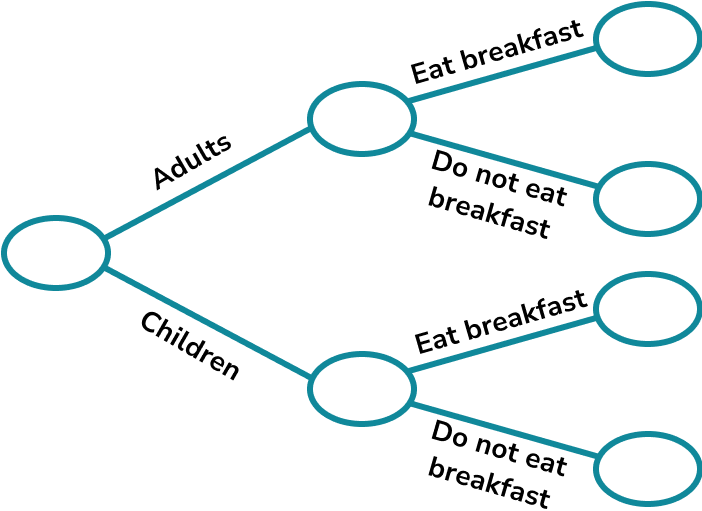
A person is chosen at random. What is the probability that they do not eat breakfast?
We can fill in the numbers we were given in the initial information.
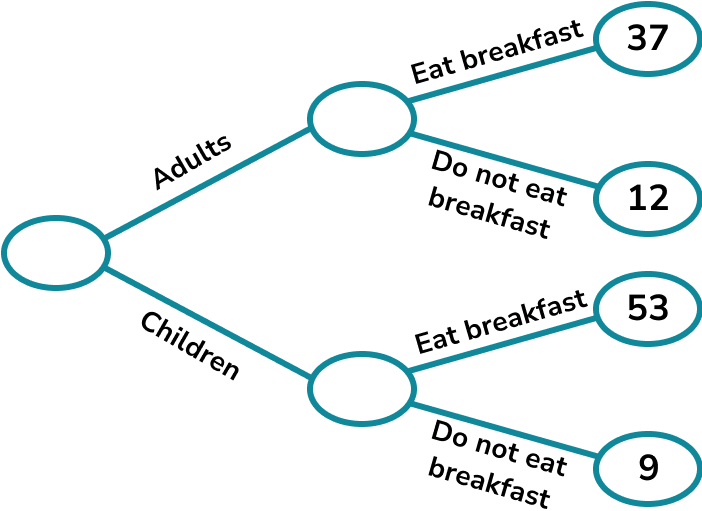
We can find the number of adults,
37+12=49.
We can then find the number of children,
53+9=62.
Finally we can find the total number of people,
49+62=111.
This question asks for the probability that a chosen person does not eat breakfast.
We need to include everyone who does not eat breakfast in the probability. There are 12 adults and 9 children who do not eat breakfast, which is 21 people altogether.
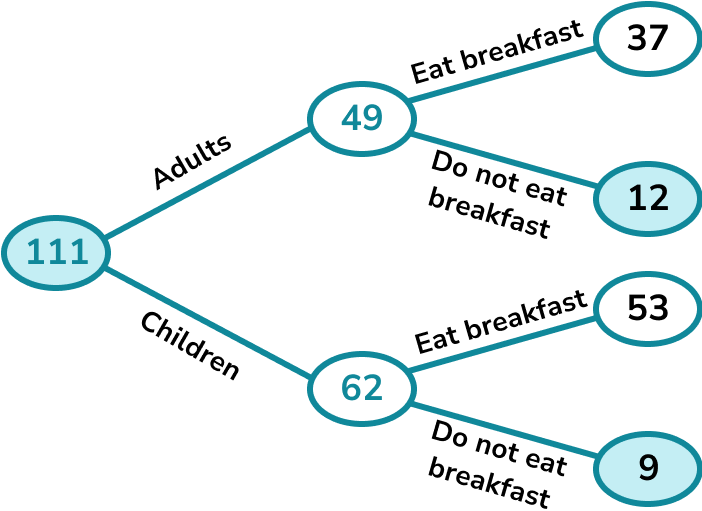
The probability that a person picked at random does not eat breakfast is \frac{21}{111}.
This cancels to \frac{7}{37}.
Example 5: fill in a frequency tree
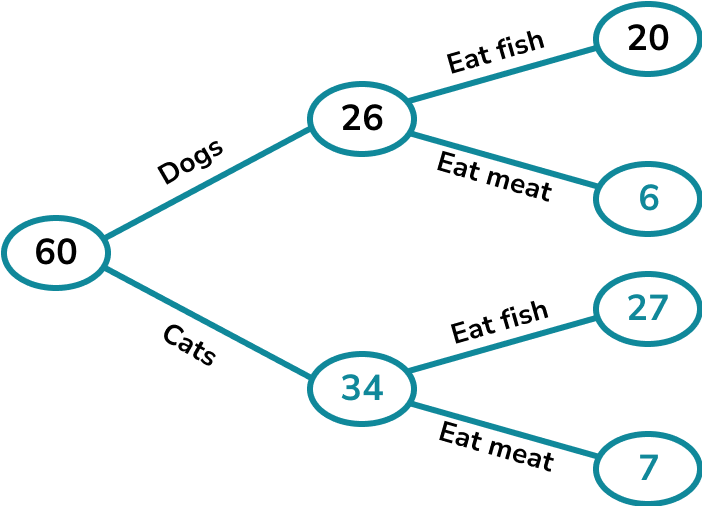
60 pet owners were surveyed about the diet of their pets.
20 of the 26 dog owners said their dog eats fish.
47 of the pet owners said their pet eats fish.
Complete the frequency tree.
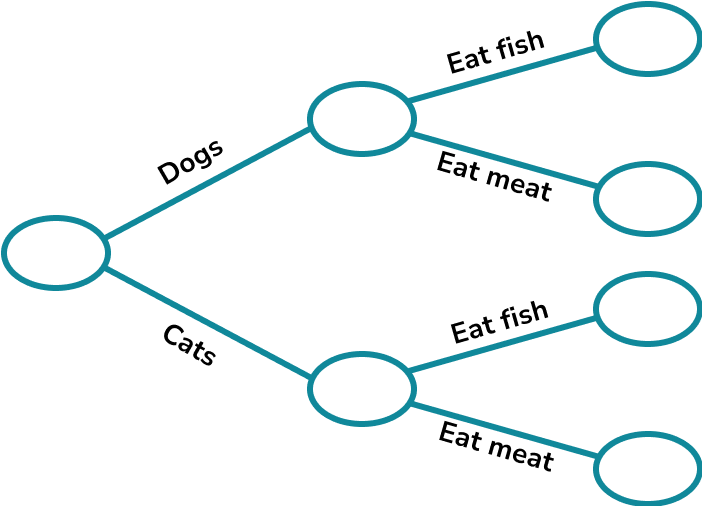
A pet is chosen at random. What is the probability that they are a cat who eats meat?
We can fill in the numbers we were given in the initial information.
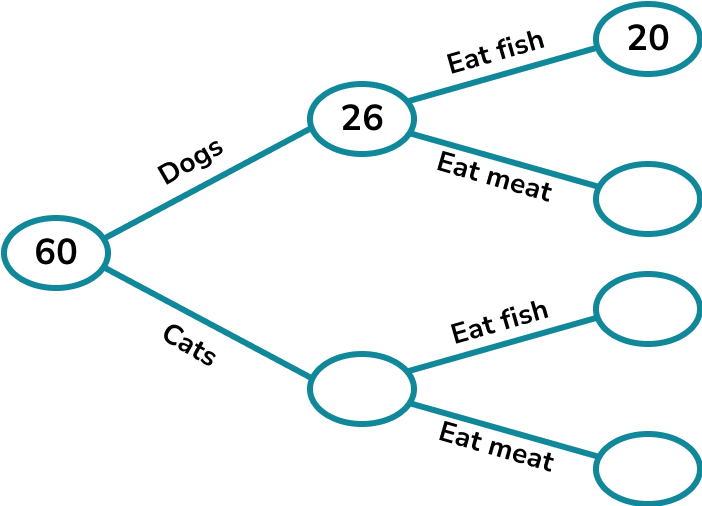
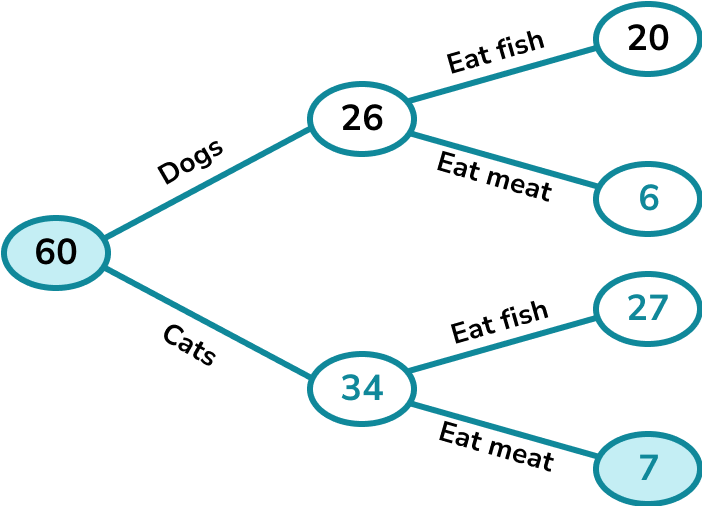
The probability that a pet picked at random is a cat who eats meat is \frac{7}{60}.
Example 6: fill in a frequency tree
A hotel has 70 rooms.
The ratio of single rooms to double rooms is 2:3.
25\% of the single rooms and \frac{2}{7} of the double rooms have a bath. The rest of the rooms have showers.
Complete the frequency tree.
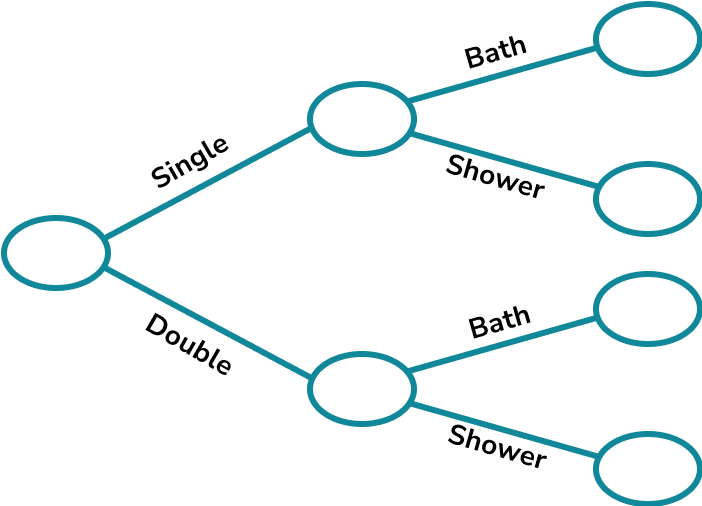
A room is chosen at random. What is the probability that it is a double room with a shower?
Dividing 70 in the ratio 2:3 we get 28:42.
25\% of 28 is 7.
\frac{2}{7} of 42 is 12.
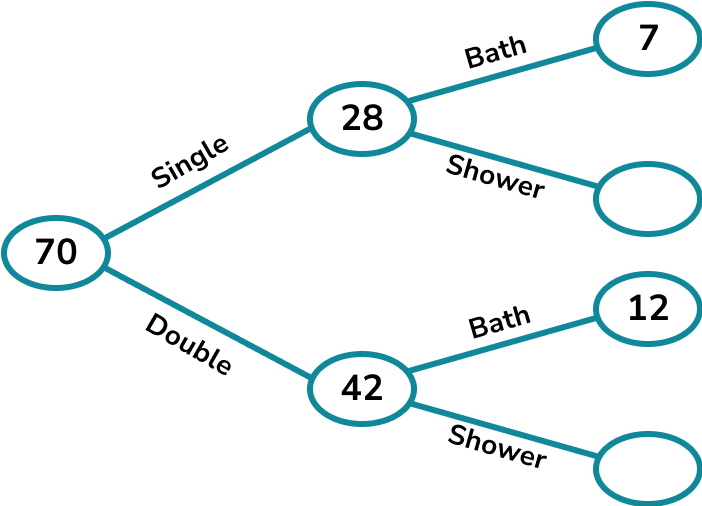
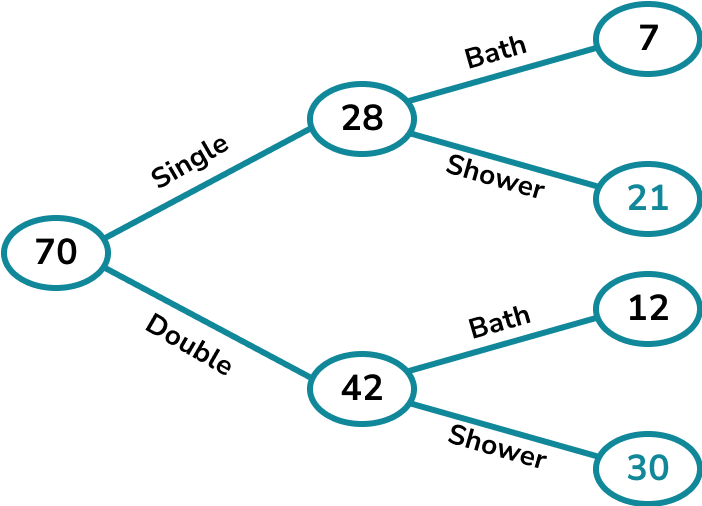
We can see that 30 double rooms have a shower out of 70 rooms altogether.
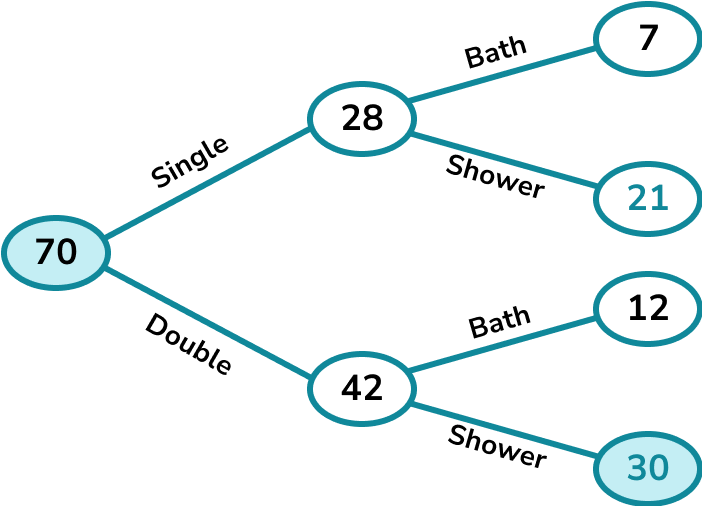
The probability that a room picked at random is a double room with a shower is \frac{30}{70}.
This cancels to \frac{3}{7}.
Common misconceptions
- Frequencies are used
Frequency trees look like probability trees, but frequencies are used. The numbers on the trees are whole numbers.
- Writing probabilities
Probabilities can be given as fractions or decimals. Probabilities are between 0 and 1. Percentages are also acceptable, between 0\% and 100\%.
- Read the question carefully
It is important that you read this type of question carefully to determine which values to use for the probability.
- Modelling in maths
The situations in maths questions have been simplified to make the situation simpler to study. The world is a more complex place to live. So individuals need to go under one category and one only.
For example, a school asks students to choose football or rugby. In maths modelling we keep these separate. But in real-life the school may accommodate students who want to choose both or neither.
Practice frequency trees questions
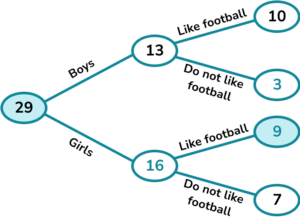
1. A class has 29 children.
There are 13 boys.
10 boys like football and 7 girls do not like football.
Complete the frequency tree diagram.
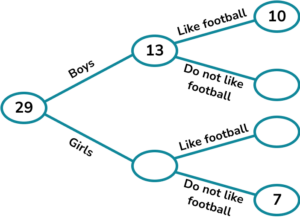
A child is picked at random. What is the probability that they are a girl who likes football?


Complete the frequency tree and find the values to write the probability. The probability is \frac{9}{29}.
2. A factory has 89 workers.
There are 38 females.
31 males and 27 females like tea.
Complete the frequency tree diagram.
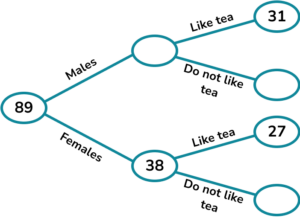
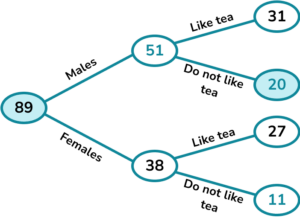
A worker is picked at random. What is the probability that they are a male who does not like tea?
Complete the frequency tree and find the values to write the probability. The probability is \frac{20}{89}.
3. A college has 158 learners studying history or geography.
There are 87 history students.
80 history students pass the course and 6 geography students fail.
Complete the frequency tree diagram.
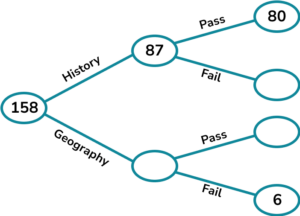
A geography student is picked at random. What is the probability that the student passes?
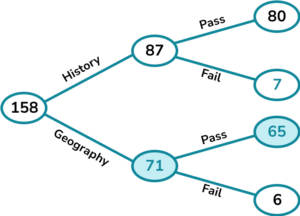
Complete the frequency tree and find the values to write the probability. Note here that we know that the student studies geography so we only include the geography students in the probability.
The probability is \frac{65}{71}.
4. Some pet owners were surveyed about insurance.
48 of the 53 dog owners in the survey said they have insurance.
11 of the 18 cat owners said they have insurance.
Complete the frequency tree.
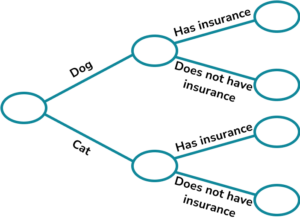
A pet is picked at random. What is the probability that they do not have insurance?
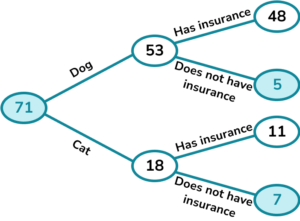
Complete the frequency tree and find the values to write the probability.
The probability is \frac{12}{71}.
5. A hotel has 91 rooms.
3 of the 20 single rooms have a view. There are 23 rooms that do not have a view.
Complete the frequency tree.
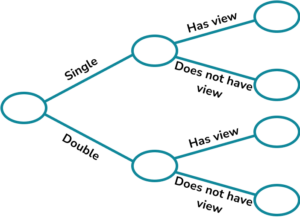
A room is picked at random. What is the probability that the room is a double room without a view?
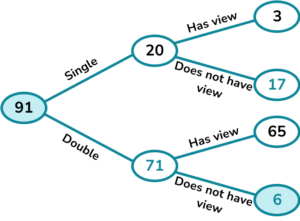
Complete the frequency tree and find the values to write the probability.
The probability is \frac{6}{91}.
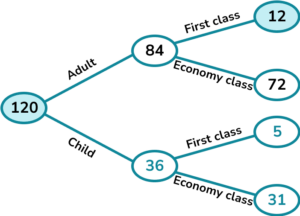
6. 120 passengers board a flight.
70\% of the passengers are adults.
The ratio of adults who travel first class to adults who travel economy class is 1:6.
A total of 17 passengers travel first class.
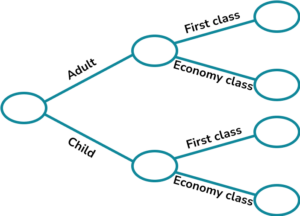
A person is picked at random. What is the probability that they are an adult travelling first class?
Complete the frequency tree and find the values to write the probability.
The probability is \frac{12}{120}.
Frequency trees GCSE questions
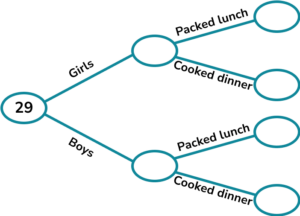
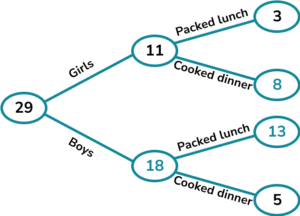
1.(a) A class has 29 children.
11 of the children are girls.
3 of the girls have a packed lunch.
5 of the boys have cooked dinner.
Complete the frequency tree.
(b) A child is picked at random.
Write down the probability that they are a boy who has a packed lunch.
(5 marks)
(a)
For putting two of the three original values (11 or 3 or 5) in the correct place.
(1)
For the first 4 correct values.
(1)
For the all 6 correct.
(1)
(b)
\frac{13}{29}
For the correct numerator.
(1)
For the correct denominator.
(1)
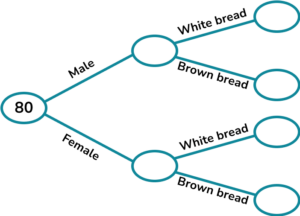
2. (a) 80 people were asked if they prefer white bread or brown bread.
47 of the people were male.
10 of the females preferred white bread.
58 of the 80 people preferred brown bread.
Complete the frequency tree.
(b) One of the people is chosen at random.
Work out the probability that they are a female who prefers brown bread.
(5 marks)
(a)
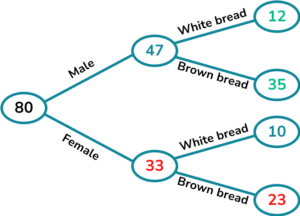
For putting 47 or 10 in the correct place.
(1)
\begin{aligned} &80-47=33\\ &33-10=23 \end{aligned}For the first 2 subtractions.
(1)
\begin{aligned} &58-23=35\\ &47-35=12 \end{aligned}For the last 2 subtractions.
(1)
(b)
\frac{23}{80}
For the correct numerator.
(1)
For the correct denominator.
(1)
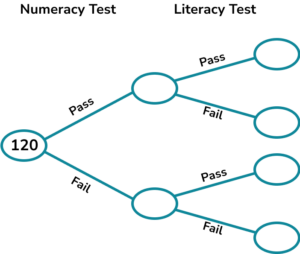
3. (a) 120 students sat a numeracy test and a literacy test.
The ratio of the students who passed the numeracy test to failed the numeracy test is 4:1.
5 of the students who failed numeracy also failed literacy.
87 students passed both the numeracy and literacy tests.
Complete the frequency tree.
(b) One of the people is chosen at random.
Work out the probability that they are a female who prefers brown bread.
(5 marks)
(a)
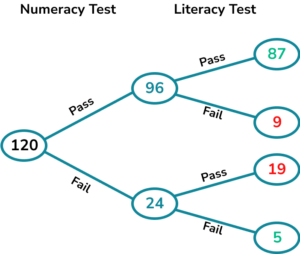
For putting 5 or 87 in the correct place.
(1)
\begin{aligned}
&120\div 5 =24\\
&24\times 4=96
\end{aligned}
For working out the numeracy frequencies.
(1)
For the complete correct frequency tree.
(1)
(b)
\frac{19}{120}
For the correct numerator.
(1)
For the correct denominator.
(1)
Learning checklist
You have now learned how to:
The next lessons are
Still stuck?
Prepare your KS4 students for maths GCSEs success with Third Space Learning. Weekly online one to one GCSE maths revision lessons delivered by expert maths tutors.

Find out more about our GCSE maths tuition programme.