GCSE Tutoring Programme
Our chosen students improved 1.19 of a grade on average - 0.45 more than those who didn't have the tutoring.
In order to access this I need to be confident with:
Probability scale Independent events Adding decimals Subtracting decimals Multiplying decimals Dividing decimals Adding fractions Subtracting fractions Multiplying fractions Dividing fractionsThis topic is relevant for:

Probability Tree Diagram
Here we will learn about probability tree diagrams, including what they are and how to complete them. We will also look at calculating probabilities using probability tree diagrams.
You can also download the following free probability tree diagram resources all suitable for those following Edexcel, AQA or OCR exam boards:
What are probability tree diagrams?
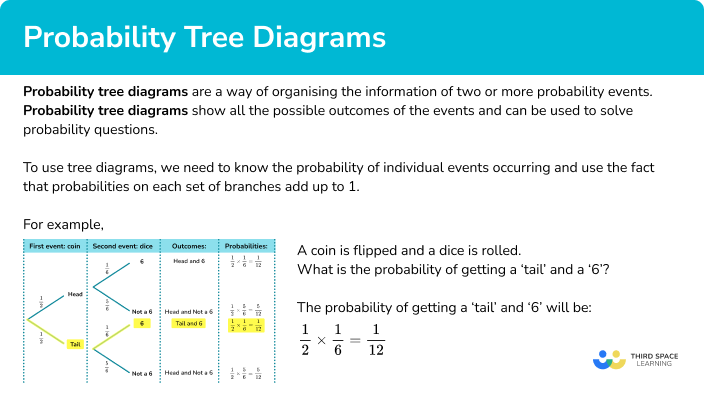
Probability tree diagrams are a way of organising the information of two or more probability events. Probability tree diagrams show all the possible outcomes of the events and can be used to solve probability questions.
To use tree diagrams, we need to know the probability of individual events occurring and use the fact that probabilities on each set of branches add up to \bf{1}.
Probability tree diagrams start by showing the possible outcomes for the first event, with the outcomes at the ends of the branches and the probabilities written along the branches.
The probabilities of the events can be written as fractions or decimals.
For example,
A coin is flipped and a dice is rolled.
What is the probability of getting a ‘tail’ and a ‘6’?
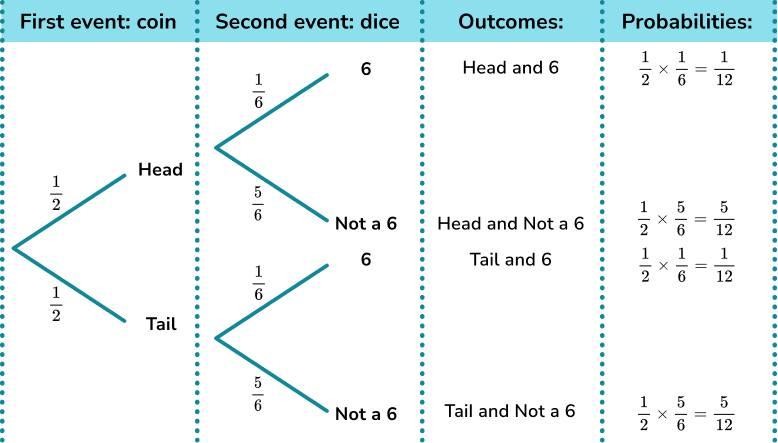
The first event is flipping the coin. The two possible outcomes are ‘heads’ and ‘tails’. These are mutually exclusive events. They cannot happen at the same time.
The second event is rolling the dice. The possible outcomes are ‘1’, ‘2’, ‘3’, ‘4’, ‘5’ and ‘6’. However, the question is only interested in ‘6’, so we can have a ‘6’ branch and a ‘not a 6 ’ branch.
These outcomes can occur whether the coin landed on heads or tails so we add these outcomes to the end of both branches in order to show all possible combinations of outcomes.
The probability of getting a ‘6’ is \frac{1}{6}.
The probability of getting ‘not a 6 ’ will be 1-\frac{1}{6} = \frac{5}{6} .
Remember that the probabilities on each set of branches add up to \bf{1} .
We want the probability of getting a tail and a 6 so we follow the path that shows tail and 6.
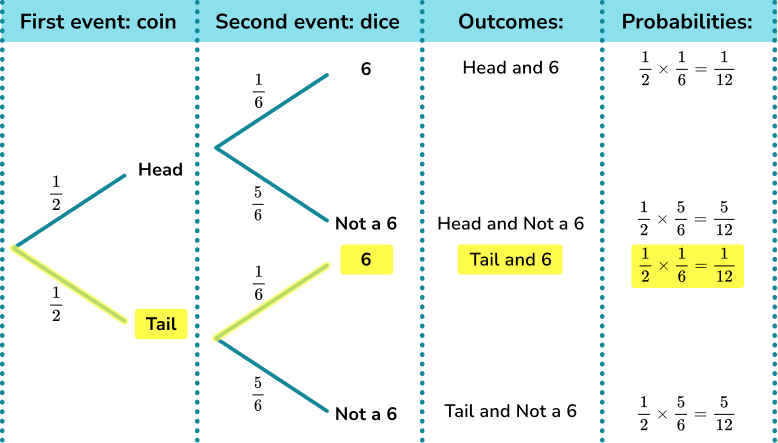
The AND rule for probability states that \text{P (A and B) }=\text{P(A)} \times \text{P(B)} .
Taking the probabilities from the corresponding branches of the tree diagram, we get
Probability of getting a ‘tail’ and a ‘6’ is
\frac{1}{2}\times \frac{1}{6}=\frac{1}{12} .
Tree diagrams can be used for both independent and dependent events.
The events ‘flipping a coin’ and ‘rolling a dice’ are independent events – where the outcome of one event does not affect the outcome of the other event.
Events can also be dependent events – where the outcome of one event depends upon what has happened before.
What are probability tree diagrams?
How to use a tree diagram to find probability
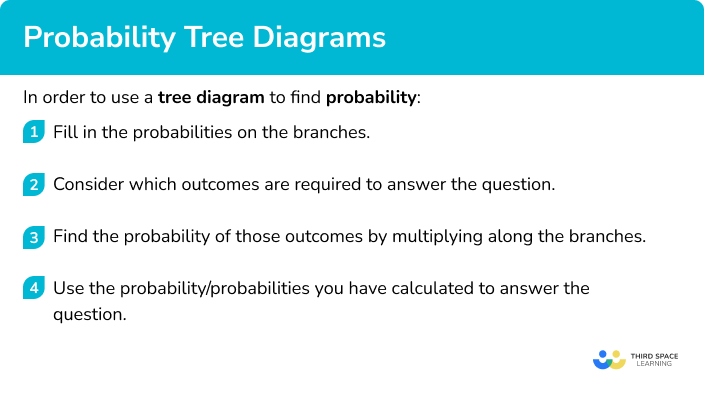
In order to use a tree diagram to find probability:
- Fill in the probabilities on the branches.
- Consider which outcomes are required to answer the question.
- Find the probability of those outcomes by multiplying along the branches.
- Use the probability/probabilities you have calculated to answer the question.
Explain how to use a tree diagram to find probability
Probability tree diagrams worksheet
Get your free probability tree diagrams worksheet of 20+ questions and answers. Includes reasoning and applied questions.
DOWNLOAD FREEProbability tree diagrams worksheet
Get your free probability tree diagrams worksheet of 20+ questions and answers. Includes reasoning and applied questions.
DOWNLOAD FREEProbability tree diagram examples
Example 1: two independent events
A spinner is spun twice. It can land on red or it can land on blue.
Complete the tree diagram.
Work out the probability that both spins will land on blue.
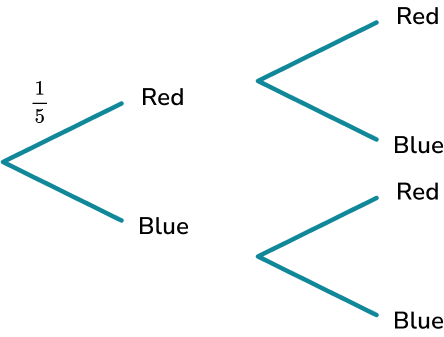
- Fill in the probabilities on the branches.
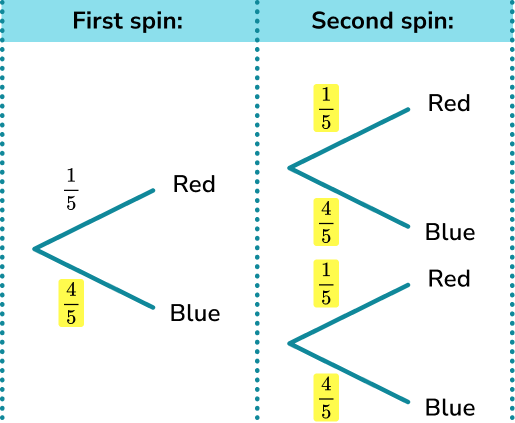
We have been given the probability of the spinner landing on red. We can work out the probability of the spinner landing on blue by using the fact that the probabilities on each set of branches add up to 1.
P(\text{blue})=1-P(\text{red})=1-\frac{1}{5}=\frac{4}{5}
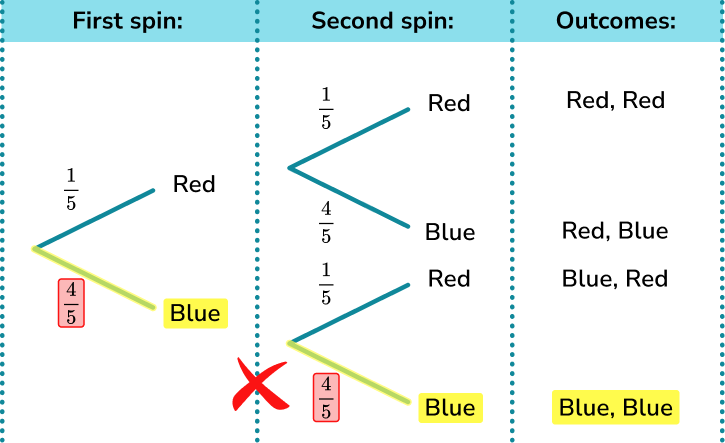
Since the two spins are independent we can use the same probabilities for the second set of branches.
2Consider which outcomes are required to answer the question.
We can write the different outcomes at the ends of the branches. The question asks about two blues so we will need to look for the path which shows two blues.
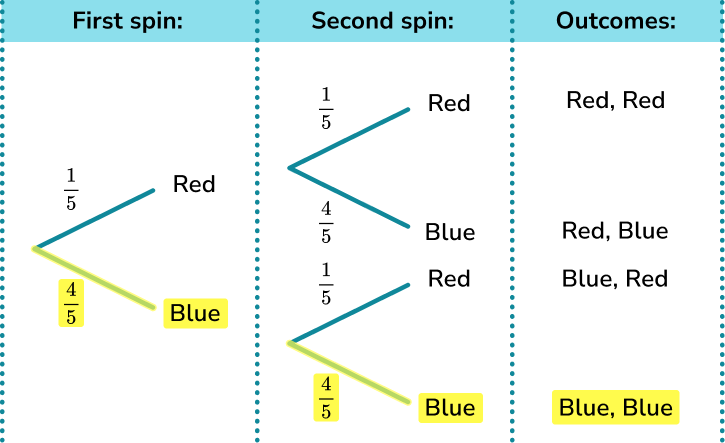
3Find the probability of those outcomes by multiplying along the branches.
We need to use the probabilities on the branches and multiply them together to find the required probability.
The probability of the spinner landing on blue twice is
\begin{aligned} P(\text{blue and blue})&=P(\text{blue})\times P(\text{blue})\\\\ &=\frac{4}{5}\times \frac{4}{5}\\\\ &=\frac{16}{25} \end{aligned} .
4Use the probability/probabilities you have calculated to answer the question.
The probability that both spins will land on blue is \frac{16}{25}.
Example 2: two independent events
In a bag there are 10 balls. There are 4 red balls and the remaining balls are green.
A ball is removed at random and the colour noted.
The ball is replaced.
A second ball is removed at random and the colour is noted.
Complete the tree diagram.
Work out the probability that there will be one ball of each colour.
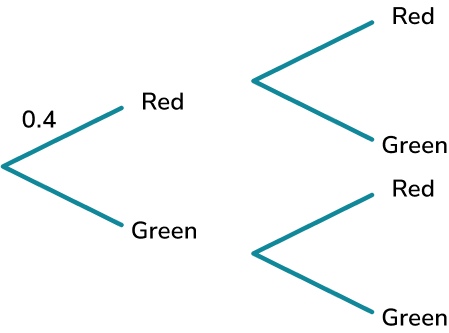
We have been given the probability of picking a red ball. We can fill in the probability of picking a green ball using the fact that the probabilities for each set of branches add up to 1. We are going to use decimals like in the tree diagram, but we could use fractions.
P(\text{green})=1-P(\text{red})=1-0.4=0.6
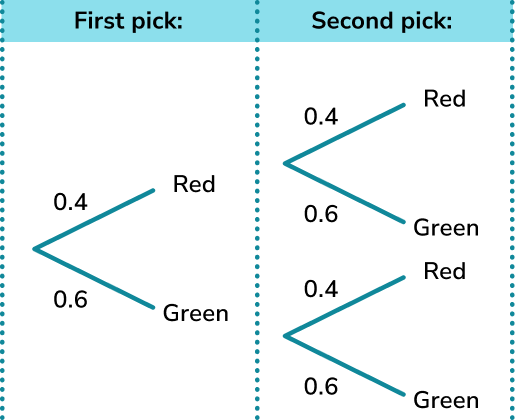
So, we can fill in the missing probability for the first ball pick. Since the ball which is picked is replaced we can use the same probabilities for the second set of branches.
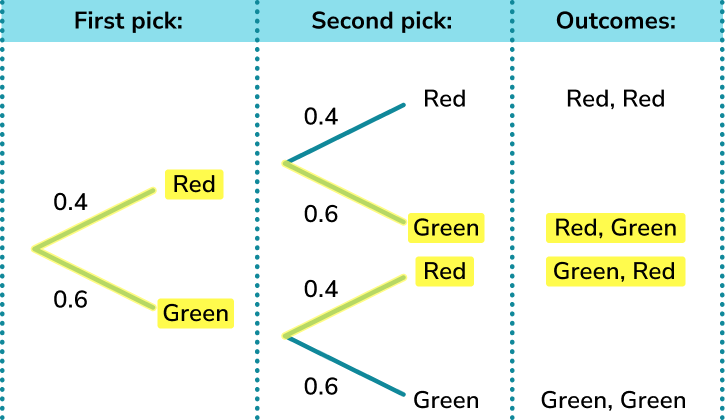
The question asks about one red ball and one green ball. There are two paths which give one red ball and one green ball.
We need to use the probabilities on the branches and multiply them together.
\begin{aligned}
&\text{P(Red and Green): } 0.4 \times 0.6=0.24\\\\
& \text{P(Green and Red): } 0.6 \times 0.4=0.24
\end{aligned}
Since we need one ball of each colour, we can have one red and one green in either order.
We can use P(A or B) = P(A) + P(B), giving us
\begin{aligned} P(\text{one ball of each colour})&=P(\text{R,G}) \ or \ P(\text{G,R})\\\\ &=P(\text{R,G})+ P(\text{G,R})\\\\ &=0.24+0.24\\\\ &=0.48 \end{aligned}
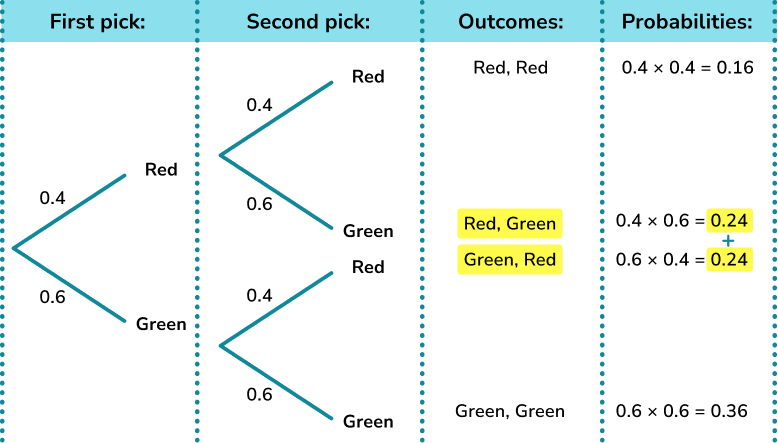
The probability that one ball will be red and one ball will be green is 0.48.
Example 3: two independent events
Mary has to catch 2 buses to work. The probability the first bus will be late is 0.1 and the probability the second bus will be late is 0.3.
Complete the tree diagram.
Work out the probability that at least one bus will be late.
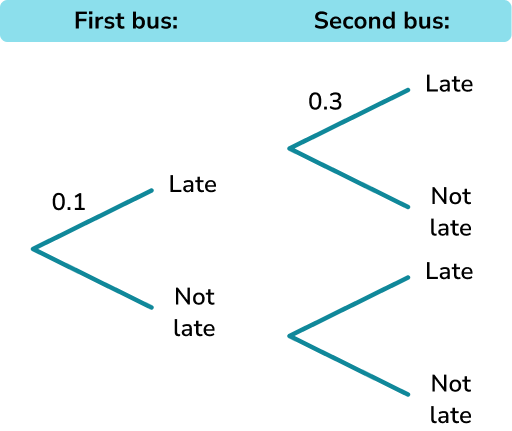
We have been given the probability of the first bus being late. We can work out the probability of the first bus NOT being late.
P(\text{NOT late})=1-P(\text{late})=1-0.1=0.9
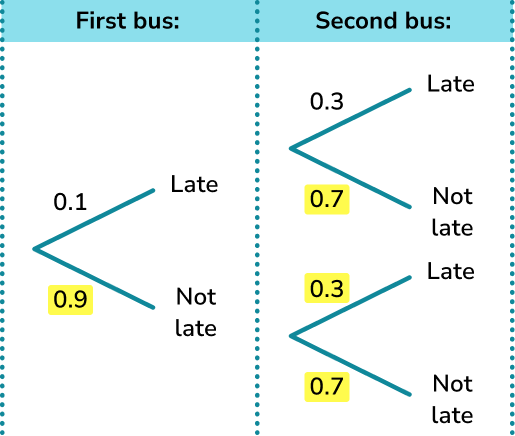
We can fill in the missing probability for the first bus.
Since the probability of the second bus being late is different, we need to use different probabilities for the second set of branches.
P(\text{NOT late})=1-P(\text{late})=1-0.3=0.7
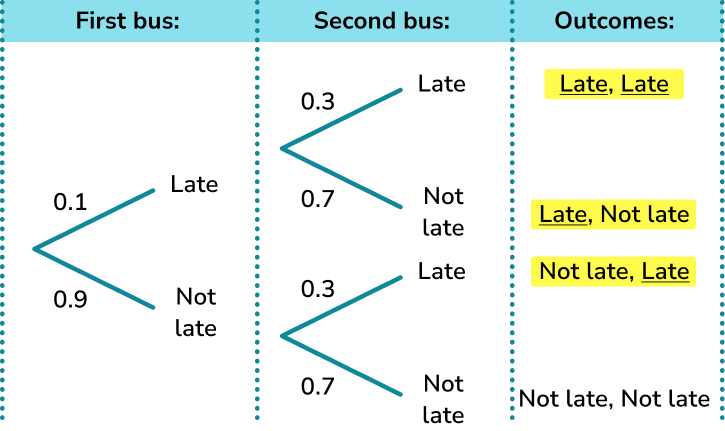
The question asks about at least one of the buses being late. So we need to look at one bus late or both buses are late.
\begin{aligned} \text{P(Late and late): } 0.1 \times 0.3=0.03\\\\ \text{P(Late and not late): } 0.1 \times 0.7 =0.07\\\\ \text{P(Not late and late): } 0.9 \times 0.3=0.27 \end{aligned}
\begin{aligned} P(\text{at least one bus late}) &= P(\text{Late, Late}) \ or \ P(\text{Late, Not late}) \ or \ P(\text{Not late, Late}) \\\\ &= P(\text{Late, Late})+P(\text{Late, Not late})+P(\text{Not late, Late}) \\\\ &=0.03+0.07+0.27\\\\ &=0.37 \end{aligned}
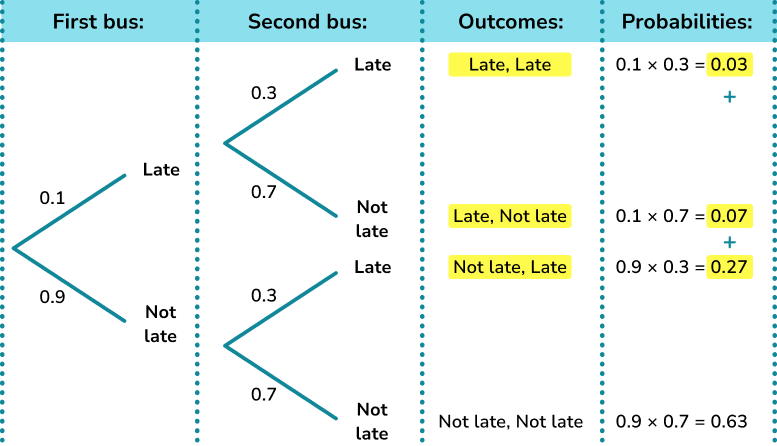
The probability that at least one bus will be late is 0.37.
Alternatively:
You could have found the probability of at least one bus being late a different way.
\begin{aligned}
P(\text{at least one late}) & =1-P(\text{NONE late})\\\\
& = 1-(0.9 \times 0.7) \\\\
& =1-0.63\\\\
& =0.37
\end{aligned}
Example 4: dependent events
There are 9 sweets in a bag. 3 of the sweets are mints and the remaining sweets are chews. A sweet is taken out at random and is eaten.
A second sweet is taken at random and is also eaten.
Complete the tree diagram.
Work out the probability that two mints are eaten.
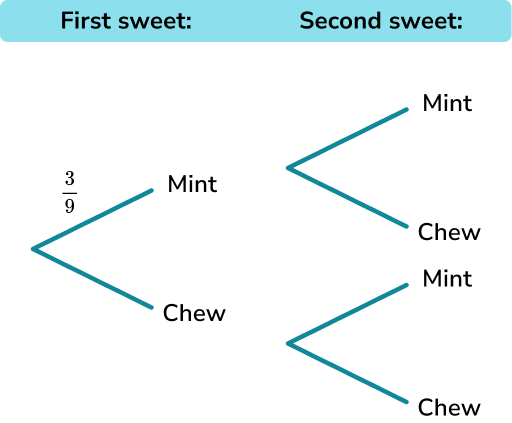
We have been given the probability of the first sweet being a mint. We can work out the probability of the first sweet being a chew. It is better to keep the fractions as they are and not cancel.
P(\text{chew})=1-P(\text{mint})=1-\frac{3}{9}=\frac{6}{9}
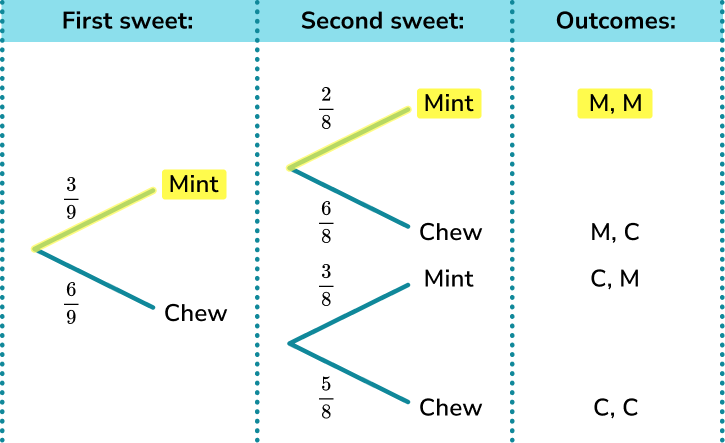
We can fill in the missing probability for the first pick of sweets.
Since the sweet which is picked is eaten it is NOT replaced we need different probabilities for the second set of branches. These probabilities change depending on whether the first sweet was a mint or a chew.
If the first sweet is a mint, there will be 8 sweets left, 2 mints and 6 chews.
If the first sweet is a chew, there will be 8 sweets left, 3 mints and 5 chews.

The question asks about both sweets being mints. So we need to look at this part of the tree diagram.
The probability of picking two mints is:
\begin{aligned}
P(\text{mint and mint})&=P(\text{mint})\times P(\text{mint})\\\\
&=\frac{3}{9}\times \frac{2}{8}\\\\
&=\frac{6}{72}\\\\
&=\frac{1}{12}
\end{aligned}
The probability that both sweets will be mints is \frac{1}{12}.
Example 5: dependent events
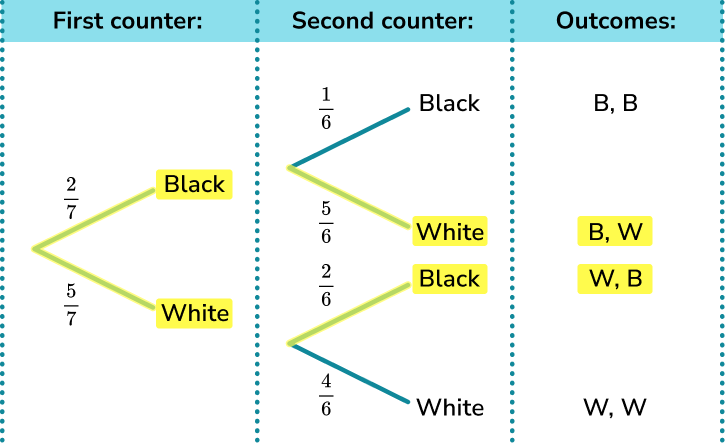
In a bag there are 7 counters. There are 2 black counters and the remaining counters are white.
A counter is removed and the colour noted.
The counter is NOT replaced.
A second counter is removed and the colour is noted.
Complete the tree diagram.
Work out the probability that there will be one counter of each colour picked.
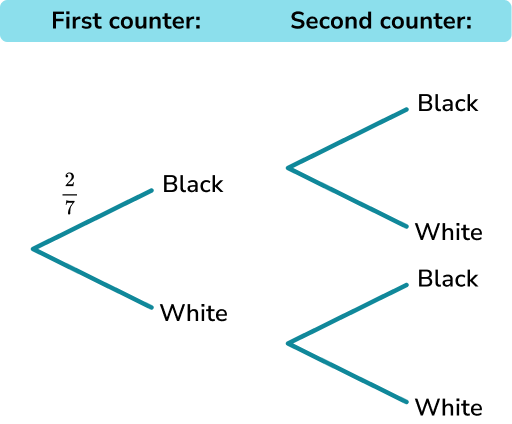
We have been given the probability of picking a black counter. We can fill in the probability of picking a white counter.
P(\text{white})=1-P(\text{black})=1-\frac{2}{7}=\frac{5}{7}
So, we can fill in the missing probability for the first counter. Since the counter which is picked is NOT replaced we need different probabilities for the second set of branches. These probabilities change depending on whether the first counter was white or black.
If one black counter has been picked, there will be 6 counters left, 1 black and 5 white.
If one white counter has been picked, there will be 6 counters left, 2 black and 4 white.

The question asks about one of each colour counter so we will need to look for any paths which give one counter of each colour.
\begin{aligned} \text{P(Black and white): } \frac{2}{7} \times \frac{5}{6} = \frac{10}{42}\\\\ \text{P(White and black): } \frac{5}{7} \times \frac{2}{6} = \frac{10}{42} \end{aligned}
\begin{aligned} P(\text{one of each colour})&=P(\text{B,W})\ or \ P(\text{W,B})\\\\ &=P(\text{B,W})+ P(\text{W,B})\\\\ &=\frac{10}{42}+\frac{10}{42}\\\\ &=\frac{20}{42}\\\\ &=\frac{10}{21} \end{aligned}
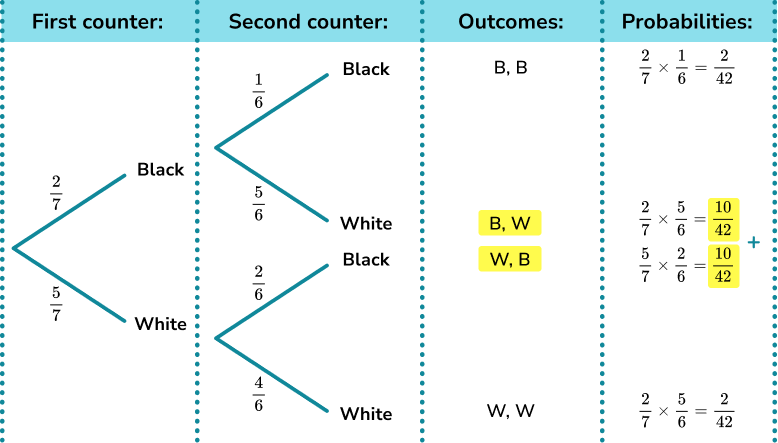
The probability that one of each colour counter will be picked is \frac{10}{21}.
Example 6: three independent events
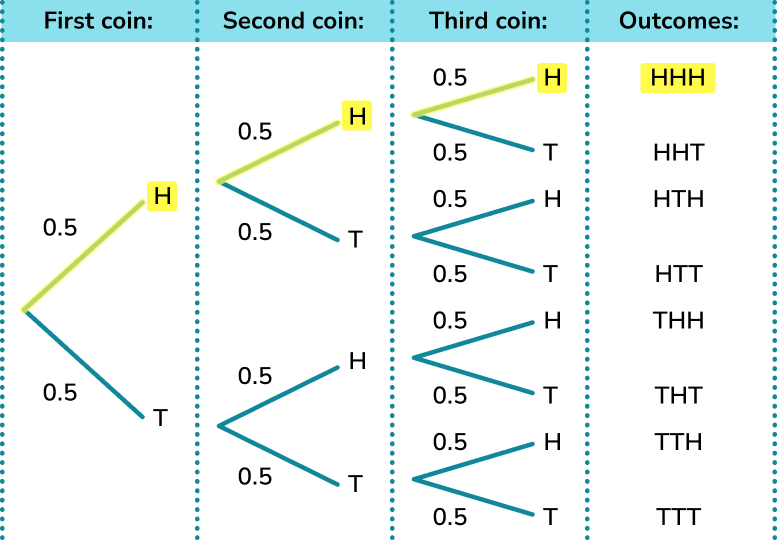
Three coins are flipped.
Complete the tree diagram.
Work out the probability of getting 3 heads.
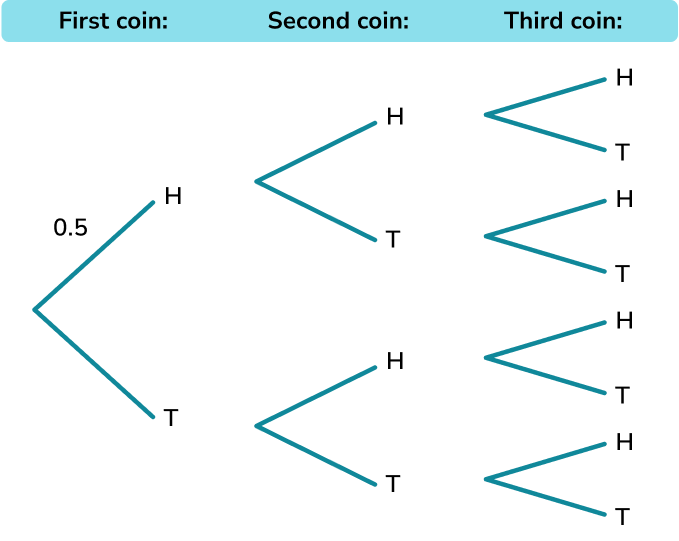
We have been given the probability of the first coin landing on a head. We can work out the probability of the first coin landing on a tail.
P(\text{tail})=1-P(\text{head})=1-0.5=0.5
We can fill in the missing probability for the first coin. The second and third coins will have the same probabilities.
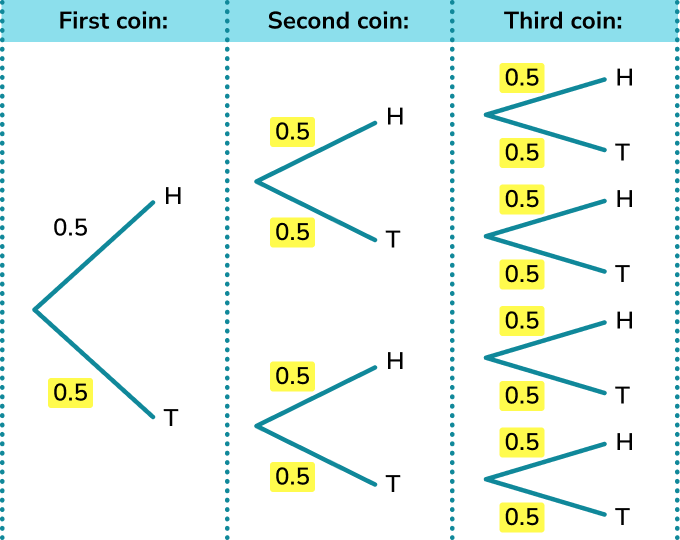
The question asks about 3 heads. So we need to look for the path which shows three heads.
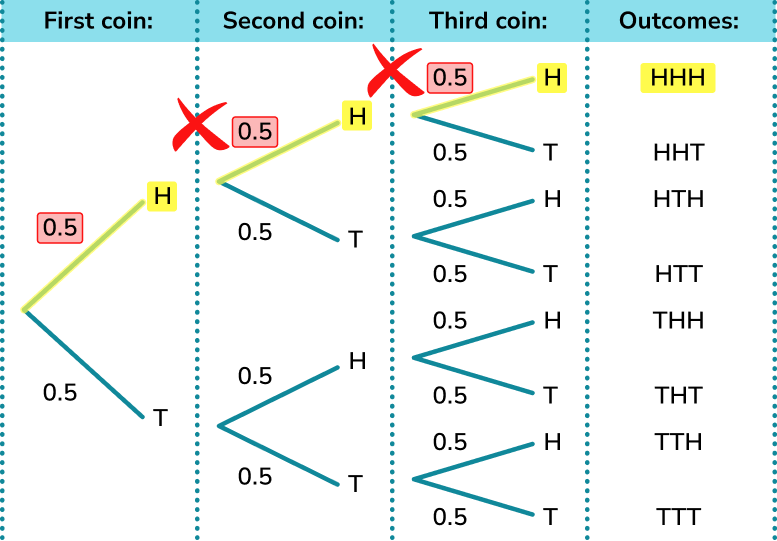
\begin{aligned}
P(\text{3 heads}) &= P(\text{Head and Head and Head)}) \\\\
&= P(\text{Head}) \times P(\text{Head})\times P(\text{Head}) \\\\
&=0.5\times 0.5\times 0.5\\\\
&=0.125
\end{aligned}
The probability that there will be 3 heads is 0.125.
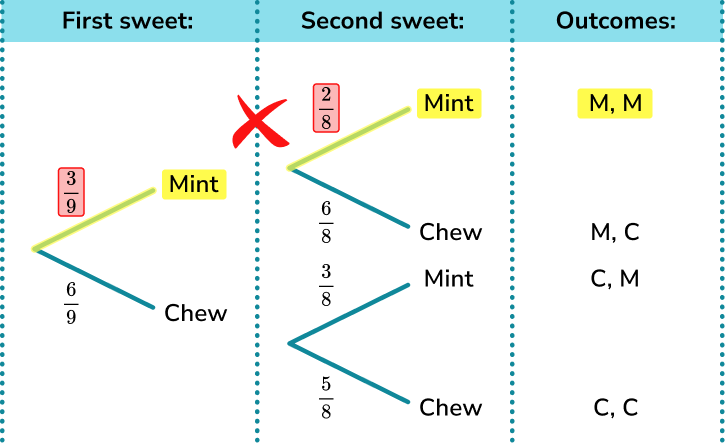
Common misconceptions
- Cancelling fractions
It is not worth cancelling fractions when working within probability questions. This is because the numerator and denominator give information about the event, for example the number of balls in a bag. We often need to add fractions and they need a common denominator. Only cancel right at the end of a question.
- Multiplying decimals
Take care when multiplying decimals. It is easy to make mistakes. For example 0.3 \times 0.4=0.12, but some people might think the answer is 1.2, which would be incorrect.
- Dependent events
Remember that for dependent events, the probability of the second event changes depending on the outcome of the first event.
Practice probability tree diagram questions
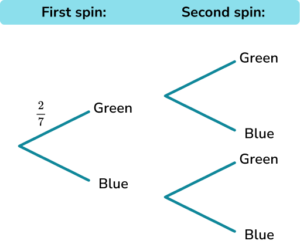
1. A spinner has green sections and blue sections.
The probability of the spinner landing on green is \frac{2}{7}.
The spinner is spun twice.
Using the tree diagram, work out the probability of the spinner landing on green twice.


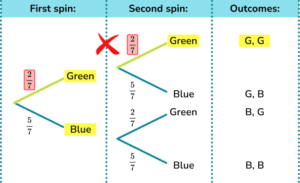
\begin{aligned} P(\text{2 Greens})&=P(\text{Green and green})\\\\ &=P(\text{Green})\times P(\text{Green})\\\\ &=\frac{2}{7}\times \frac{2}{7}\\\\ &=\frac{4}{49} \end{aligned}
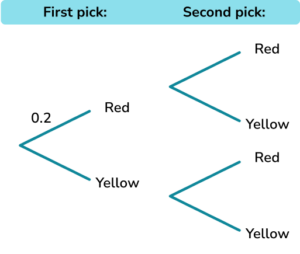
2. In a bag there are 10 balls. There are 2 red balls and the remaining balls are yellow.
A ball is removed at random and the colour noted.
The ball is replaced.
A second ball is removed at random and the colour is noted
Using the tree diagram, work out the probability that there will be a ball of each colour chosen.
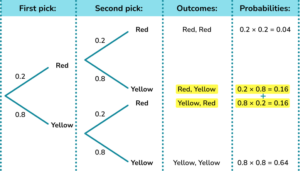
\begin{aligned} P(\text{One of each colour})&=P(\text{R,Y}) \ or \ P(\text{Y,R})\\\\ &=P(\text{R,Y}) + P(\text{Y,R})\\\\ &=(0.2\times 0.8)+(0.8\times 0.2)\\\\ &=0.16+0.16\\\\ &=0.32 \end{aligned}
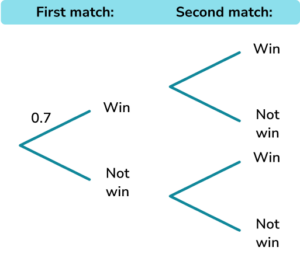
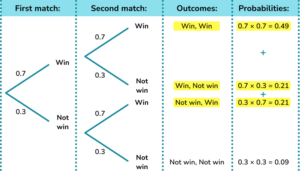
3. A football team wins its matches with a probability of 0.7.
Using a tree diagram, find the probability that they win at least 1 of their next two matches.
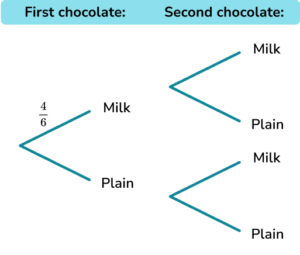
4. There are 6 chocolates in a box. 4 of the chocolates are milk chocolates and the remaining chocolates are plain chocolates. A chocolate is taken out at random and is eaten.
A second chocolate is taken at random and is also eaten.
Work out the probability that two milk chocolates are eaten.
Give your answer in its simplest form.
As the first chocolate is eaten, the probabilities on the second set of branches are different.
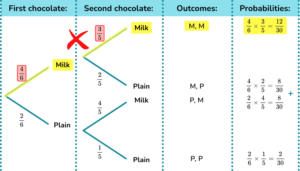
\begin{aligned} P(\text{Two Milks})&=P(\text{Milk and Milk})\\\\ &=P(\text{Milk}) \times P(\text{Milk})\\\\ &=\frac{4}{6}\times \frac{3}{5}\\\\ &=\frac{12}{30}\\\\ &=\frac{2}{5} \end{aligned}
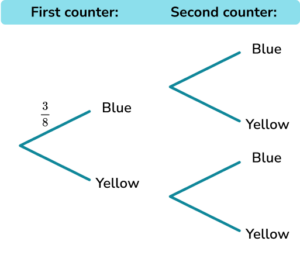
5. In a bag there are 8 counters. There are 3 blue counters and the remaining counters are yellow.
A counter is removed at random and the colour noted.
The counter is NOT replaced.
A second counter is removed at random and the colour is noted.
Using the tree diagram, work out the probability that there will be at least one blue counter picked.
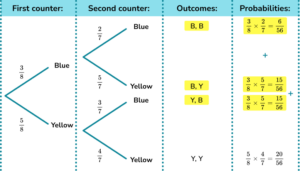
\begin{aligned} P(\text{At least one blue})&=P(\text{B,B}) \ or \ P(\text{B,Y}) \ or \ P(\text{Y,B})\\\\ &=P(\text{B,B}) + P(\text{B,Y})+P(\text{Y,B})\\\\ &=(\frac{3}{8}\times\frac{2}{7})+(\frac{3}{8}\times \frac{5}{7})+P(\frac{5}{8}\times \frac{3}{7})\\\\ &=\frac{6}{56}+\frac{15}{56}+\frac{15}{56}\\\\ &=\frac{36}{56}\\\\ &=\frac{9}{14} \end{aligned}
6. Three dice are rolled.
Using the tree diagram, work out the probability of getting 3 even numbers.
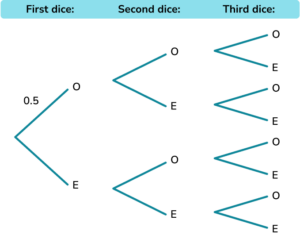
The probability of rolling an odd number is 0.5. The probability of rolling an even number is also 0.5.

\begin{aligned} P(\text{3 Even numbers}) &= P(\text{Even and Even and Even}) \\\\ &= P(\text{Even}) \times P(\text{Even})\times P(\text{Even}) \\\\ &=0.5\times 0.5\times 0.5\\\\ &=0.125 \end{aligned}
Probability tree diagram GCSE questions
1. A bag contains only black and white counters.
Grace picks a counter at random and then replaces it.
Grace then picks a second counter.
(a) Complete the tree diagram.
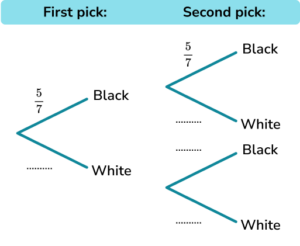
(b) Work out the probability that Grace picks 2 black counters.
(4 marks)
(a)

For \frac{2}{7} on the first branch.
(1)
For \frac{2}{7}, \frac{5}{7}, \frac{2}{7} on the second branches.
(1)
(b)
\frac{5}{7}\times \frac{5}{7}
(1)
\frac{25}{49}(1)
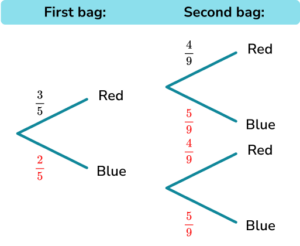
2. Amir has two bags.
In the first bag there are 3 red counters and 2 blue counters.
In the second bag there are 4 red counters and 5 blue counters.
Amir takes at random a counter from the first bag.
He then takes at random a counter from the second bag.
(a) Complete the tree diagram.
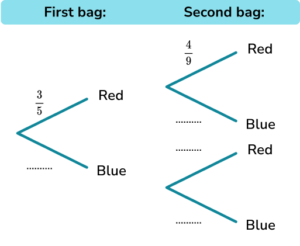
(b) Work out the probability that Amir takes two blue counters.
(4 marks)
(a)
For \frac{2}{5} on the first branch.
(1)
For \frac{5}{9}, \frac{4}{9}, \frac{5}{9} on the second branches.
(1)
(b)
\frac{2}{5}\times \frac{5}{9}
(1)
\frac{10}{45}(1)
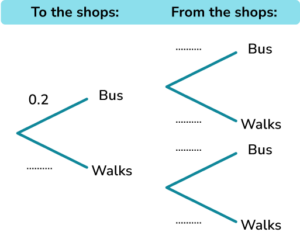
3. Suzy eithers travels by bus or walks to the shops.
The probability that she catches a bus to the shops is 0.2.
The probability that she catches a bus from the shops is 0.9.
(a) Complete the tree diagram.
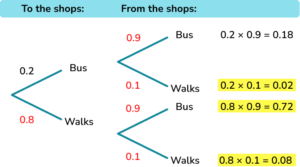
(b) Work out the probability that Suzy walks at least one way.
(5 marks)
(a)
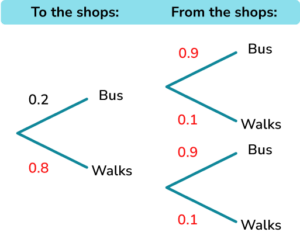
For 0.8 on the first branch.
(1)
For 0.9 and 0.1 on the second branches.
(1)
(b)
\begin{aligned} &0.2\times 0.1=0.02 \\ &0.8\times 0.9=0.72 \\ &0.8\times 0.1=0.08 \end{aligned}
(1)
0.02+0.72+0.08(1)
0.82(1)
Learning checklist
You have now learned how to:
The next lessons are
Still stuck?
Prepare your KS4 students for maths GCSEs success with Third Space Learning. Weekly online one to one GCSE maths revision lessons delivered by expert maths tutors.

Find out more about our GCSE maths tuition programme.