GCSE Tutoring Programme
Our chosen students improved 1.19 of a grade on average - 0.45 more than those who didn't have the tutoring.
This topic is relevant for:

Statistics – Maths GCSE
Here we will learn about statistics maths, including types of data, averages and range, sampling methods and representing data.
You can also download a free Descriptive Statistics Diagnostic Questions, suitable for those following Edexcel, AQA or OCR exam boards.
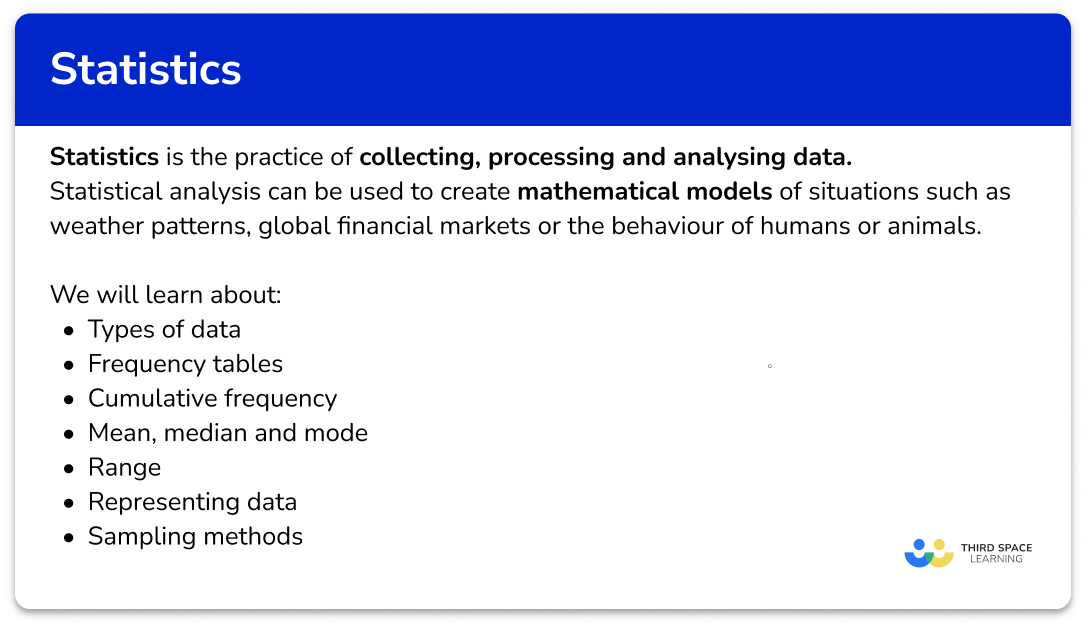
What is statistics?
Statistics is the practice of collecting, processing and analysing data.
Statistical analysis can be used to create mathematical models of situations such as weather patterns, global financial markets or the behaviour of humans or animals.
In this page we will link to lots of other pages that will help with a variety of statistics topics that are examined in both foundation and higher GCSE. Some have already been seen in key stages 2 and 3.
These and other topics are also covered in GCSE Statistics and are extended further in A Level Maths and A Level Statistics.
Here are the different areas of statistics that may be examined in GCSE mathematics. Each of the sections will include exam practice questions and mark schemes.
What is statistics?
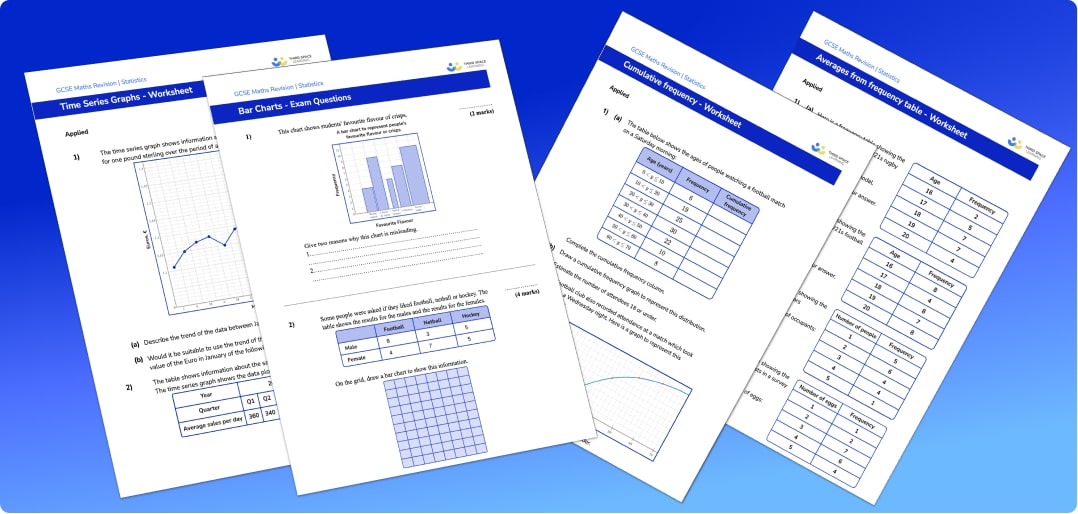
Statistics maths worksheets
Over 40 statistics worksheets ready to download and give to your GCSE students. Each with functional and applied reasoning questions and exam style questions.
DOWNLOAD FREE Statistics maths worksheets
Over 40 statistics worksheets ready to download and give to your GCSE students. Each with functional and applied reasoning questions and exam style questions.
DOWNLOAD FREETypes of data
Types of data are collected and used for research purposes.
They can be used to find information about the population of a town or country, or used by a business to plan advertising campaigns or used to make predictions about the future.
We need to understand the different kinds of data that can be collected and the different statistical ways it can be analysed or interpreted.
The different types of data we need to know are,
- Primary data – data collected from an original source
- Secondary data – data collected from a secondary source
- Qualitative data – non-numerical data
- Quantitative data – numerical data
- Discrete data – exact values or whole numbers that are not rounded
- Continuous data – measurements that are rounded
Step-by-step guide: Types of data
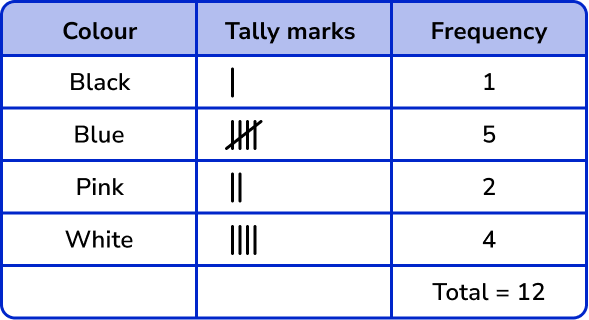
Frequency table
A frequency table is a way of organising collected data.
We use frequency tables to find descriptive statistics. These values help describe the set of data such as the mean, median and mode of a set of data.
For example,
Organise the colours of the 12 shirts in a wardrobe into a frequency table.

Organising this into a frequency table, we have
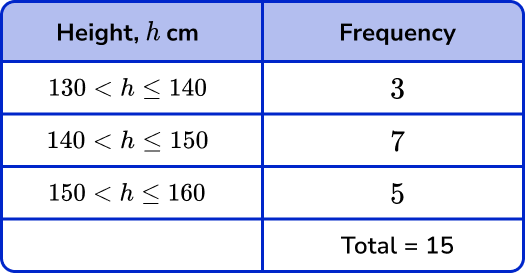
Numerical data can also be organised into grouped data. Here the data is put into different classes with class intervals. Groups must not overlap and be able to contain all data values.
For example,
A grouped frequency table showing the heights of 15 students.
Step-by-step guide: Frequency table
Mean, median and mode
The mean, median and mode in maths are averages.
Averages are measures of central tendency, they are values that can be used to represent a set of data.
We will look at three averages – mean, median and mode.
Step-by-step guide: Mean, median and mode
- Mean
The sum of the values, divided by the number of values.
\text{Mean}=\frac{\text{sum total}}{\text{number of values}}
For example, calculate the mean from this list of data.
1 \hspace{.6cm} 3 \hspace{.6cm} 4 \hspace{.6cm} 5 \hspace{.6cm} 6 \hspace{.6cm} 6 \hspace{.6cm} 7
\text{Mean}=\frac{\text{sum total}}{\text{number of values}}=\frac{1+3+4+5+6+6+7}{7}=\frac{32}{7}=4.57 \ \text{(to 2 dp)}
The mean is 4.57 \ (2dp).
Step-by-step guide: Mean
- Median
Arrange the values in numerical order, from the smallest value to the highest value and find the middle value.
For example, find the median of this set of numbers,
1 \hspace{.6cm} 3 \hspace{.6cm} 4 \hspace{.6cm} 5 \hspace{.6cm} 6 \hspace{.6cm} 6 \hspace{.6cm} 7

The median is 5.
Step-by-step guide: Median
- Mode
The most frequently occurring item in the data set.
For example, find the mode of this list of numbers,
1 \hspace{.6cm} 3 \hspace{.6cm} 4 \hspace{.6cm} 5 \hspace{.6cm} 6 \hspace{.6cm} 6 \hspace{.6cm} 7
The most frequently occurring item is 6.
The mode is 6.
Step-by-step guide: Mode or modal
Range
The range is a measure of how spread out a set of data is.
To calculate the range we find the difference between the highest value and the lowest value.
The highest value is sometimes called the largest value or largest number.
The lowest value is sometimes referred to as the smallest value or smallest number.
\text{Range}=\text{highest value}-\text{lowest value}
For example, work out the range.
5 \hspace{.6cm} 8 \hspace{.6cm} 10 \hspace{.6cm} 11 \hspace{.6cm} 13
\text{Range}=\text{highest value}-\text{lowest value}=13-5=8
The range is 8.
Step-by-step guide: Range
Representing data
Once data has been collected it can be represented in many different ways. This will depend on the type of data collected and what the data is being used for.
Here are some of the different ways data may be represented in GCSE Mathematics.
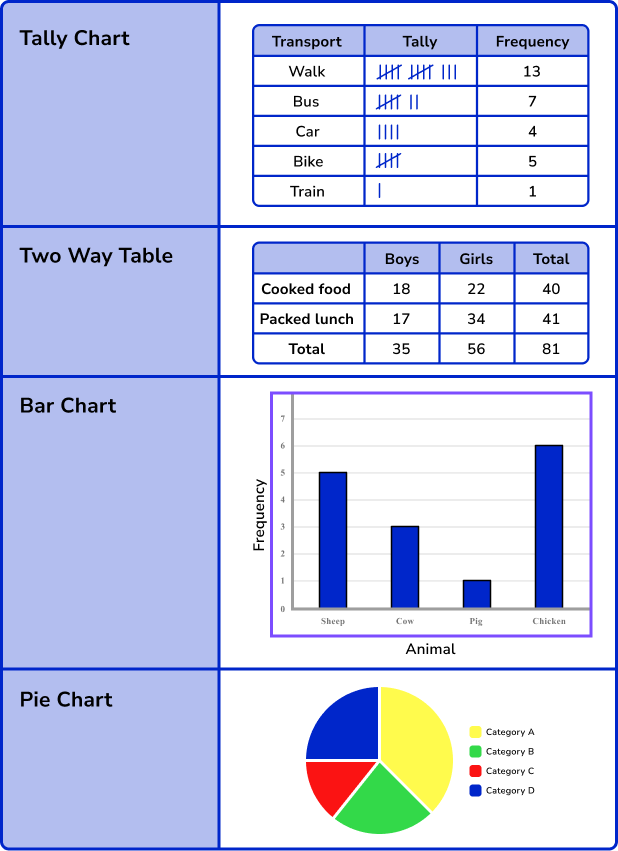
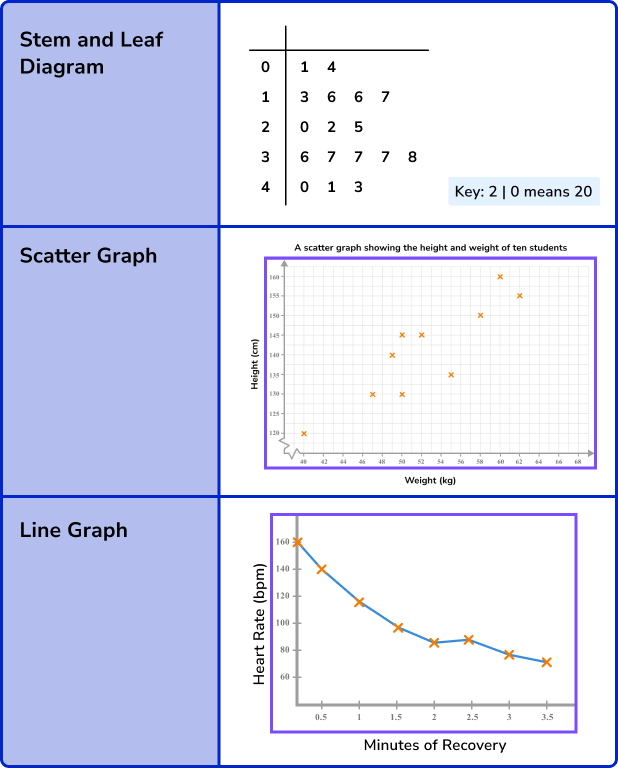
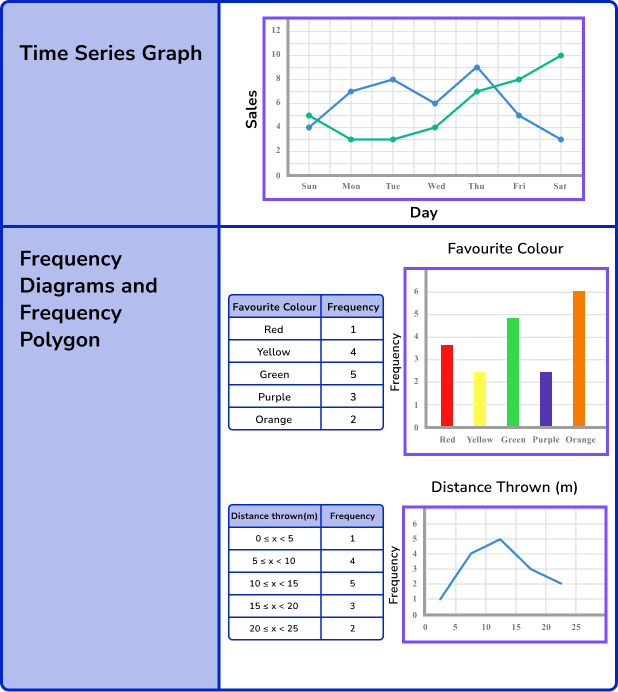
Step-by-step guide: Representing data
Cumulative frequency
Cumulative frequency is the running total of frequencies in a frequency distribution.
Cumulative frequency graphs (or cumulative frequency diagrams) are useful when representing or analysing the distribution of large grouped data sets.
They can also be used to find estimates for the median value, the lower quartile and the upper quartile for the data set.
Step-by-step guide: Cumulative frequency
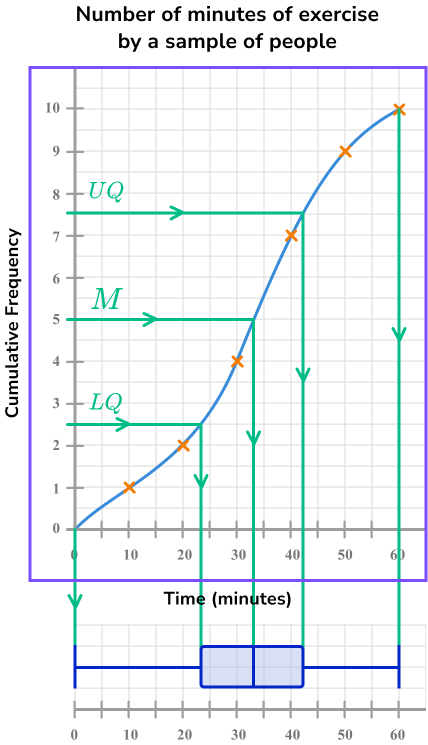
It is convenient to construct a box plot (or a box and whisker diagram) directly below a cumulative frequency curve.
This is because we can locate an estimate for the required values (the lower quartile, the median, and the upper quartile) using the structure in the image above, along with the highest and lowest values for the range.
Step-by-step guide: Box plot
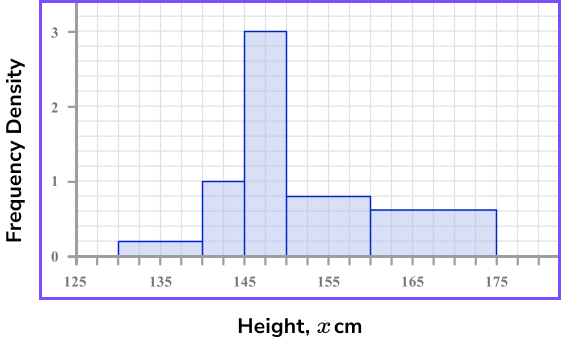
Histograms
Histograms are similar to bar charts but are used to display qualitative continuous data, whereas a bar chart is used to display qualitative or quantitative discrete data.
In a bar chart, the heights of the bars represent the frequencies, whereas in a histogram the area of the bars represent the frequencies.
To draw a histogram we need to find the frequency density of each class interval.
The frequency density (D) of a class interval is equal to the frequency (F) divided by the class width (W).
Step-by-step guide: Histograms
Sampling methods
Sampling methods are ways to select a sample of data from a given population (every individual in the whole group).
It is unrealistic to collect data from the entire population because it
- is too big
- takes too much time
- costs too much money.
We therefore take an appropriate sized sample as a way of representing the population.
Some sampling methods will be more suitable than others for different situations.
Whichever sampling method is used it is important to justify why that method has been used.
There are several types of probability sampling methods and non-probability sampling methods you should be aware of,
- Random sampling
- Stratified sampling
- Systematic sampling
- Non random sampling
- Capture recapture
Step-by-step guide: Types of sampling methods
Common misconceptions
- Mixing up the averages
Check if you have been asked for the median, mode or mean average.
- Ascending order
Check that the list of numbers is in numerical order before finding the median number.
- Using the endpoints, not the midpoints for frequency polygons
The coordinate must be plotted at the centre of each class interval, at the given frequency.
- Plotting at the midpoint of each class interval for a cumulative frequency graph
Points on a cumulative frequency graph are always plotted using the upper class boundary of each group – unlike a frequency polygon, which uses the midpoints.
- Frequency vs frequency density
A very common error that occurs in histogram questions is that the frequency is used instead of the frequency density. Frequency density must be found because the groups provided in the frequency table are usually not equal width.
Practice statistics maths questions
1. Annie conducted a survey in her class to find the favourite colour of her classmates. Which option best describes the type of data she found?
Primary and qualitative

Secondary and qualitative

Primary, quantitative and continuous
Primary, quantitative and discrete
She collected the data herself and the data is non-numerical.
2. Calculate the mean of the following set of numbers.
11 \quad \quad 12 \quad \quad 16 \quad \quad 19 \quad \quad 23
3. The stem and leaf diagram below represents a sample of the lengths of leaves from a tree.
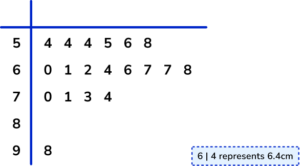
Which average would be least suitable to represent the data?
Median
Mean
Range
Mode
The mean would be the least suitable as there is a large outlier which will affect the value of the mean.
4. The frequency table shows the heights of 20 shrubs. Find the estimate for mean height.
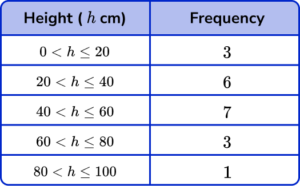
We need to multiply the heights by their frequencies to get the total height of all 20 shrubs.
\text{Mean}=\frac{\text{total}}{n}=\frac{(10\times 3)+(30\times 6)+(50\times 7)+(70\times 3)+(90\times 1)}{20}=\frac{860}{20}=43
The estimate of the mean is 43.
5. Below is a grouped frequency table for the length of 50 pieces of string. Calculate the two missing cumulative frequencies.
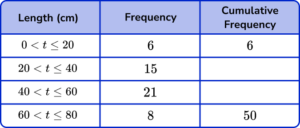
Add 15 to the 6 in the cumulative frequency column to get 21, then add 21 to that to get 42.
6. When drawing a histogram, which formula would correctly calculate the frequency density for a class interval?
The frequency density is the frequency per unit for the data in each class interval.
Statistics maths GCSE questions
1. A pie chart shows the proportion of people who answered Yes or No to a question. The ratio of “yes” answers to “no” answers is 5:7.
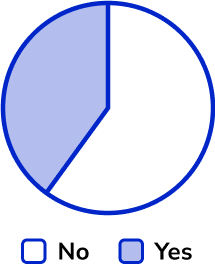
What is the angle of the “No” sector?
Circle your answer.
150^o \quad \quad \quad 7^o \quad \quad \quad 210^o \quad \quad \quad 230^o
(1 mark)
(1)
2. A class contains 14 boys and 13 girls. The mean height of 14 boys is 172 \ cm. The mean height of the whole class is 165 \ cm.
Find the mean height of the girls. Give your answer to two decimals places.
(3 marks)
Total height of the 14 boys (2408) or total height of the class (4455) .
(1)
Total height of the girls (2047) .
(1)
157.46 \ cm(1)
3. The histogram shows information about the time it took 348 people to complete a quiz. 160 people took between 16 and 20 seconds to complete the quiz.
What percentage of people took under 16 seconds to complete the quiz?
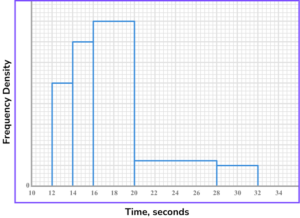
(4 marks)
(1)
(2\times{25})+(2\times{35})(1)
(120\div{348})\times{100}(1)
34.5\%(1)
The most popular lessons are
Still stuck?
Prepare your KS4 students for maths GCSEs success with Third Space Learning. Weekly online one to one GCSE maths revision lessons delivered by expert maths tutors.

Find out more about our GCSE maths tuition programme.