Primary School Grades Explained: Goodbye Levels, Hello Attainment, Achievement & Progress
Primary school grades and end of year reports can be hard to decipher sometimes. And, just when you’ve got a handle on primary school levels, the expectations of the British education system change. Here’s a quick guide to what you need to know to understand about the assessments teachers use in school to work out how your child is progressing.
Ultimately, we all want our children to be happy and healthy in early childhood. But we also know that the results of their primary school summative assessments in comparison to where they should be for their age is important in making sure they get the best start in life.
In this blog, we explain what parents need to know about primary school levels – including attainment levels at KS1 and KS2 and in the SATs – and what some of the terms you might hear used to describe assessment levels mean.
First, a quick guide to assessments and some of the jargon you may hear:
What is the current primary school grading system in the UK?
Following the DfE’s changes to the National Curriculum for England, Scotland, and Wales in 2014, most primary schools now have their own assessment levels.
These levels measure attainment and progress during your child’s time at school. But how they do this can vary from one academic year to another, EYFS to the end of key stage 1, high school to A Levels, and beyond!
Both public schools and independent schools will have their own grading systems for primary and secondary education, so understanding what all the different reports and levels mean, can be a real challenge.

FREE KS2 Maths SATs Practice Papers
Get ready for SATs with this set of 6 maths SATs practice papers. Papers designed to help your Year 6 improve test skills and confidence.
Download Free Now!Most primary school grading systems are based on an ‘age-related expectations’ grading system. Example attainment levels you might see in this system are:
- Working towards the expected standard for their age.
- Working at the expected standard for their age
- Working above the expected standard for their age (also called ‘Greater Depth’ level)
- Working below the expected standard for their age.
So a child who is struggling in a subject is considered to be “working below” or “working towards” the standard, and a child who is doing better than their peers is “working above” the standard.
Read more: KS1 Assessment Framework
KS1 and KS2 SATs grades explained
Under the new system, SATs attainment is based on a standardised score of 100 instead of levels across the country. This means that scoring 100 in SATs is the expected standard.
This standardised score is not the same as an average score, but is based on an “expected” attainment level calculated after the tests have been taken and all scores are analysed.
The standard is a ‘reasonable expectation’ of what a child should achieve at their age. So a child could score the following in their Year 6 SATs:
- Maths – 102
- English Reading – 104
- English Writing – 99
In this case, the attainment scores give us an idea of how the child compares to other children in the country.
With a standardised score of 100, the child in the example above has attained a score above the standard in Maths and English Reading, but not in English Writing (where they score just below 100).
At Key Stage 1 the lowest score possible is 85, and the highest is 115. At Key Stage 2 the lowest and highest possible scores are 80 and 120.
If you’re child is sitting their SATs this year, you can find out more about KS1 and K2 SATs scores here or delve deeper into what SATs are, and why children sit them at all in our guide to SATs.
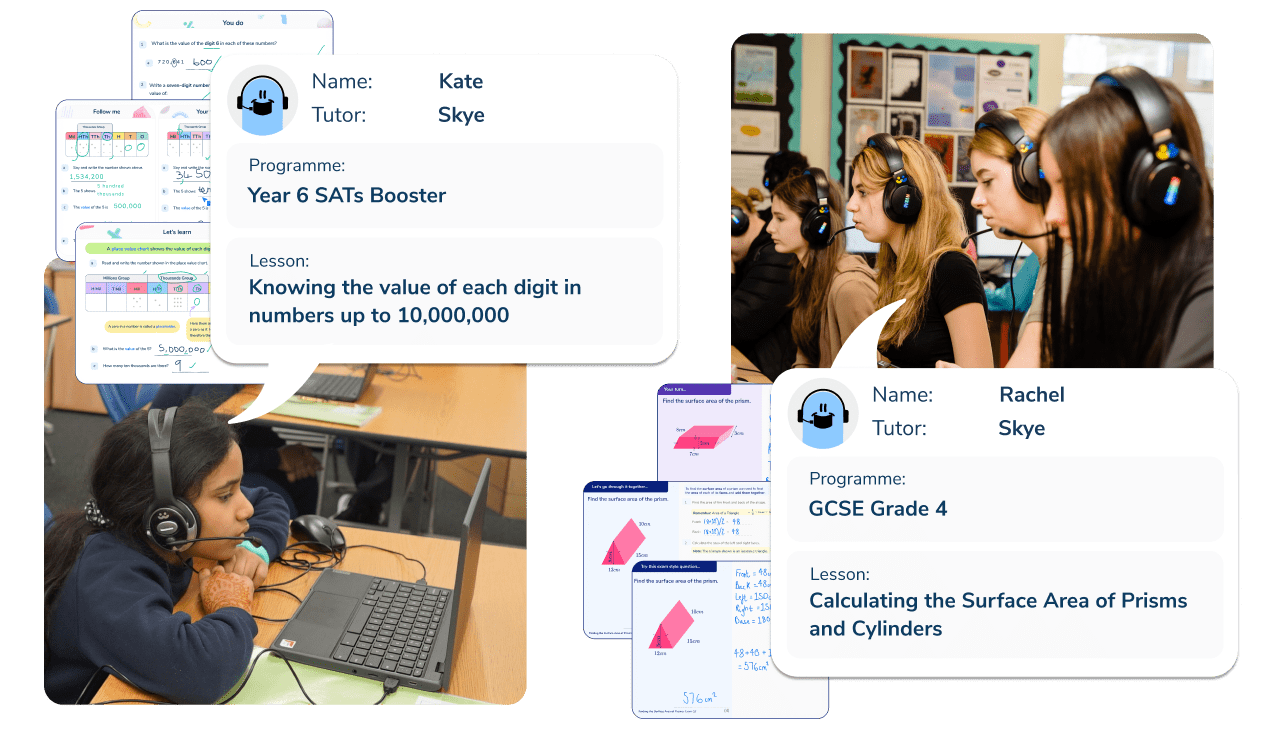
Meet Skye, the voice-based AI tutor making maths success possible for every student.
Built by teachers and maths experts, Skye uses the same pedagogy, curriculum and lesson structure as our traditional tutoring.
But, with more flexibility and a lower cost, schools can scale online maths tutoring to support every student who needs it.
Watch Skye in actionWhat do attainment, progress, and achievement really mean?
Attainment, progress, and achievement are key terminology used to describe primary school levels. But what do they really mean?
And how might they be used in school reports?
What is attainment in school?

Attainment, at a basic level, means “a result at a specific point in time”.
For example, teachers may do ‘little-and-often’ maths tests to see what children remember from the unit they’ve been learning, and this might be shown to parents as a mark out of a total possible score i.e. 40/50. This is their attainment score for that test.
This is a fairly easy result for parents to understand; we can work out what that score means, and if the children are given back their tests we can see where they went wrong and help them improve.
National assessments of primary school attainment
When we move to national testing, however, things get more complex. It can be harder for parents to know what the results mean for their child, as the type of score you get back is not as simple as a mark out of 10.
As we explained earlier, until September 2014, the UK used the ‘curriculum levels’ system at Key Stage 1, Key Stage 2 and Key Stage 3.
In this system, pupils were expected to reach certain levels at certain ages. For example, a Year 6 child was expected to be at Level 4. However, the department for education scrapped this grading system as they felt it was too vague.
The current primary school grading system uses a set of statements as assessment levels, such as “Working within the expected level of attainment”.
Schools will receive the individual score for each pupil but also their own results compared to the country. Nationally, perhaps 72% of all children taking the SATs will obtain a score of 100 or above in English Reading, but the school may have 80% of its students achieving a score of 100 or above. So, the school attainment is higher than the National Average for English Reading. These results are available via the Government school comparison website – but not until a few months after the test results are released.
In school grades for attainment scores
Your primary school grades and attainment scores will be based on national expectation,s but terminology for these in-school assessments may vary depending on whether they are commercially bought-in tests, which may have scaled scores or whether they are based on teacher assessment.
Attainment may be judged on what is happening in class rather than on a test. Because of this, assessment results will vary from school to school and could be named based on the year group your child is in and the time of the year the assessment is given.
These results only really make sense if the school can tell you what they expect from individual children and the rest of the class/year group, at that time.
This will tell you if a child is attaining a similar grade to their peers or not. If not, whether it is higher or lower than expected, then progress might be the vital measure for you to consider.
Your child’s school may not give you any type of score at all in between national tests – this is their choice, but you can expect to still get reports or information which shows you how well your child is doing, and what you can do to support them.
If the school’s attainment levels seem too confusing, a simple question for parents’ evening could be “Is their attainment average for their age?”
What is progress in school?

Progress is a measure which takes a child’s current attainment and compares it to their prior attainment.
This may or may not include a comparison to their peers to work out if this is classed as “good” progress, “expected” progress, or otherwise.
Read more: The Myth of Expected Progress in Primary Schools
For national results in the Key Stage 2 SATs (Year 6) progress is compared with their Key Stage 1 SATs results (from Year 2). This also takes into consideration the Key Stage 1 results for children who achieved the same score as them and their progress to Key Stage 2.
This is a complex calculation with our current system but essentially if your child’s attainment in the Key Stage 1 SATs was “Expected” for their age, then they would be expected to attain “Expected” at the Key Stage 2 SATs also.
That would be considered to be “expected” progress. If they attained an “Expected” result at Key Stage 1 but then did not meet the expected standard at Key Stage 2 then this would be considered “poor” progress.
But if they did not attain the expected standard at Key Stage 1 and achieved the “expected” standard at Key Stage 2 then they would have “good” or even “excellent” progress.
However, your child’s individual progress is not given out – these are calculated as one overall progress score for the school and is part of the school comparison dashboard.
So when does progress matter for your child individually?
Well, a simple example of progress would be our spelling test result again. If your child attained 7/10 last week and this week they attained an 8/10 then this shows progress. They got one more right which is an obvious measure of progress from last week to this week.
On a school report any progress marks will depend on the primary school’s grading system.
If they are using tests this may be recorded in results such as the spelling test examples, but students could also be given as a grade such as “Meeting” or “Secure” – meaning they are meeting the expected standard or they are secure in the expected curriculum content.
For progress this can then be trickier to work out. One child who is “Meeting” the standard could have made slow progress if they were previously attaining “Above” the standard.
Another child could have what is termed “accelerated” progress if they are now “Meeting” the standard but had previously not been meeting it for the term before.
If you are ever concerned or confused by what progress means with the terminology given by school then the most simple thing to ask is “Are they progressing as you would expect?” and their teacher will easily be able to answer this for you as your child’s progress expectations might not be useful when compared to the rest of the class.
What is achievement in school?

Achievement is a term used in school which takes into account both the attainment and progress of a pupil.
It looks at where they would expect them to be and charts them on a graph of some sort (at secondary school this is often called a “flight path” towards their expected GCSE target grades).
For example, a child who has special educational needs could well have attainment far below that of their age-related peers.
However, when the school takes their progress into account they can see that they are catching up fast and therefore they are achieving better than expected when you compare their attainment with their progress.
Conversely, a child who always achieved well above their peers could have a great attainment score according to the school’s grading system, but when compared with their progress it may show that they are not achieving as highly as might be expected from their previous scores.
Achievement is a way for schools, and individuals, to be recognised for their efforts and work towards a goal, even if the goal is not reached.
So a school which has a lower than National Average attainment score for English Reading could have a very high progress measure.
This achievement measure takes into account the ‘narrative’ of the attainment levels. Perhaps they have an intake of mostly pupils from disadvantaged backgrounds, for example, or a higher than average percentage of pupils joining the school late due to many children moving into and out of the area (near a military base for example).
So despite having low results overall in the SATs tests, this could represent faster progress than expected for those children.
How do attainment, progress, and achievement relate to each other?
To sum up how attainment, progress and achievement affect a child’s grades at primary school. here are some examples:
Child A scored highly on their Key Stage 1 SATs. That is good attainment in Key Stage 1. In the Key Stage 2 SATs they scored highly again. This is good attainment in Key Stage 2. This also shows average progress and expected achievement for this child.

Child B scored poorly in the Key Stage 1 SATs so has poor attainment in Key Stage 1. In the Key Stage 2 SATs, however, they scored highly.
This represents good attainment for Key Stage 2. It also shows accelerated progress from Key Stage 1 to Key Stage 2 and therefore is an excellent achievement for this child.

Child C scores poorly in the Key Stage 1 SATs so has poor attainment for Key Stage 1. They score the nationally expected standard in the Key Stage 2 SATs which represents average attainment for Key Stage 2.
Although their attainment is only average this is good progress for this child compared to their starting point so therefore still a very good achievement.

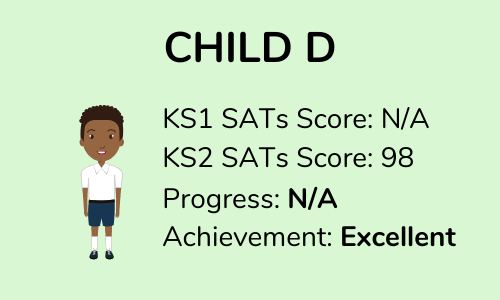
Child D did not take the Key Stage 1 SATs and started the school in Year 5, arriving from overseas and speaking no English on arrival at the school. They achieved below the expected standard in Key Stage 2 SATs but only missed the expected standard by 2 points.
This is classed as below expected attainment. They have no official progress score due to missing out on the Key Stage 1 SATs.
However, due to them starting with no English at all and only being 2 points off the expected standard this is still a really good achievement for this child and does show good progress even though there is no official score.
Although there are some changes which even teachers have to read up on from year to year with the national tests, the terminology of attainment, progress and achievement is always the same in schools. So if you have any questions for your child’s teacher you can frame them around these terms!
DO YOU HAVE STUDENTS WHO NEED MORE SUPPORT IN MATHS?
Skye – our AI maths tutor built by teachers – gives students personalised one-to-one lessons that address learning gaps and build confidence.
Since 2013 we’ve taught over 2 million hours of maths lessons to more than 170,000 students to help them become fluent, able mathematicians.
Explore our AI maths tutoring or find out about maths intervention programmes for your school.


