SATs Results And SATs Scores Explained For Teachers And Parents
Every year as the SATs results come in, thousands of teachers and parents are left wondering either how best to explain the SATs results or how to understand the individual SATS scores that children have received.
Here we explain what the KS1 and KS2 SATs results mean to help assess how the children and school have performed and what support they might need next.
Dotted throughout this SATs information are terms like “scaled score”, “standardised score”, “expected standard” and “national standard”. These will all be explained. Don’t worry!
SATS 2026: STAY UP TO DATE
Join our email list to stay up to date with the latest news and free resources for SATs 2026. As usual our expert teachers will be on hand to provide one to one tuition support, revision resources, expert paper analysis, SATs teacher survey results and the SATs results 2026.
How are SATs marked?
Depending on whether children are in Key Stage 1 (Year 2), or in Key Stage 2 (Year 6) when they sit them, SATs papers are marked differently.
How are KS1 SATs marked?
In Year 2, children now sit optional SATs tests in English and maths.
The child’s teacher marks these papers once all tests are complete. However, if the local authority selects the school, a small number of papers from the school are externally moderated.
This process assesses the quality and consistency of the marking in schools rather than the child’s work.
How are KS2 SATs marked?
In Year 6, children sit SATs in maths, English reading, English grammar, punctuation and spelling.
Key Stage 2 SATs marking differs from the Year 2 SATs. All Year 6 SATs papers are marked externally.
Pupils do not sit SATs for English writing or science. However, these subjects are teacher assessed against the national standards. For writing, the local authority selects a handful of schools each year for external moderation. Again, as with the Year 2 SATs, this is to asses the school’s marking rather than the child’s writing.
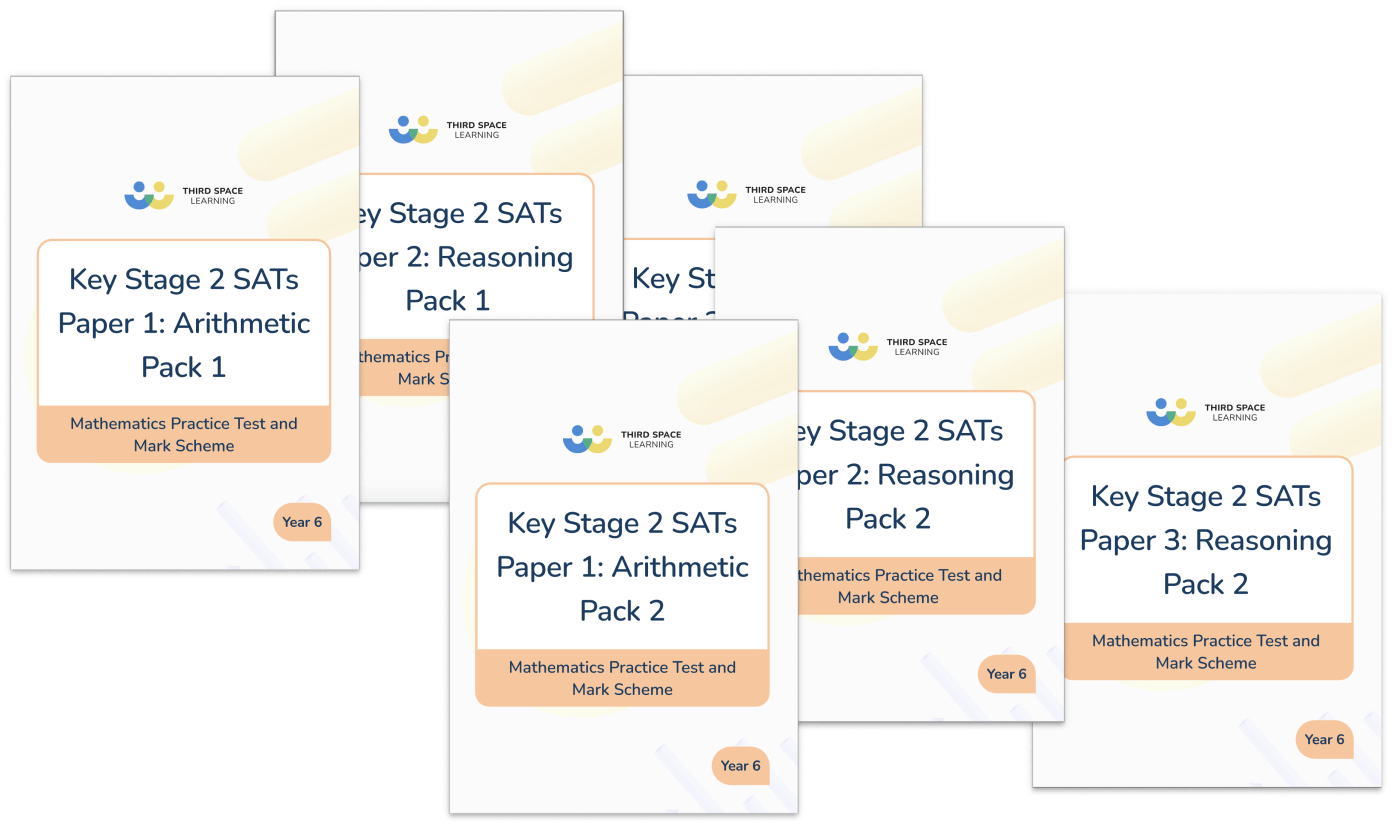
KS2 Maths SATs Practice Papers
Get ready for SATs with this set of 6 maths SATs practice papers. Papers designed to help your Year 6 improve test skills and confidence.
Download Free Now!When and how do schools receive SATs results?
Schools receive the provisional results for both the schools’ performance and each individual child’s SATs results by the end of July.
At this stage, the pupils’ results are only provisional. They are subject to additional checking by schools and teachers who may appeal any results where they have evidence that a pupil’s performance in the test is not reflected in their score.
KS1 SATs Results (Year 2)
In Year 2, it is uncommon to share raw scores for the KS1 SATs results with parents, this is at the school’s discretion. However, schools usually tell parents whether or not a child is working at the expected standard as part of the end-of-year teacher report.
KS2 SATs Results (Year 6)
Upon final confirmation of the Year 6 SATs results, it is up to schools to decide how they provide parents with individual test results.
Most schools normally send out an individual child’s results with the end-of-year report. But, this depends on whether all results are finalised before the end of term.
National Year 6 SATs Results
The following results and league tables or performance tables are usually published the following December but they can be as late as April:
- National SATs results
- Local Authority SATs results
- Individual school SATs results

Unlimited primary maths tutoring with Skye, the voice-based AI maths tutor.
Built on the same principles, pedagogy and curriculum as our traditional tutoring, but with more flexibility, reach and lower cost.
Join the schools already helping hundreds of primary pupils nationwide with Skye’s one to one maths tutoring.
Watch Skye in actionWhere to find the latest SATs results?
All the detail is available here: SATS results 2025.
KS2 SATs Results 2025
Here are the National SATs results 2025:
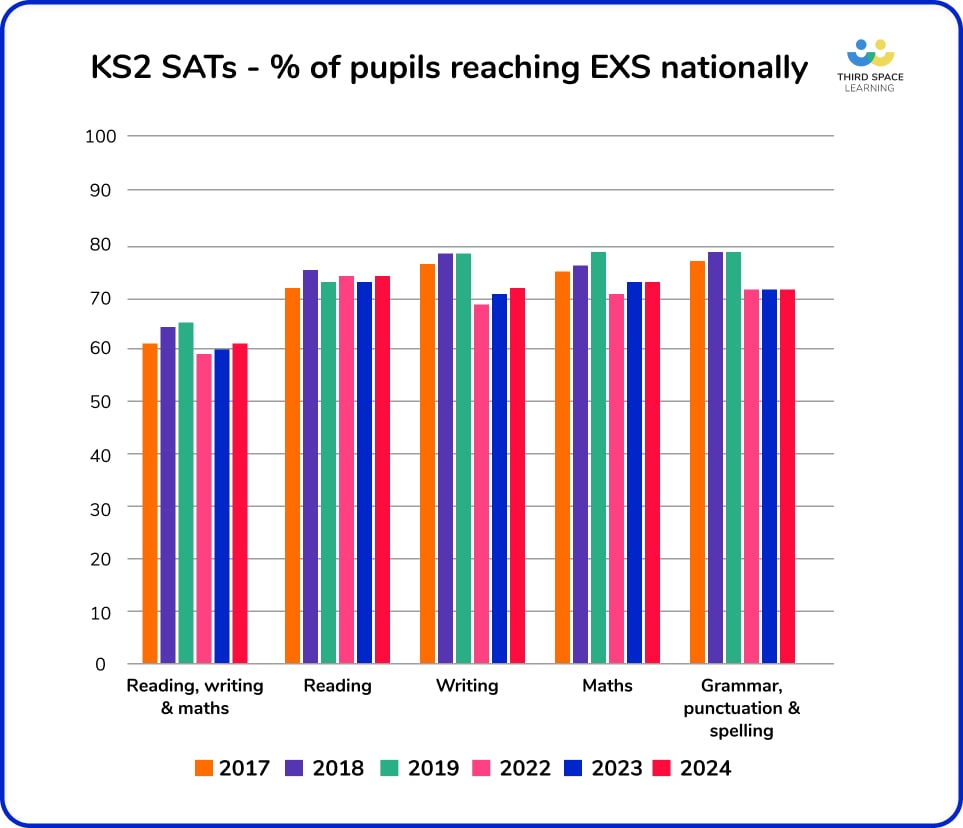
- 62% of pupils reached the expected standard in all of reading, writing and maths combined
- 75% of pupils reached the expected standard in reading
- 74% of pupils reached the expected standard in maths
- 72% of pupils reached the expected standard in writing
- 73% of pupils reached the expected standard in Grammar, Punctuation and Spelling (GPS)
KS2 SATs Results 2024
Here are the National SATs results 2024:
- 61% of pupils reached the expected standard in all of reading, writing and maths combined
- 74% of pupils reached the expected standard in reading
- 73% of pupils reached the expected standard in maths
- 72% of pupils reached the expected standard in writing
- 72% of pupils reached the expected standard in Grammar, Punctuation and Spelling (GPS)
KS2 SATs Results 2023
Here are the National SATs results 2023:
- 60% of pupils met the expected standard in reading, writing and maths combined
- 73% of pupils achieved the expected standard in reading
- 71% of pupils achieved the expected standard in writing
- 73% of pupils achieved the expected standard in mathematics
- 72% of pupils achieved the expected standard in Grammar, Punctuation and Spelling (GPS)
Comparison of National SATs Results from 2016 to 2023
GET THE ANALYSIS ON PREVIOUS SATS
SATs have been running in their current incarnation for 7 years; there were no government standardised assessments in 2020 and 2021 as a result of the Covid-19 pandemic. Get all the analysis and results from previous national assessments below.
And find out which are the top 20 year 6 maths revision topics to focus on this year.
– SATs papers 2025
– SATs results 2025
– SATs papers 2024
– SATs results 2024
– SATs papers 2023
– SATs results 2023
– SATs papers 2022
– SATs results 2022
– SATs papers 2019
– SATs results 2019
– SATs papers 2018
– SATs results 2018
– SATs papers 2017
– SATs results 2017
– SATs results 2016
What you need to know about the SATs results
The National SATs results record the percentage of pupils nationally who have met ‘the expected standard’ in the subject. This means they have achieved a scaled score of 100 or more. See below for more information on these.
School SATs results are much more variable than national results, so it’s not uncommon to see a drop or a rise of 30 or 40 points in percentage terms from one year to the next. Just 3 fewer children out of a class of 30 achieving the expected standard from one year to the next will mean 10% fewer have passed their SATs that year. And inevitably there are differences between cohorts in a school.
You may also see wide variation between scores in different subjects at a school. This is why the government introduced the ‘combined SATs score’ measure. It aims to ensure that formal bodies and parents look at schools for their overall success not just in their ability to get 100% of their children to reach the expected standard in only maths.
What do children’s individual SATs scores mean?
When attempting to understand SATs scores, one source of confusion is the change that took place for the 2016 SATs.
Scaled SATs scores replaced the national curriculum level used to score SATs papers in 2015 and previous years.
Globally school assessments use this scoring method. It is seen as a fair method for comparing test results. It allows for differences in the difficulty of tests on a year-by-year basis. In turn, this allows the government to compare different cohorts’ results.
SATs scores explained – how scaled scoring works
To begin, children receive a raw score. This is the actual number of marks a child achieved on their SATs.
Then, the raw score converts into a scaled score. A child’s scaled score judges how well a child has done on their SATs paper.
A range of scaled scores is available for both the KS1 and KS2 SATs.
In KS1, 85 is the lowest score available, and 115 is the highest.
In KS2, 80 is the lowest and 120 is the highest score.
Scaled scores are designed to ensure that examiners can make adjustments for inevitable variability in difficulty of different SATs papers from one year to the next and still be able to compare them. 100 is not the average but the expected threshold or ‘expected standard’ on a particular test.
For example in 2023 there were several complaints about the SATs reading paper as one of the reading tests was deemed to be extremely difficult compared to ‘expected’ levels of difficulty. As a result the expected score linked to the scaled score of ‘100’ was lower than expected.
You can read more about scaled scores on the DfE website.
check the difficulty and match across an expected threshold or ‘expected standard’ on a test.
What is a good SATs score or an expected SATs score?
Scaled scoring can often lead to confusion as to whether a child has attained a ‘good’ score in their SATs. However, once the KS1 and KS2 SATs scores are explained, the system is quite simple to understand.
What is defined as a ‘good’ SATs score depends on the individual child and their starting point. For example, a scaled score of 90 is a great achievement for some pupils.
SATs scores for KS1
115 – This is the highest scaled score available in the KS1 SATs.
101-114 – Any score above 100 (including 115) means that a child has met or exceeded the expected standard in the test. There is no clear score as to when a child ‘exceeds’ the expected standard.
100 – This is the expected standard for children (and essentially means they are working at an age-related expectation).
85-99 – Any child awarded a scaled score of 99 or below has not met the expected standard in their KS1 SATs. Often, schools refer to these children as ‘working towards the expected standard’.
Further reading: Department for Education (DfE) guidance on scaled scores at KS1
SATs scores for KS2
120 – This is the highest score available in the KS2 SATs.
101-119 – Any score above 100 (including 120) means that a child has exceeded the expected standard in the test. Again, there is no clear score as to when a child ‘exceeds’ the expected standard.
100 – This is the expected standard for children (and essentially means they are working at an age-related expectation).
80-99 – Any child awarded a scaled score of 99 or below has not met the expected standard in their KS2 SATs. Often, schools refer to these children as ‘working towards the expected standard’.
Further reading: Department for Education (DfE) guidance on scaled scores at KS2
KS1 SATs scores in detail
In KS1, children receive a scaled score detailing their achievements in the SATs.
If they receive a scaled score of 100, they are working at the expected standard.
A scaled score of 100 or more means they are working above the expected standard.
If a child receives a scaled score of 99 or less, it indicates they are working below the expected standard and may need additional help in maths or English.
The government provides schools with a conversion table to convert each child’s raw score into a scaled score. This then forms part of the end-of-year teacher assessment. Consequently, this could result in the child’s report score not purely reflecting their SATs score, but also influenced by classwork and teacher observations.
KS2 SATs scores in detail
In Year 6, external assessors mark the SATs papers. Teachers are not involved in the assessment.
Children receive a raw score, a scaled score and an indication of whether or not they are working at the expected standard. It is unlikely schools share a child’s raw score with parents, but they may share their scaled score and a code that indicates the outcome of their test.
The KS2 outcomes codes that you may see are:
- AS: This means that a child has achieved the expected standard.
- NS: This means that a child has not achieved the expected standard.
- A: This means a child was absent from one or more test papers.
- B: This means that a child is working below the level assessed by the KS2 SATs.
- M: This means that a child missed the test.
- T: This means that a child is working at the level of the tests, but is unable to access them (this could be due to all or part of a test not being suitable for a child with particular special educational needs).
Year 6 teacher assessment SATs results
In addition to the KS2 SATs results, children also get teacher assessment results for reading, writing, mathematics and science. The codes on this report are different to the SATs report. The main codes include:
- GDS: A child is working at greater depth within the expected standard. This is for writing assessments only.
- EXS: A child is working at the expected standard.
- WTS: A child is working towards the expected standard.
- HNM: A child has not met the expected standard. This is used for reading and maths assessments only.
- PKG: This stands for pre-key stage, growing development of the expected standard. This means that a child is working at a level lower than expected.
- PKF: This stands for pre-key stage, foundations for the expected standard. This means that a child is working at a level significantly lower than expected.
- BLW: A child is working below the pre-key stage standards, the lowest level of attainment.
- A: This is what you will see if a child is absent.
- B: This means a child is disapplied and they have not been tested at the KS2 level.
Some schools may have other acronyms that they use in their reports. If there are any terms that you are unaware of for the end of year report at KS2, do not hesitate to ask your headteacher or senior leader who will be more than happy to clear up any confusion.
What do secondary schools do with SATs results?
Secondary schools receive the scaled SATs scores of their incoming pupils. Often, they’ll use them to stream children coming into Year 7. However, this will vary from school to school.
Some secondary schools use a combination of SATs scores and their internal tests to stream students. Make parents aware of this if they need to give their child extra support over the summer before the transition to secondary school.
What happens in the other primary school years?
In Years 1, 3, 4 and 5 children do not sit any SATs, nor should they sit practice papers as they have not yet learned all of the content.
This means that they do not receive a scaled score and instead receive an assessment from a school’s internal grading system.
For most schools, this is likely measured on expected levels, with a child being either at the expected level, above or below the expected level.
While children do not sit SATs in these year groups, pupils in Year 1 sit the phonics assessment to assess their reading ability and pupils in Year 4 sit the multiplication times table check to assess mathematical fluency of the times tables.
How to help your pupils achieve the best possible SATs results
Here at Third Space Learning, we know that preparing for SATs can be a daunting prospect. But the good news is, it doesn’t have to be…
Since 2013, Third Space Learning has provided maths tutoring for the pupils who need it most.
A team of academic experts created the SATs Revision Programme to help prepare Year 6 pupils for SATs. Every year, this programme is updated with the latest pedagogical research and teaching strategies to help your pupils succeed.
Pupils work through maths SATs-style questions with Skye, the AI maths tutor, at a pace that suits them.
Discover Third Space Learning’s SATs success stories!
DO YOU HAVE STUDENTS WHO NEED MORE SUPPORT IN MATHS?
Skye – our AI maths tutor built by teachers – gives students personalised one-to-one lessons that address learning gaps and build confidence.
Since 2013 we’ve taught over 2 million hours of maths lessons to more than 170,000 students to help them become fluent, able mathematicians.
Explore our AI maths tutoring or find out about year 6 SATs for your school.


![The Top 20 SATs Revision Topics For 2026 [Video]](https://thirdspacelearning.com/wp-content/uploads/2026/01/SATs-webinar-2025-social-image-6-180x160.png)


