GCSE Tutoring Programme
Our chosen students improved 1.19 of a grade on average - 0.45 more than those who didn't have the tutoring.
In order to access this I need to be confident with:
Fractions Fractions, decimals and percentages Decimals Relative frequencyThis topic is relevant for:

Experimental Probability
Here we will learn about experimental probability, including using the relative frequency and finding the probability distribution.
You can also download the following free experimental probability resources all suitable for those following Edexcel, AQA or OCR exam boards:
What is experimental probability?
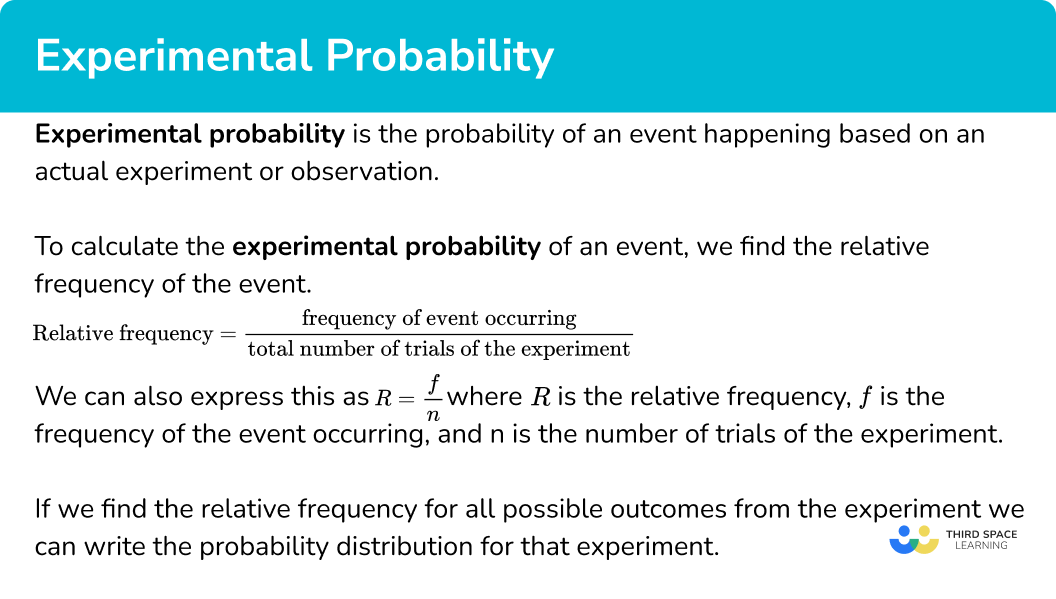
Experimental probability is the probability of an event happening based on an experiment or observation.
To calculate the experimental probability of an event, we calculate the relative frequency of the event.
\text{Relative frequency = }\frac{\text{frequency of event occurring}}{\text{total number of trials of the experiment}}
We can also express this as R=\frac{f}{n} where R is the relative frequency, f is the frequency of the event occurring, and n is the number of trials of the experiment.
If we find the relative frequency for all possible events from the experiment we can write the probability distribution for that experiment.
The relative frequency, experimental probability and empirical probability are the same thing and are calculated using the data from random experiments. They also have a key use in real-life problem solving.
For example, Jo made a four-sided spinner out of cardboard and a pencil.
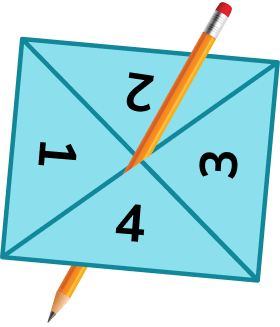
She spun the spinner 50 times. The table shows the number of times the spinner landed on each of the numbers 1 to 4. The final column shows the relative frequency.
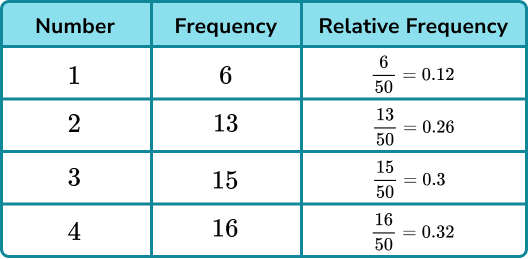
The relative frequencies of all possible events will add up to 1.
0.12 + 0.26 + 0.3 + 0.32 = 1
This is because the events are mutually exclusive.
Step-by-step guide: Mutually exclusive events
What is experimental probability?
Experimental probability vs theoretical probability
You can see that the relative frequencies are not equal to the theoretical probabilities we would expect if the spinner was fair.
If the spinner is fair, the more times an experiment is done the closer the relative frequencies should be to the theoretical probabilities.
In this case the theoretical probability of each section of the spinner would be 0.25, or \frac{1}{4}.
Step-by-step guide: Theoretical probability
How to find an experimental probability distribution
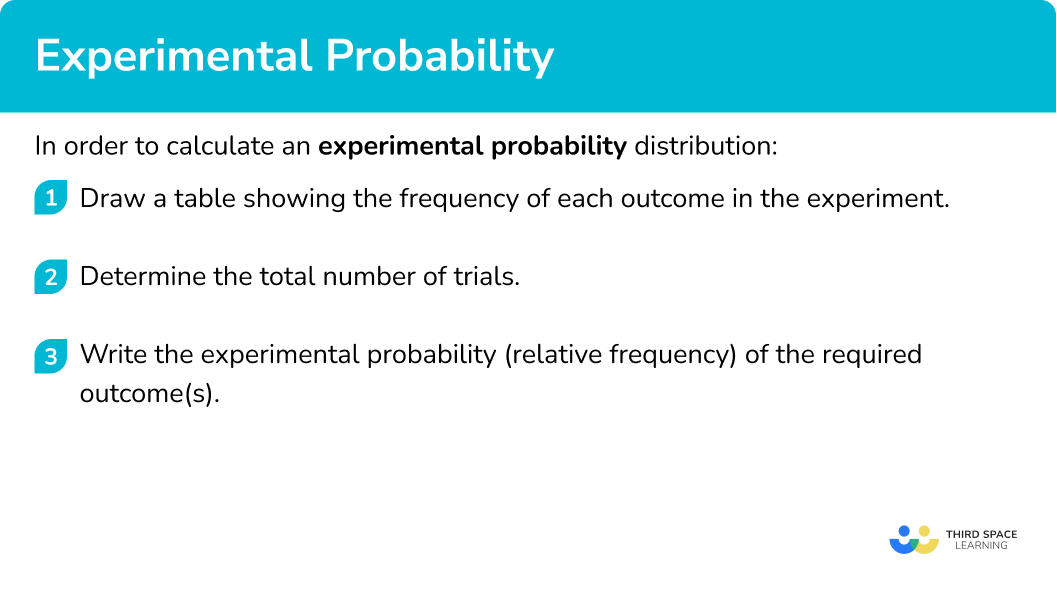
In order to calculate an experimental probability distribution:
- Draw a table showing the frequency of each outcome in the experiment.
- Determine the total number of trials.
- Write the experimental probability (relative frequency) of the required outcome(s).
Explain how to find an experimental probability distribution

Experimental probability worksheet
Get your free experimental probability worksheet of 20+ questions and answers. Includes reasoning and applied questions.
DOWNLOAD FREE Experimental probability worksheet
Get your free experimental probability worksheet of 20+ questions and answers. Includes reasoning and applied questions.
DOWNLOAD FREERelated lessons on probability distribution
Experimental probability is part of our series of lessons to support revision on probability distribution. You may find it helpful to start with the main probability distribution lesson for a summary of what to expect, or use the step by step guides below for further detail on individual topics. Other lessons in this series include:
Experimental probability examples
Example 1: finding an experimental probability distribution
A 3 sided spinner numbered 1,2, and 3 is spun and the results recorded.
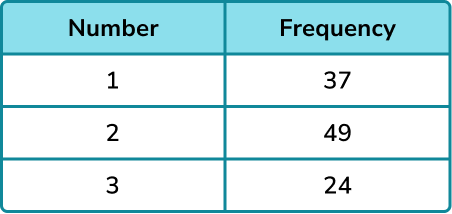
Find the probability distribution for the 3 sided spinner from these experimental results.
- Draw a table showing the frequency of each outcome in the experiment.
A table of results has already been provided. We can add an extra column for the relative frequencies.
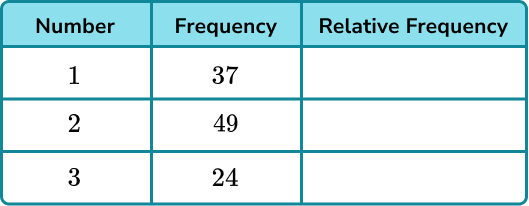
2Determine the total number of trials
37 + 49 + 24 = 110
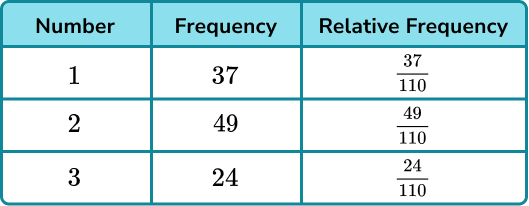
3Write the experimental probability (relative frequency) of the required outcome(s).
Divide each frequency by 110 to find the relative frequencies.
Example 2: finding an experimental probability distribution
A normal 6 sided die is rolled 50 times. A tally chart was used to record the results.

Determine the probability distribution for the 6 sided die. Give your answers as decimals.
Use the tally chart to find the frequencies and add a row for the relative frequencies.
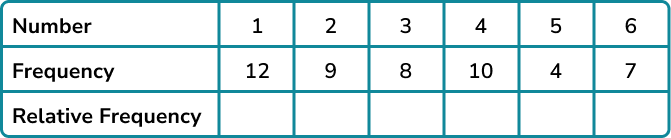
The question stated that the experiment had 50 trials. We can also check that the frequencies add to 50.
Divide each frequency by 50 to find the relative frequencies.
Example 3: using an experimental probability distribution
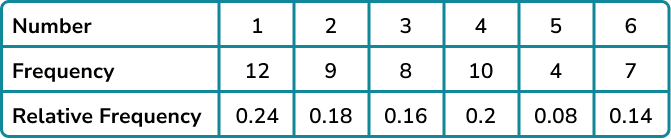
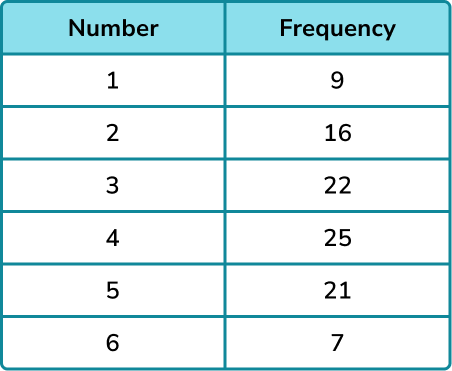
A student made a biased die and wanted to find its probability distribution for use in a game. They rolled the die 100 times and recorded the results.
By calculating the probability distribution for the die, determine the probability of the die landing on a 3 or a 4.
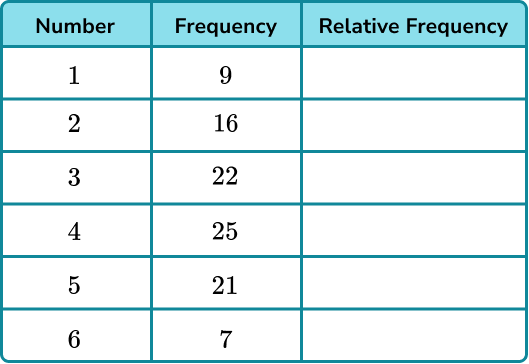
A table of results has already been provided. We can add an extra column for the relative frequencies.
The die was rolled 100 times.
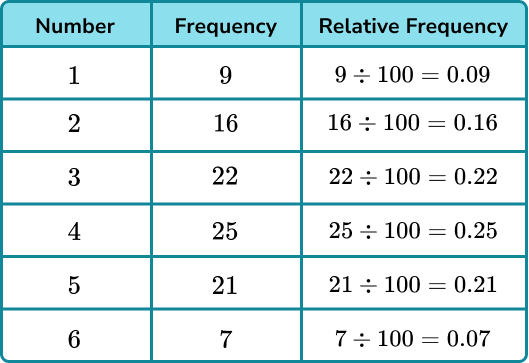
We can find the probability of rolling a 3 or a 4 by adding the relative frequencies for those numbers.
P(3 or 4) = 0.22 + 0.25 = 0.47
Example 4: calculating the relative frequency without a known frequency of outcomes
A research study asked 1200 people how they commute to work. 640 travelled by car, 174 used the bus, and the rest walked. Determine the relative frequency of someone not commuting to work by car.
Writing the known information into a table, we have
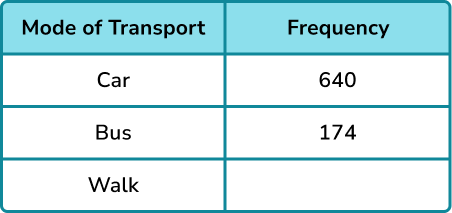
We currently do not know the frequency of people who walked to work. We can calculate this as we know the total frequency.
The number of people who walked to work is equal to
1200-(640+174)=386.
We now have the full table,
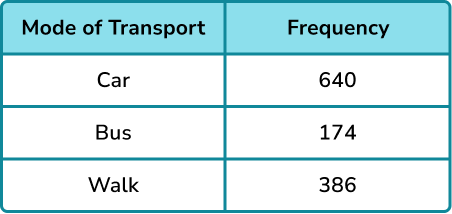
The total frequency is 1200.
Divide each frequency by the total number of people (1200), we have
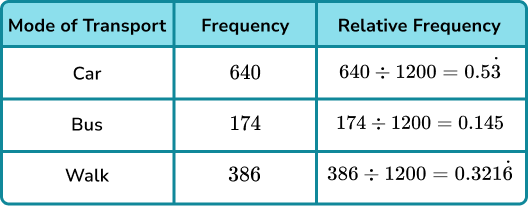
The relative frequency of someone walking to work is 0.321\dot{6} .
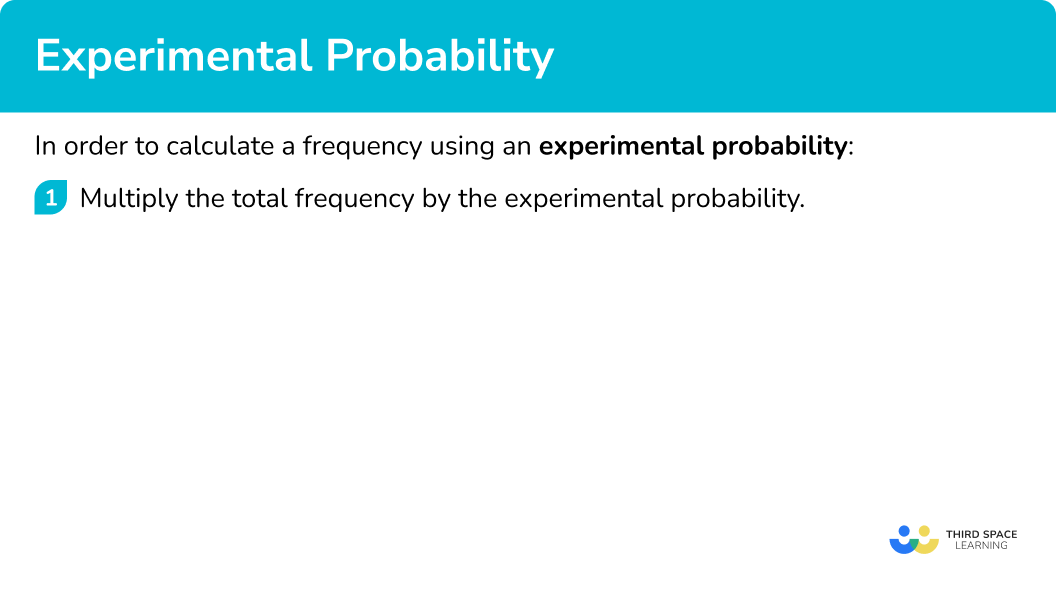
How to find a frequency using an experimental probability
In order to calculate a frequency using an experimental probability:
- Multiply the total frequency by the experimental probability.
Explain how to find a frequency using an experimental probability
Example 5: calculating a frequency
A dice was rolled 300 times. The experimental probability of rolling an even number is \frac{27}{50}. How many times was an even number rolled?
300\times\frac{27}{50}=6\times{27}=162
An even number was rolled 162 times.
Example 6: calculating a frequency
A bag contains different coloured counters. A counter is selected at random and replaced back into the bag 240 times. The probability distribution of the experiment is given below.
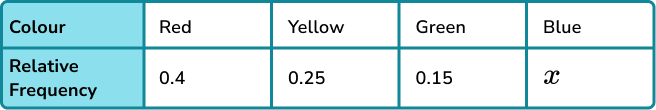
Determine the number of times a blue counter was selected.
As the events are mutually exclusive, the sum of the probabilities must be equal to 1. This means that we can determine the value of x.
1-(0.4+0.25+0.15)=0.2
The experimental probability (relative frequency) of a blue counter is 0.2.
Multiplying the total frequency by 0.1, we have
240 \times 0.2=48.
A blue counter was selected 48 times.
Common misconceptions
- Forgetting the differences between theoretical and experimental probability
It is common to forget to use the relative frequencies from experiments for probability questions and use the theoretical probabilities instead.
For example, they may be asked to find the probability of a die landing on an even number based on an experiment and the student will incorrectly answer it as 0.5.
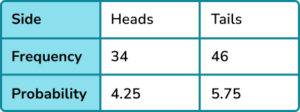
- The relative frequency is not an integer
The relative frequency is the same as the experimental probability. This value is written as a fraction, decimal or percentage, not an integer.
Practice experimental probability questions
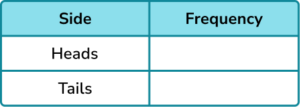
1. A coin is flipped 80 times and the results recorded.
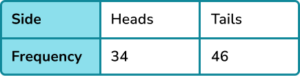
Determine the probability distribution of the coin.
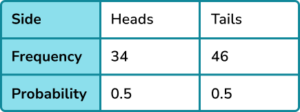

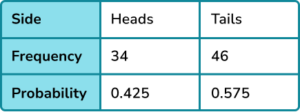

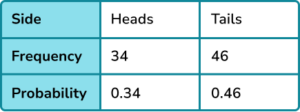
As the number of tosses is 80, dividing the frequencies for the number of heads and the number of tails by 80, we have
34\div{80}=0.425
46\div{80}=0.575
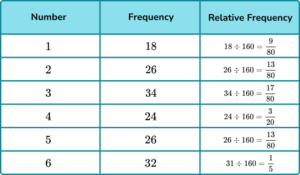
2. A 6 sided die is rolled 160 times and the results recorded.
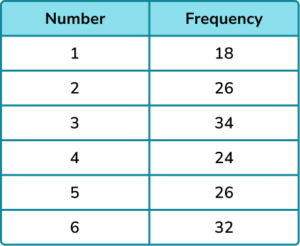
Determine the probability distribution of the die. Write your answers as fractions in their simplest form.
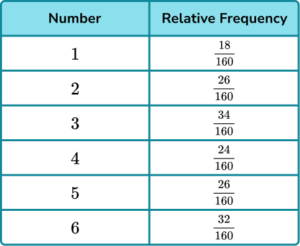
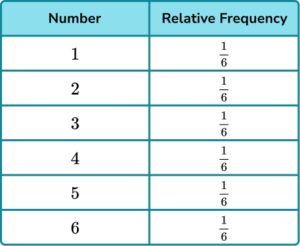
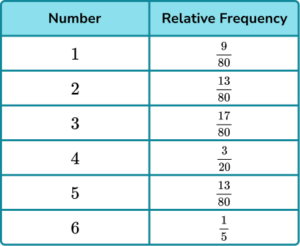
Dividing the frequencies of each number by 160, we get
3. A 3 -sided spinner is spun and the results recorded.
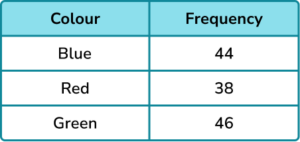
Find the probability distribution of the spinner, giving you answers as decimals to 2 decimal places.
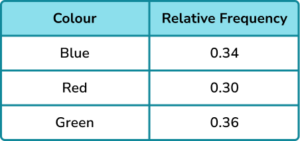
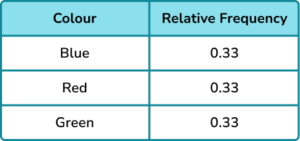
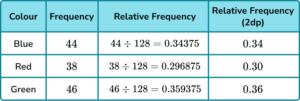
Dividing the frequencies of each colour by 128 and simplifying, we have
4. A 3 -sided spinner is spun and the results recorded.
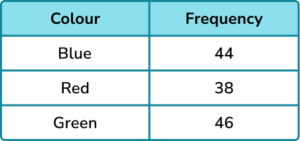
Find the probability of the spinner not landing on red. Give your answer as a fraction.
Add the frequencies of blue and green and divide by 128.
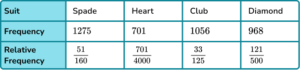
5. A card is picked at random from a deck and then replaced. This was repeated 4000 times. The probability distribution of the experiment is given below.

How many times was a club picked?
6. Find the missing frequency from the probability distribution.
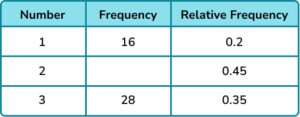
The total frequency is calculated by dividing the frequency by the relative frequency.
16\div{0.2}=80
80-(16+28)=36
Experimental probability GCSE questions
1. A 4 sided spinner was spun in an experiment and the results recorded.
(a) Complete the relative frequency column. Give your answers as decimals.
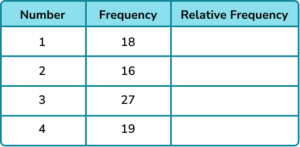
(b) Find the probability of the spinner landing on a square number.
(5 marks)
(a)
Total frequency of 80.
(1)
2 relative frequencies correct.
(1)
All 4 relative frequencies correct 0.225, \ 0.2, \ 0.3375, \ 0.2375.
(1)
(b)
Relative frequencies of 1 and 4 used.
(1)
0.4625 or equivalent
(1)
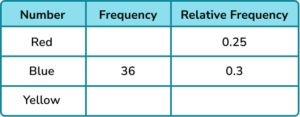
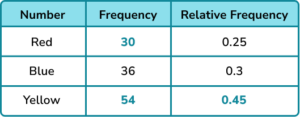
2. A 3 sided spinner was spun and the results recorded.
Complete the table.
(4 marks)
(1)
Process to find total frequency or use of ratio with 36 and 0.3.
(1)
30(1)
54(1)
3. Ben flipped a coin 20 times and recorded the results.
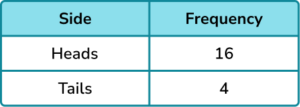
(a) Ben says, “the coin must be biased because I got a lot more heads than tails”.
Comment on Ben’s statement.
(b) Fred takes the same coin and flips it another 80 times and records the results.
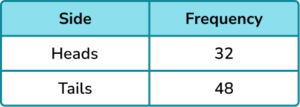
Use the information to find a probability distribution for the coin.
(6 marks)
(a)
Stating that Ben’s statement may be false.
(1)
Mentioning that 20 times is not enough trials.
(1)
(b)
Evidence of use of both sets of results from Ben and Fred.
(1)
Process of dividing by 100.
(1)
P(heads) = 0.48 or equivalent
(1)
P(tails) = 0.52 or equivalent
(1)
Learning checklist
You have now learned how to:
The next lessons are
Still stuck?
Prepare your KS4 students for maths GCSEs success with Third Space Learning. Weekly online one to one GCSE maths revision lessons delivered by expert maths tutors.

Find out more about our GCSE maths tuition programme.