GCSE Tutoring Programme
Our chosen students improved 1.19 of a grade on average - 0.45 more than those who didn't have the tutoring.
In order to access this I need to be confident with:
Fractions, decimals and percentages Multiplying decimals Fractions of amounts Percentage of an amountThis topic is relevant for:

Expected Frequency
Here we will learn about expected frequency, including what it is and how to calculate it.
There are also probability distribution worksheets based on Edexcel, AQA and OCR exam questions, along with further guidance on where to go next if you’re still stuck.
What is expected frequency?
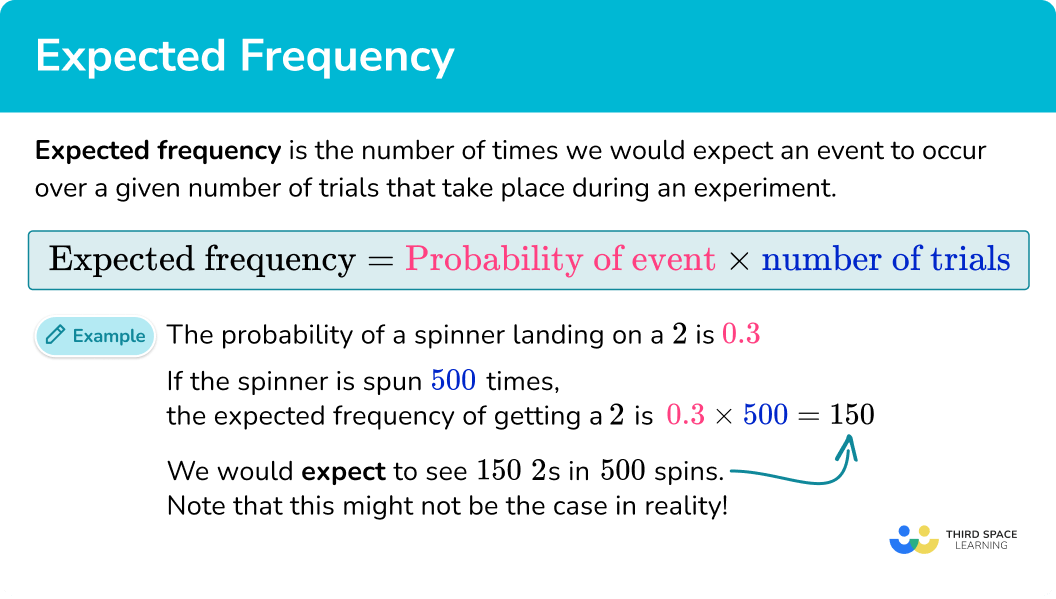
Expected frequency is the number of times we would expect an event to occur over a given number of trials that take place during an experiment.
To find the expected frequency, we multiply the probability of that event taking place by the number of trials of the experiment.
\text{Expected frequency = probability of event }\times \text{ number of trials}
For example,
The probability of a spinner landing on a ‘2’ is 0.3.
Therefore if the spinner is spun 500 times, the expected frequency of getting a ‘2’ is
0.3\times 500=150 .
We would expect to get a ‘2’ \ 150 times.
In reality, it is unlikely that the spinner will land on ‘2’ exactly 150 times as it is down to chance but this is a best estimate.
What is expected frequency?
Expected Value
You may need to use the expected frequencies to find an expected value.
For example,
A game at an amusement arcade has different cash prizes.
The probabilities for winning each cash prize are shown in the table.
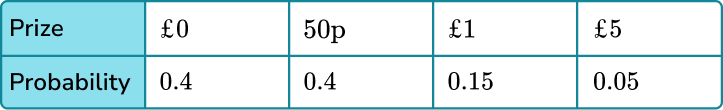
It is £1 to play the game and Jonny decides to play the game 40 times.
What is the expected value that Jonny will win in total?
Jonny expects to win £0 on 0.4 \times 40=16 occasions.
He expects to win 50p on 0.4 \times 40=16 occasions. 16 \times 50p=£8.
He expects to win £1 on 0.15 \times 40=6 occasions. £1 \times 6=£6.
He expects to win £5 on 0.05 \times 40=2 occasions. £5 \times 2=£10.
In total he expects to win £8 + £6 + £10 = £24.
As he spent £40 playing the game, he will make a loss of £40 - £24 = £16 .
How to find expected frequency
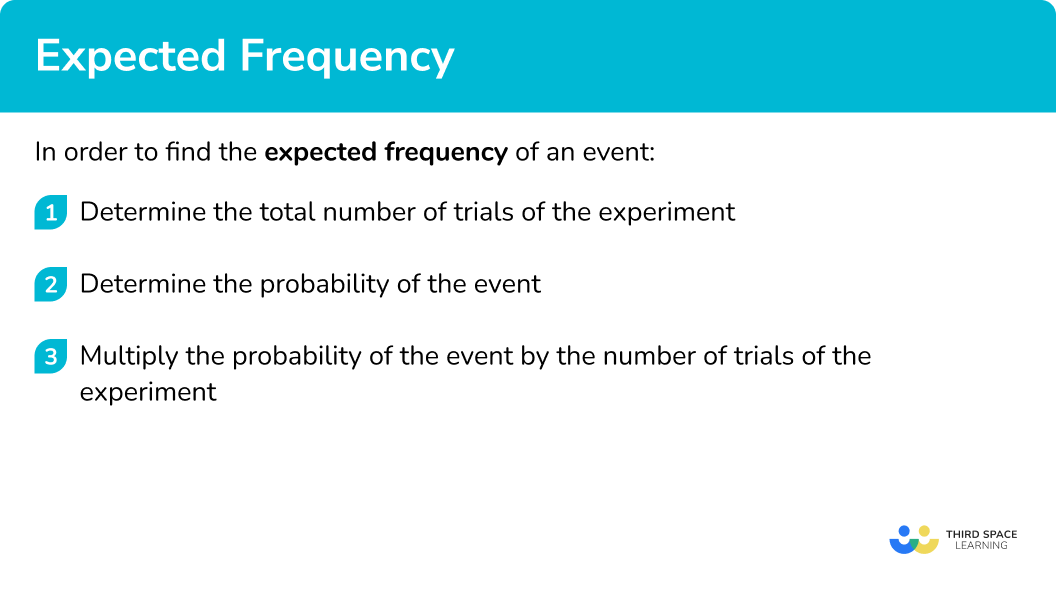
In order to find the expected frequency of an event:
- Determine the total number of trials of the experiment.
- Determine the probability of the event.
- Multiply the probability of the event by the number of trials of the experiment.
Explain how to find expected frequency
Probability distribution worksheet (includes expected frequency)
Get your free expected frequency worksheet of 20+ probability distribution questions and answers. Includes reasoning and applied questions.
DOWNLOAD FREE Probability distribution worksheet (includes expected frequency)
Get your free expected frequency worksheet of 20+ probability distribution questions and answers. Includes reasoning and applied questions.
DOWNLOAD FREERelated lessons on probability distribution
Expected frequency is part of our series of lessons to support revision on probability distribution. You may find it helpful to start with the main probability distribution lesson for a summary of what to expect, or use the step by step guides below for further detail on individual topics. Other lessons in this series include:
Expected frequency examples
Example 1: decimal probability
The probability that Sam will win a game of tennis is 0.7. If Sam plays 80 games of tennis, how many can he expect to win?
- Determine the total number of trials of the experiment.
The number of trials is 80.
2Determine the probability of the event.
The probability of Sam winning is 0.7.
3Multiply the probability of the event by the number of trials of the experiment.
Expected frequency =0.7\times 80=56.
Sam can expect to win 56 games.
Example 2: fractional probability
The probability that a biased coin will show tails is \frac{3}{8}. If the coin is flipped 400 times, how many times can it be expected to show tails?
The number of trials is 400.
The probability of the coin showing tails is \frac{3}{8}.
Expected frequency of tails = \frac{3}{8}\times 400=150.
Example 3: percentage probability
The probability that a biased 6 sided die will land on a 5 is 35\%. If the die is rolled 200 times, estimate how many times it will not land on 5?
The number of trials is 200.
The probability of the die not landing on 5 is 100\%-35\% = 65\%.
Expected frequency of not 5 = 65\% of 200 = 130.
Example 4: calculating expected frequency from another frequency
There are a number of coloured counters in a bag. This table shows the probability of picking each colour counter from the bag.
Lucy performs an experiment where she takes a counter, notes its colour and replaces it.
She repeats this experiment a number of times.
Lucy picks out a yellow counter 12 times. Estimate how many times Lucy picks out a red counter.
We know that there are 12 yellow counters and the probability of selecting a yellow counter is 0.2. Use the formula
\text{Expected frequency = probability of event }\times \text{ number of trials} .
12=0.2\times \text{number of trials}
\text{Number of trials} = \frac{12}{0.2}=60
The probability of selecting red is 0.15.
Expected number of red counters =0.15\times 60=9.
Common misconceptions
- Dividing the number of trials by the probability
A common error is for students to divide the number of trials by the probability to find the excerpt frequency. It is important to think of the probability as a proportion of the number of trials.
If P(red) = 0.3, it means that 30\% of the number of trials would be expected to be red, therefore if there were 200 trials we would need to find 30\% of 200.
Practice expected frequency questions
1) Hollie sows 30 seeds.
The probability of a seed growing is 0.8.
Estimate the number of seeds that grow.


2) The probability of getting heads on a biased coin is \frac{3}{5}. If the coin is flipped 200 times, how many times would we expect it to show heads.
3) The probability of a biased die landing on the number 2 is 36\%. If the die is rolled 4000 times, find an estimate for the number of times it will land on a 2.
4) An experiment showed that the probability of selecting a blue counter from a bag of coloured counters is 0.39. If the same experiment is repeated 2000 times, how many occasions would we expect to not select a blue counter.
5) The probability of a 4 sided spinner landing on the number 2 is 0.3. The spinner is spun n times and lands on the number 2 on 150 occasions. Find an estimate for n.
\begin{aligned} 150&=0.3 \times n\\\\ 150 \div 0.3 &=n\\\\ 500 &=n \end{aligned}
6) A bag contains red, yellow and green counters.
This table shows the probability of picking each colour counter from the bag.

During an experiment, 12 yellow counters are picked from the bag. Estimate the number of red counters that are picked.
The total number of trials was 80.
Number of red counters = 0.4 \times 80=32.
Expected frequency GCSE questions
1. The probability that a school bus will be late is 0.2.
Estimate the number of times the school bus will be late over a period of 80 days.
(2 marks)
(1)
16(1)
2. The probability that a biased coin lands on heads or tails is shown in this table.
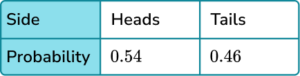
The coin is flipped 600 times. Estimate the number of times it will show tails.
(2 marks)
(1)
276(1)
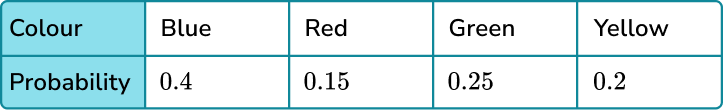
3. A bag contains a number of counters. This table shows the probability of picking each colour counter from the bag.
![]()
A counter is picked 400 times.
Calculate an estimate for the number of times a yellow or blue counter is picked.
(3 marks)
(1)
0.35 \times 400 or equivalent calculation.
(1)
140(1)
Learning checklist
You have now learned how to:
The next lessons are
Still stuck?
Prepare your KS4 students for maths GCSEs success with Third Space Learning. Weekly online one to one GCSE maths revision lessons delivered by expert maths tutors.

Find out more about our GCSE maths tuition programme.