

Teaching Statistics And Data Handling KS2: A Guide For Primary School Teachers From Year 3 To Year 6
Statistics (and data handling in general), while an important area of KS2 maths, makes up a small percentage of the overall objectives in the KS2 curriculum.
That said, it is still important to give it our full and undivided attention. Done well, the area of statistics allows teachers to embed other mathematical ideas such as addition and subtraction, begin to develop other areas of mathematical thinking, and help pupils see the clear links to science, particularly the ‘working scientifically’ objectives.
Looking for lesson ideas for a specific year? Find it in the contents list below!
Teaching statistics and data handling KS2 – Before you begin…
It is worth noting that the KS2 maths curriculum introduced in 2014 brings statistics to Year 2 for the very first time. It is worthwhile for the Year 3 teacher to look at those objectives and ensure that the students in your class are secure with the ideas and data handling activities from Year 2 (e.g. tally charts, Carroll diagrams and basic types of graphs).
Finally, in terms of time management, it is worth bearing in mind that many objectives specify the interpretations and presenting of data and not the collection of data.
Teachers should think carefully if using a whole maths lesson to collect data is the best use of time or if links can be made to other areas of the curriculum where data has already been collected or given – for example, place value and decimals are both topics that offer data collection opportunities.
Looking for some ideas of how to do this? Check out Neil’s blog on teaching place value at KS2, or our collection of place value worksheets.

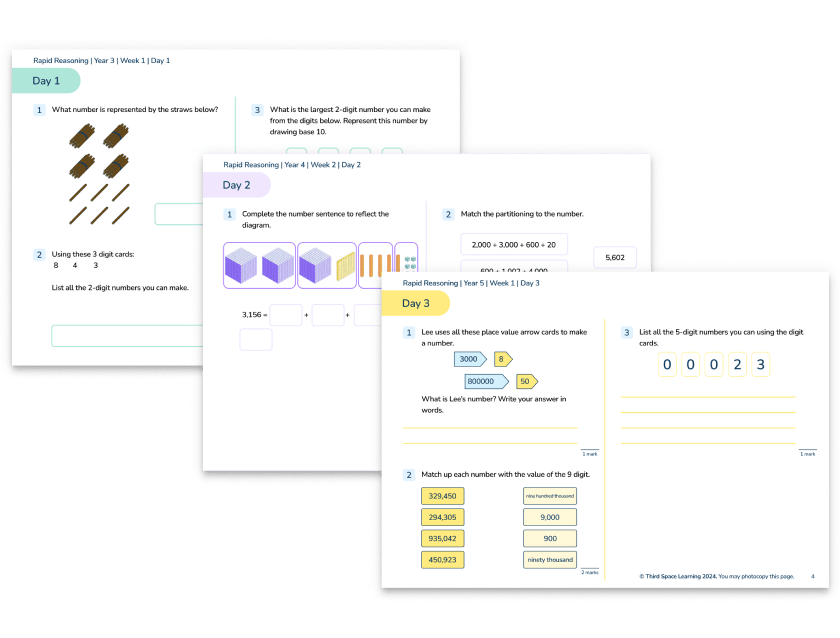
Statistics Independent Recap Worksheets
Help your Year 4 (and older) students revise statistics with our free Independent Recap worksheets.
Download Free Now!Statistics and Data Handling Year 3
In the National Curriculum for maths in England, for each area of maths outlined, there is both a statutory requirement and a non-statutory requirement regardless of scheme of work. The statutory requirement at Year 3 is as follows:
- Interpret and present data using bar charts, pictograms and tables
- Solve one-step and two-step questions [for example ‘How many more?’ and ‘How many fewer?’] using information presented in scaled bar charts and pictograms and tables
The non-statutory notes and guidance suggests:
- Pupils understand and use simple scales (for example, 2, 5, 10 units per cm) in pictograms and bar charts with increasing accuracy.
- They continue to interpret data presented in many contexts.

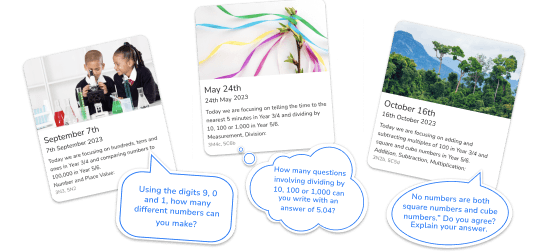
Unlimited primary maths tutoring with Skye, the voice-based AI maths tutor.
Built on the same principles, pedagogy and curriculum as our traditional tutoring but with more flexibility, reach and lower cost.
Join the schools already helping hundreds of primary pupils nationwide with Skye’s one to one maths tutoring
Watch Skye in actionStatistics and data handling Year 3 – Pictograms are key!
Despite it being on the non-statutory guidance, understanding simple scales is such an important skill that ties in well with the application of multiplication and division facts in a real context.
For that reason, focusing on interpreting pictograms but looking at scaling as well is a must for this year group. Not only does it allow students to use their multiplication facts, but it also encourages students to look at the whole table (key and all) to fully understand what is happening.
Consider the following pictogram with data about the number of butterflies each group in a class saw.
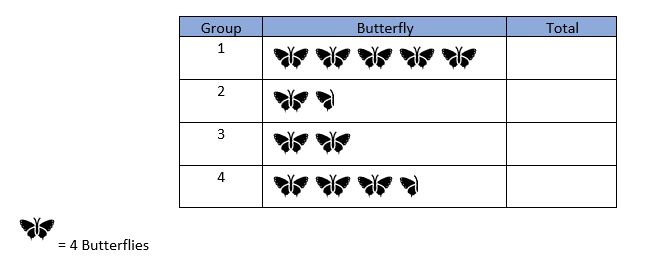
Presenting data like the above is important as it is not immediately clear what number the butterfly represents. Attention needs to be drawn to the key where we can see that one butterfly represents 4 that were seen.
With that information, and students already having developed some fluency of the 4 times table, working out the total of butterflies that group 1 and group 2 saw would be rather straight forward. That said, do not shy away about discussing various strategies on reaching the total.
Some students may skip count in 4s as they count each individual butterfly and others may count the butterflies (ideally they would subitise the number of butterflies and not count 1:1) and multiply the number by 4. This can lead to a rich discussion as to which method is the most appropriate and efficient.
Students should then be asked about what they notice about the last butterfly in groups 2 and 4. Notice how recognising that there is half a butterfly will need students to draw upon their fractional knowledge. This has a lesson in how we sequence our curriculum. They must have some fractional knowledge before they do statistics.
Teachers should then encourage students to deduce that if those butterflies represent a half, then there are implications for the number that these butterflies represent. A careful sequence of questions should lead students to see that as there is half a butterfly, then the number it represents is also half of the original. Therefore, the half butterfly will represent 2.
With this knowledge, students can use their knowledge of multiplication and addition to find the total of butterflies in groups 2 and 4. In the total column I will write the calculations that students will do mentally; they would not be expected to write these down.
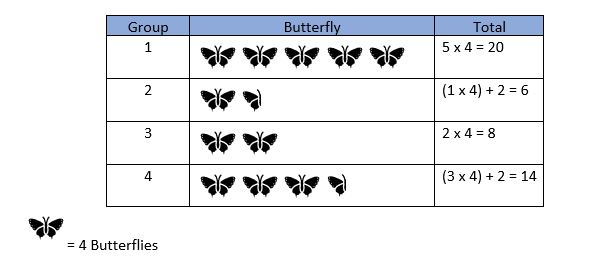
and only including their answers in the pictogram.
Statistics and data handling word problems Year 3
In terms of word problems, a common theme is to compare two sets or more of data. An appropriate problem would be:
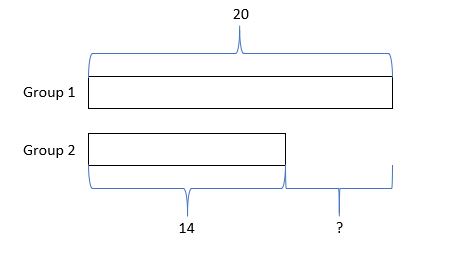
How many more butterflies did group 1 see than group 4?
Teachers should represent this as a bar model so students can see the underlying relationship.
and more basic maths concepts like addition.
With the problem set up like this, students can see that when a question asks, ‘how many more’, we are looking at the difference between the two groups.
Students can then use their knowledge of number bonds to 20 or their knowledge of subtraction to reach the answer – 6.
For more on using bar modelling to visualise the underlying operations needed for a problem, check out Neil’s blog on teaching addition and subtraction.
Statistics and data handling: reasoning and problem solving Year 3
Open ended, or goal free problems, allow students to explore a range of mathematical ideas without overwhelming them. Instead of focusing one only one ‘problem’, students are free to solve whatever they like.
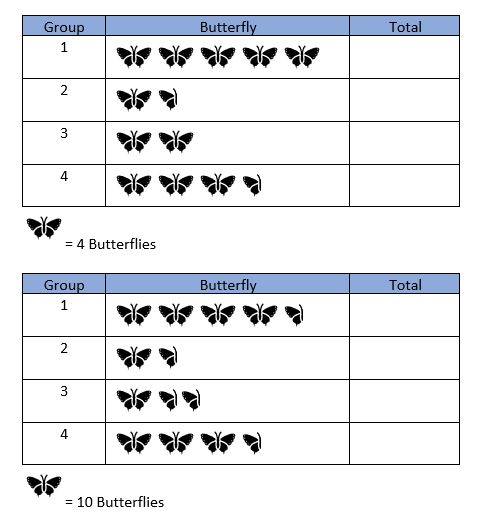
For this question, I would only give the students the instruction of ‘what is the same and what is different’ and allow them to explore. Some key things I would like the students to note would be the difference in what each butterfly represents, but also that in group 3 on table 2, there have been 2 halves used concurrently.
Statistics and Data Handling Year 4
- Interpret and present discrete and continuous data using appropriate graphical methods, including bar charts and time graphs
- Solve comparison, sum and difference problems using information presented in bar graphs, pictograms, tables and other graphs
The non-statutory notes and guidance suggests:
- Pupils understand and use a greater range of scales in their representations.
- Pupils begin to relate the graphical representation of data to recording change over time.
Statistics and data handling Year 4 lesson ideas
When teaching line graphs in year 4, it is important that children understand that continuous data can be measured (for example time, temperature and height) but as values are changing all the time, the values we read off between actual measurements are only estimates.
Spending some time to ensure that students are familiar with the difference between continuous and discrete data will pay dividends when students will be expected to write their own graphs based on data that they have collected.
Line graphs in KS2 statistics
For reading line graphs, students should be taught to read along the x-axis first and then the y-axis. They should be taught that both axis needs labels and that the x-axis should be labelled as whatever is affecting the other. For example, if you were looking at the height of someone over time, it is the time that affects the height.
As this is merely an introduction to line graphs at this stage, all the examples will have some form of time across the x-axis (seconds, minutes, hours, days months etc) but I will tell students explicitly that this is not always the case.
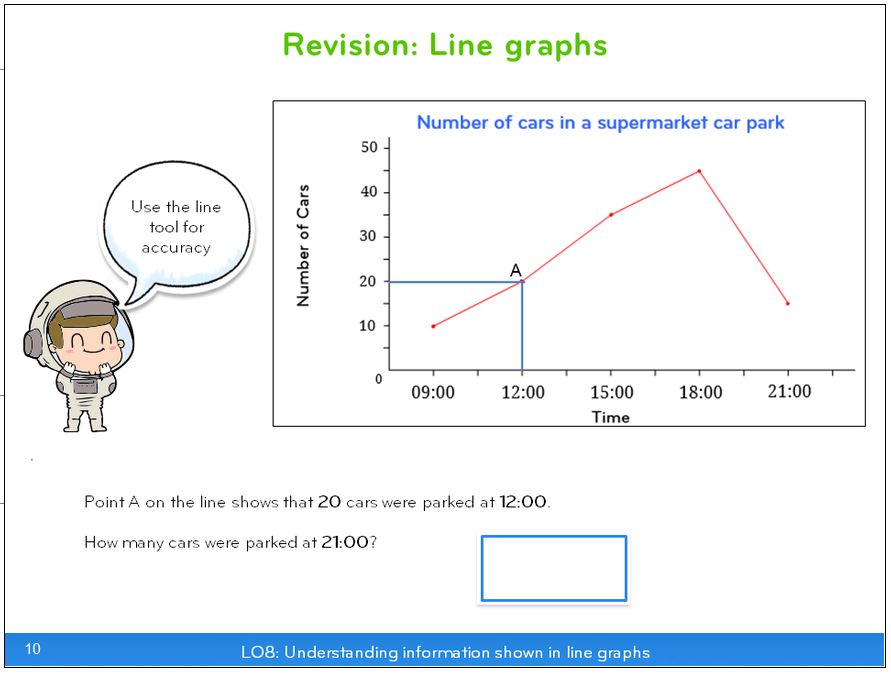
as shown in this revision lesson from Third Space Learning’s AI tutoring.
Furthermore, students need to be taught that graphs can go up in different scales and that writing accurate titles for the graph is important. I believe that we can too quickly rush into doing maths with line graphs rather than actually spend some time looking at what a good graph looks like.
My first lesson would take students through this (e.g. with a PowerPoint) and present some templates and other teaching materials, rather than focus on maths.
In terms of work that I would give students, it would be a collection of graphs with various features missing that students would have to identify or complete themselves. For example, in the four line graphs below, each has one or more pieces of data missing.
I would therefore expect each child to identify the feature that was missing and provide a suitable answer as to what it could be taking into account the information. While these graphs are all the same, this is for demonstrative purposes only.
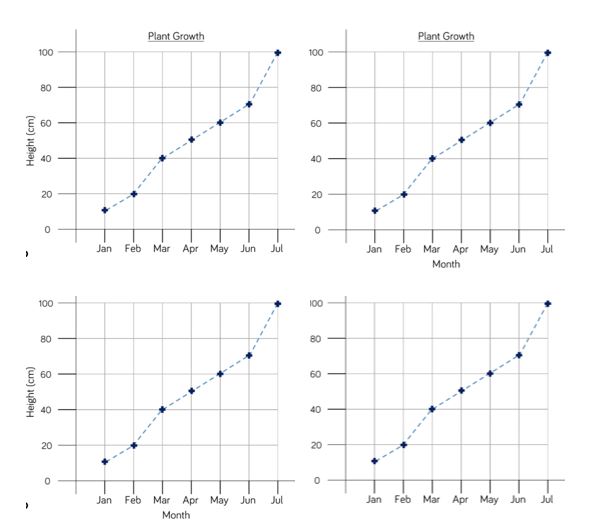
Where it would be impossible to know the actual correct answer, such as in graph 3 and 4, any reasonable answer would be expected.
Statistics and data handling word problems Year 4
With this type of lesson, I would not include word problems as they would not be appropriate for the content.
Statistics and data handling: reasoning and problem solving Year 4
Graph 4 provides many opportunities for students to reason. Not all students will get the same answer and so this will naturally open discussion as pupils will be used to there being a right or wrong answer. Furthermore, you could extend students’ thinking by getting them to write as many examples of a title and y-axis label as they can think of.
Statistics and Data Handling Year 5
- Solve comparison, sum and difference problems using information presented in a line graph
- Complete, read and interpret information in tables, including timetables
The non-statutory notes and guidance suggests:
- Pupils connect their work on coordinates and scales to their interpretation of time graphs.
- They begin to decide which representations of data are most appropriate and why.
Statistics and data handling lessons Year 5
In year 5 the sophistication of line graphs increases – usually by having two data sets on one graph. Students will be expected to solve problems involving those sets of data. An example of this can be found below.
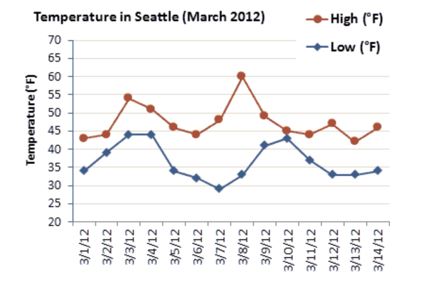
From my experience, students do not find interpreting graphs with two sets of data particularly difficult when they need to answer questions in isolation. For example, on which day was the hottest temperature?
Confusion arises when asked to manipulate both sets of data. For example, on what day was the greatest difference between the highest temperature and the lowest temperature or how much higher was the temperature on 3/3/12 than the 3/10/12.
These questions should be modelled to students with worked examples carefully given and then opportunities for students to practice the same type of questions using data from a wide range of different contexts until they feel secure.
Again, bar modelling so that students can see the underlying structures is important at the beginning of this process. However, with enough practice students should loose their reliance on these models
Statistics and data handling word problems Year 5
Through the nature of the objective, all the question types pupils are likely to encounter will be word problems.
Statistics and data handling: reasoning and problem solving Year 5
For reasoning, providing students with graphs without a title and without a labelled axis gives the students the opportunity to practice ‘graph stories’.
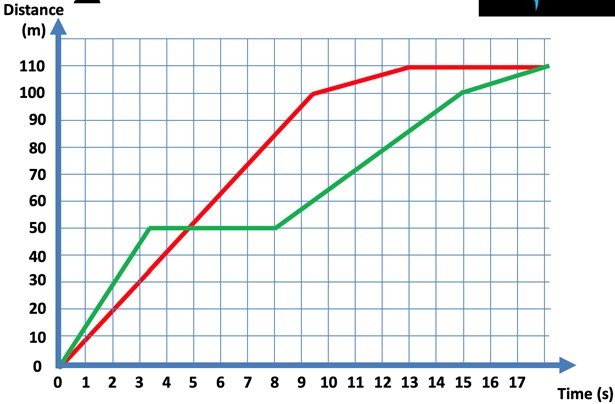
For example, you could give the above graph to students and question what they know so far from looking at it. They will be able to say that there are two data points – the x axis looks at time and the y axis looks at distance. From there students could conjecture what the graph shows e.g. two people running a race.
They could then be tasked to give a commentary second by second to describe what happened in the race. They should give careful thought to the 5 seconds that the green line shows the runner was stationary and think of reasons as to why this should be the case (stopped to do his shoelace?).
As ever, it is the openness of such tasks that allows students to get to grips with their reasoning.
Statistics and Data Handling Year 6
While some new objectives are introduced in Year 6, the majority of statistics work this year is extending and consolidating what pupils have learnt in the rest of Key Stage 2, ready for the SATs.
Note: For those wondering, venn diagrams only enter the curriculum at Key Stage 3 and as such aren’t included here.
- Interpret and construct pie charts and line graphs and use these to solve problems
- Calculate and interpret the mean as an average
Read more: Mean in maths and Mean median mode
The non-statutory notes and guidance suggests:
- Pupils connect their work on angles, fractions and percentages to the interpretation of pie charts.
- Pupils both encounter and draw graphs relating 2 variables, arising from their own enquiry and in other subjects.
- They should connect conversion from kilometres to miles in measurement to its graphical representation.
- Pupils know when it is appropriate to find the mean of a data set.
Statistics and data handling activities and lesson ideas Year 6
For this lesson we will look at reading and interpreting pie charts. This needs students to ensure that they have a good understanding of fractions in particular.
When introducing this, I would not immediately link this to percentages as well as I do not want to overload their working memories. I want them to first of all get comfortable with working with finding the fractions of amount in the context of a circle.
I would begin the lesson by recapping their understanding of fractions and finding simple fraction of amount. By now, their understanding of fractions should be at such a level that this poses very little difficulty for the students.
Statistics and data handling KS2: Using pie charts
I would then show a question in the context of a pie chart, like the one below.
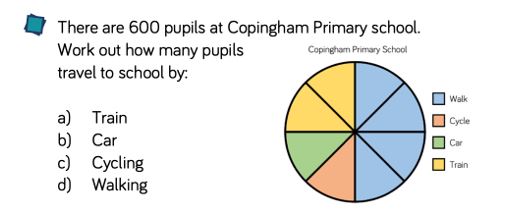
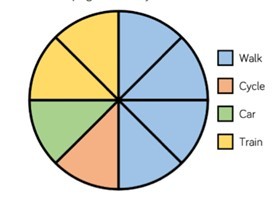
At this stage I would get students to note that the circle has been split into 8 equal parts. Of those 8 equal parts walking takes up one half (I would write the fractions next to the key), train takes up one quarter and both cycling and car take up one eight each.
I would then proceed to read the questions and ask students to discuss what they have understood from the questions and the language that gives insight as to what needs to be done mathematically.
Students will be clear that we need to work out how many pupils travelled to school and that the pie chart is the key to this. I would also draw their attention to how many pupils there were in the school.
Due to the nature of the numbers, I would expect students to be able to solve this mentally, using known number facts and relationship between difference fractions.
I would begin by reminding the students that half of the pupils walked. By this stage pupils should have very little difficulty in halving 600 to get 300. I would write this next to the key.
Next, I would point at the relationship between one half and one quarter and that one quarter is half of one half. Therefore, to find the number who get a train, we need to halve the total of those who walked. Again, students should be able to do this mentally and arrive at 150.
Finally, I would note that one eight is half of a quarter so to find the number of students who took a car or cycled to work can be found by halving the total of those who took the train. Students should be able to do this mentally and arrive at 75.
I would get students to check the answer by getting the sum of all the totals we found and check to see if the answer is 600 – the total number of pupils that there were at the start.
I would then repeat this with more examples gradually getting the students to do more. At this point, I would only split the circle into 6 or 8 equal parts and ensure that there were no remainders in any answers.
Statistics and data handling word problems Year 6
Typical activity sheets for this year would include a simple comparative question such as how many more people walked to school than took a train?
This is a question that students should be familiar with as they have been doing these type of questions for some years now. By this point, I would not expect to need to use a bar model to show the underlying maths but rather expect students to know that they should perform the calculation 300 – 75 = 225.
Statistics and data handling: reasoning and problem solving Year 6
When students have gained confidence, you can stretch their thinking in the following way.
so pupils can make their own deductions.
If 32 people came by car, what else can you find out?
Again, this task is an open ended task as I am not asking them to find a specific answer but rather demonstrate what it is that they can find out from knowing one piece of information.
This means the students are performing the reverse of that they did before which they can often find difficult. To support students, linking what the car represents as a fraction of the whole is crucial as they are likely to have come across such questions when studying fractions.
Students could find the following:
- 32 people cycled
- 64 people came by train
- 128 people walked
- 256 people took part in the survey altogether.
Statistics and data handling may not be the most expansive or closely-studied topic at KS2, but it provides an excellent opportunity for pupils to use the maths skills they’ve learnt in new contexts. Hopefully this post has given you some great ideas for how to teach and make use of this important topic!
DO YOU HAVE STUDENTS WHO NEED MORE SUPPORT IN MATHS?
Skye – our AI maths tutor built by teachers – gives students personalised one-to-one lessons that address learning gaps and build confidence.
Since 2013 we’ve taught over 2 million hours of maths lessons to more than 170,000 students to help them become fluent, able mathematicians.
Explore our AI maths tutoring or find out about primary maths tutoring for your school.