FREE DOWNLOAD
Stem And Leaf Diagrams Worksheet
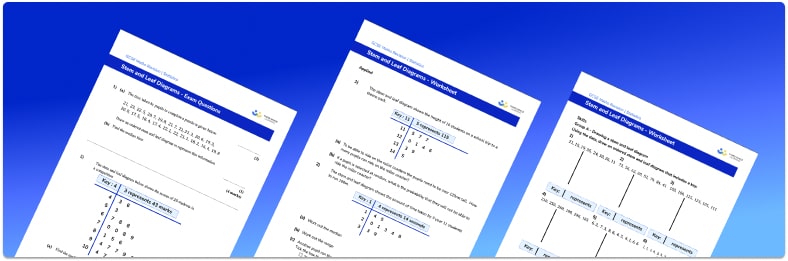
Help your students prepare for their Maths GCSE with this free stem and leaf diagrams worksheet of 27 questions and answers
- Section 1 of the stem and leaf diagrams worksheet contains 21 skills-based stem and leaf diagrams questions, in 3 groups to support differentiation
- Section 2 contains 3 applied stem and leaf diagrams questions with a mix of worded problems and deeper problem solving questions
- Section 3 contains 3 foundation and higher level GCSE exam style questions on stem and leaf diagrams
- Answers and a mark scheme for all stem and leaf diagrams questions are provided
- Questions follow variation theory with plenty of opportunities for students to work independently at their own level
- All questions created by fully qualified expert secondary maths teachers
- Suitable for GCSE maths revision for AQA, OCR and Edexcel exam boards
Raise maths attainment across your school with hundreds of flexible and easy to use GCSE maths worksheets and lessons designed by teachers for teachers.
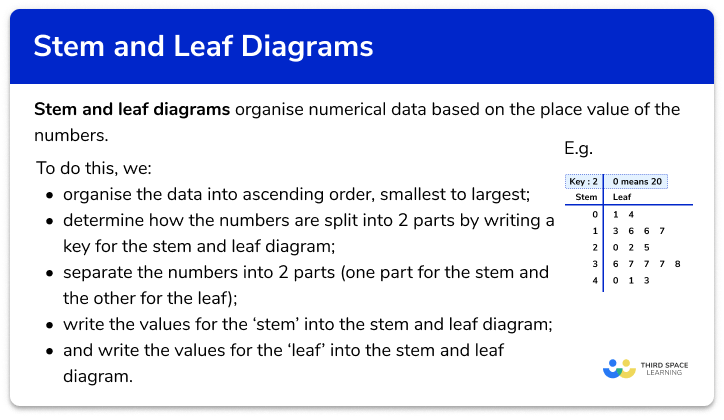
Stem and leaf diagrams at a glance
A stem and leaf diagram is useful for quickly displaying or ordering a set of data by breaking the numbers into two sections – a stem and a leaf.
When drawing stem and leaf diagrams, we first select the ‘stems’. If the numbers include integers then the stem is often the tens unit, if the data includes decimals then the stem is often the part of the decimal to the left of the decimal place. These stems are listed in a column, and the ‘leaves’ are added in the appropriate row. The leaves make up the rest of the number, for example for the number 28 the stem will be the ‘2’ to represent ‘20’ and the leaf will be the 8 units. The data in an ordered stem and leaf diagram should be ordered from smallest to biggest and a key must be included to show what the stem and leaf each represent.
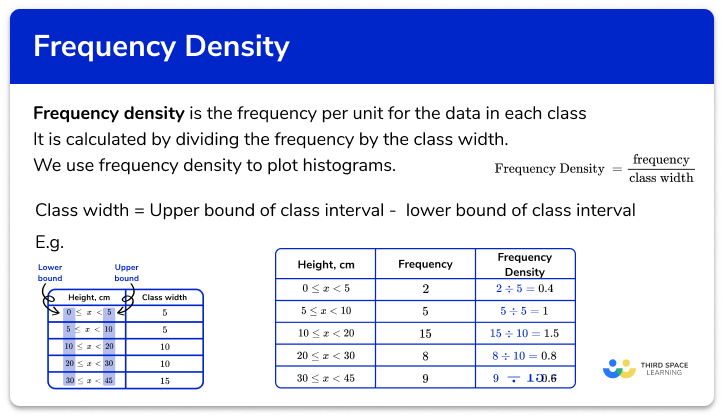
Once the data is presented in a stem and leaf diagram it can then be transferred to a grouped frequency table to produce a histogram.
A back to back stem and leaf diagram is useful when comparing the distributions of two sets of data. Back to back stem and leaf diagrams share the same ‘stem’, with one set of data listed to the right of the stem, and the other set listed to the left in reverse order.
When interpreting stem and leaf diagrams we can calculate the median and quartiles by counting or marking off individual data items. We can also easily find the fraction of data points above or below a certain value.
Looking forward, students can then progress to additional Statistics worksheets, for example a mean, median, mode and range worksheet or frequency table worksheet.

For more teaching and learning support on Statistics our GCSE maths lessons provide step by step support for all GCSE maths concepts.


Do you have students who need additional support?

With Third Space Learning's secondary maths tutoring programmes, students in Year 7-11 receive regular one to one maths tutoring to address gaps, build confidence and boost progress.
"My confidence in the tutoring is high. We've had some phenomenal results. I even had one girl get a Grade 8 this year; she came to every tutoring session."
Stacey Atkins, Maths Director, Outwood Grange Academies Trust