FREE DOWNLOAD
Directly Proportional Graph/ Inversely Proportional Graph Worksheet
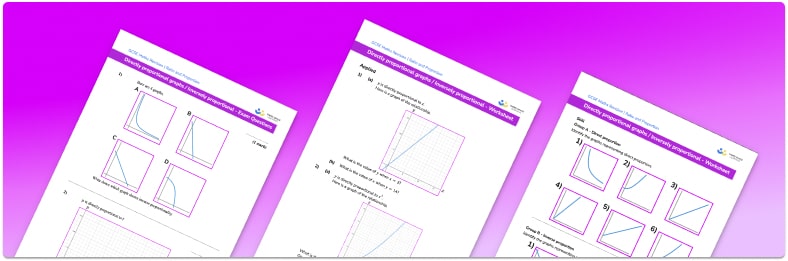
Help your students prepare for their Maths GCSE with this free directly proportional graph/ Inversely proportional graph worksheet of 24 questions and answers
- Section 1 of the directly proportional graph/ Inversely proportional graph worksheet contains 18 skills-based directly proportional graph/ Inversely proportional graph questions, in 3 groups to support differentiation
- Section 2 contains 3 applied directly proportional graph/ Inversely proportional graph questions with a mix of worded problems and deeper problem solving questions
- Section 3 contains 4 foundation and higher level GCSE exam style directly proportional graph/ Inversely proportional graph questions
- Answers and a mark scheme for all directly proportional graph/ Inversely proportional graph questions are provided
- Questions follow variation theory with plenty of opportunities for students to work independently at their own level
- All questions created by fully qualified expert secondary maths teachers
- Suitable for GCSE maths revision for AQA, OCR and Edexcel exam boards
Raise maths attainment across your school with hundreds of flexible and easy to use GCSE maths worksheets and lessons designed by teachers for teachers.
Directly proportional graph/ Inversely proportional graph at a glance
If two amounts are proportional then the ratio between them is always the same. There are two types of proportionality; direct or inverse (indirect). For direct proportion, as one amount increases so does the other, e.g. converting currency. For inverse proportion, as one amount increases the other decreases, e.g. the number of hours to complete a task assigned to multiple people.
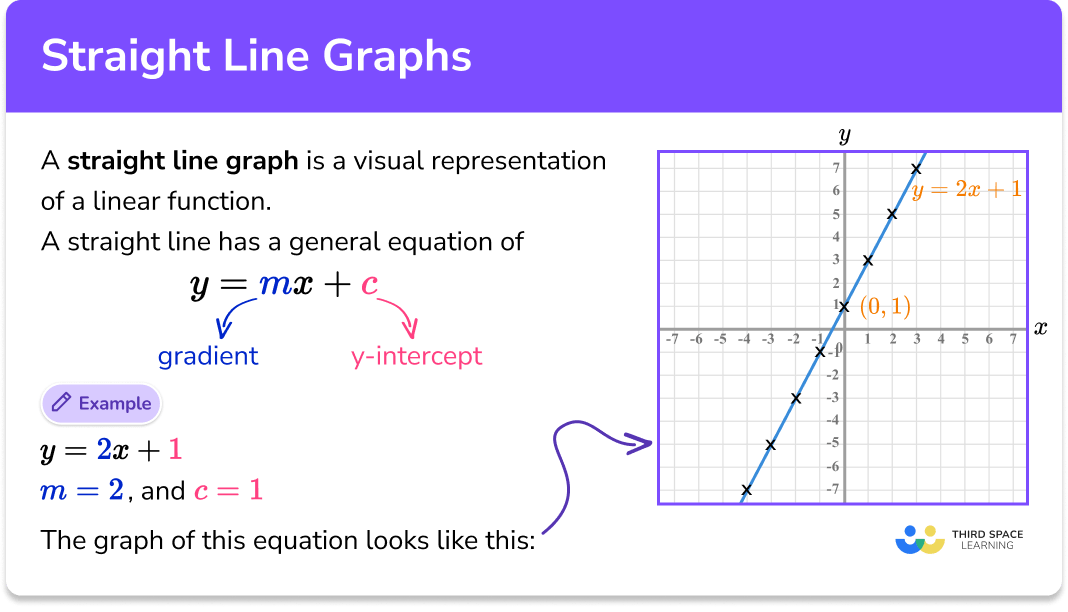
We can draw graphs to represent proportional relationships. Graphs showing direct proportion will always pass through the origin. Their shape will depend on the nature of the relationship. If y is directly proportional to x then the graph will be a straight line. The gradient of the straight line is the rate of change, known as the constant of proportionality, k. A good real life example of this is a currency conversion graph, where the gradient is equal to the exchange rate.
If y is directly proportional to x2 then the graph will take the shape of a quadratic graph.
If y is inversely proportional to x, then y is proportional to 1 divided by x. The shape of a graph showing inverse proportion is that of a reciprocal graph.
We can read and find missing values from proportion graphs and use these to solve proportion problems.
Looking forward, students can then progress to additional ratio and proportion worksheets, for example a ratio worksheet or a ratio worksheet.
For more teaching and learning support on Ratio and Proportion our GCSE maths lessons provide step by step support for all GCSE maths concepts.
Do you have students who need additional support?

With Third Space Learning's secondary maths tutoring programmes, students in Year 7-11 receive regular one to one maths tutoring to address gaps, build confidence and boost progress.
"My confidence in the tutoring is high. We've had some phenomenal results. I even had one girl get a Grade 8 this year; she came to every tutoring session."
Stacey Atkins, Maths Director, Outwood Grange Academies Trust