FREE DOWNLOAD
Types Of Data Worksheet
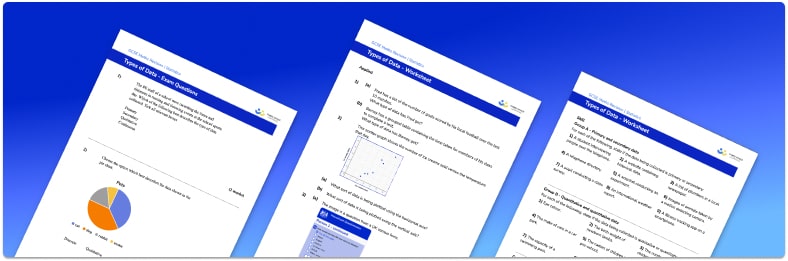
Help your students prepare for their Maths GCSE with this free types of data worksheet of 35 questions and answers
- Section 1 of the types of data worksheet contains 27 skills-based types of data questions, in 3 groups to support differentiation
- Section 2 contains 4 applied types of data questions with a mix of worded problems and deeper problem solving questions
- Section 3 contains 4 foundation and higher level GCSE exam style types of data questions
- Answers and a mark scheme for all types of data questions are provided
- Questions follow variation theory with plenty of opportunities for students to work independently at their own level
- All questions created by fully qualified expert secondary maths teachers
Suitable for GCSE maths revision for AQA, OCR and Edexcel exam boards
Raise maths attainment across your school with hundreds of flexible and easy to use GCSE maths worksheets and lessons designed by teachers for teachers.
Types of data at a glance
Data is classified into various types based on its content. The first categorisation is between qualitative data and quantitative data. Qualitative data is non-numeric, such as modes of transport or favourite colour, whereas quantitative data is numerical data, such as age or number of children. Qualitative data is also called categorical data, because it takes certain categories, rather than numerical values, or descriptive data.
Quantitative data is then further split into two sub-groups, discrete and continuous data. Discrete data is data which can only take certain values (like whole numbers), such as shoe size, whereas continuous data can take any value in a given range, such as height or weight. Generally, discrete data is countable (usually integers) whereas continuous data is measured to a given degree of accuracy (e.g. decimal places).
The distinction between primary and secondary data relates to the method of data collection. Primary data is that which we have collected ourselves – for example, by collecting data from answers to a questionnaire. Secondary data is a set of data which has been collected by someone else and made available for our use – for example, data provided by the ONS (the Office for National Statistics).
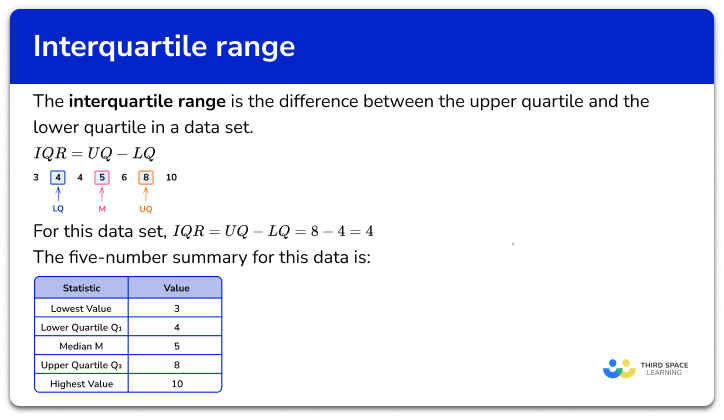
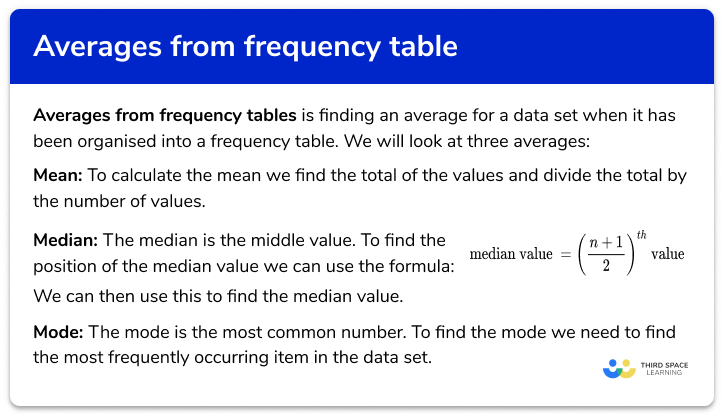
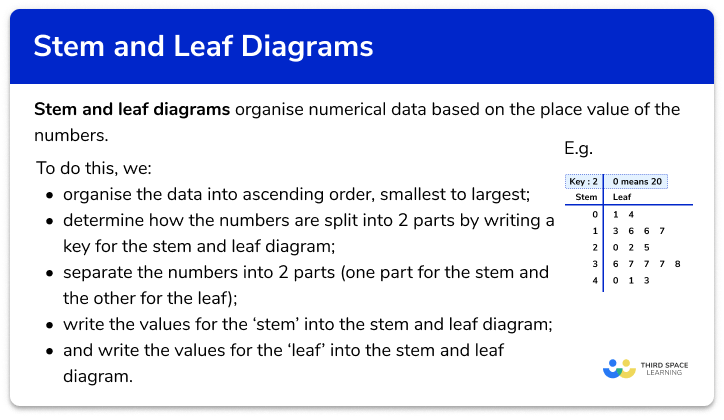
Different types of data require different representations in charts or graphs. For example, a bar graph is a good choice for displaying discrete data, but a histogram should be used for continuous data. Some, like a box plot, can be used to display any quantitative data, whereas a pie chart is most appropriate for qualitative data.
Looking forward, students can then progress to additional Statistics worksheets, for example the line graph worksheet, the pie chart worksheet, or the stratified sampling worksheet.
For more teaching and learning support on Statistics our GCSE maths lessons provide step by step support for all GCSE maths concepts.


Do you have students who need additional support?

With Third Space Learning's secondary maths tutoring programmes, students in Year 7-11 receive regular one to one maths tutoring to address gaps, build confidence and boost progress.
"My confidence in the tutoring is high. We've had some phenomenal results. I even had one girl get a Grade 8 this year; she came to every tutoring session."
Stacey Atkins, Maths Director, Outwood Grange Academies Trust