
What Is A Ratio Table And How Can A Ratio Table Help In Problem Solving
A ratio table is a model for proportional reasoning. We can take a problem involving a multiplicative link or proportional relationship between two (or more) quantities and represent this on a ratio table, filling in rows or columns to arrive at an answer.

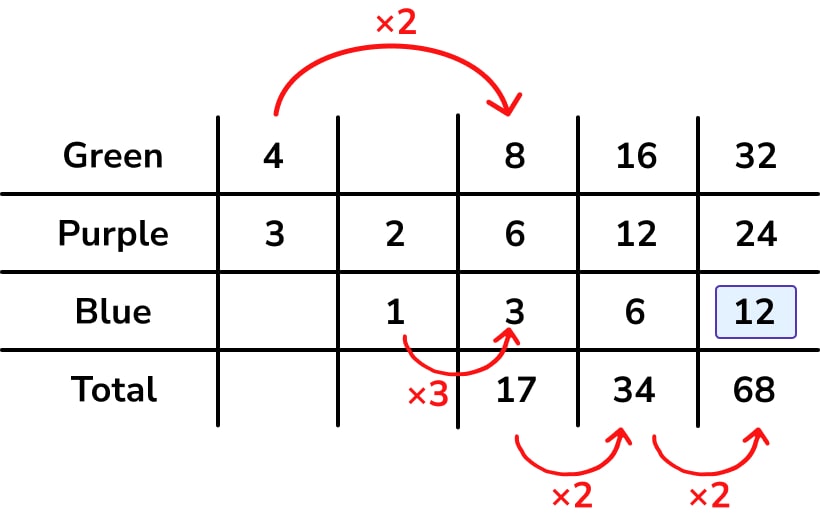
Using Ratio Tables
Help your GCSE students improve their proportional reasoning skills and practice the wide range of applications of ratio tables with this worksheet.
Download Free Now!The name “ratio table” makes it sound like a strategy for ratio problem solving by completing tables of equivalent ratios. However, as we’ll see in the discussion below, their application is far-reaching across the GCSE Mathematics curriculum, including the in following topics:
- Simplifying ratios and equivalent ratios
- Splitting into a ratio
- Solving ratio problems – finding missing values
- Direct proportion
- Unit rates and exchange rates
- Recipe conversions
- Percentage change
- Reverse percentages
- Speed distance time
- Density and pressure
- Scale drawing
Ratio table applications in GCSE Maths
Ratio tables are extremely powerful for giving learners a step-by-step representation on which to ‘hang’ their working out, or help to scaffold problems that they may not immediately see a route through.
I first encountered ratio tables while participating in an NCETM project on multiplicative reasoning in 2014, coinciding with lots of curriculum development work for GCSE 2015. I immediately saw the advantages of ratio tables as a problem-solving strategy – at the time I had a group of grade C borderline students who were sitting the (old) Higher paper. After they sat the non-calculator paper, I sat down and went through the exam, and found 7 out of 24 questions which lent themselves to solutions using ratio tables – you can read that blog via the links at the bottom.
As I’ve spent the last few months immersed in analysis of the most recent series of GCSE maths exams, I thought it would be an interesting exercise to repeat, this time looking at the opportunities to solve problems using ratio tables on the Foundation papers.
Towards the end of this blog, you can find some practice ratio questions to try for yourself, along with a suggested pathway to solve using a ratio table. There is also a ratio tables worksheet aimed at students, with a variety of exam-style questions which can be solved using ratio tables.
The examples used in this blog are adaptations of previous Edexcel GCSE exam problems. The solutions given below are in no way endorsed by Edexcel.
Meet Skye, the voice-based AI tutor making maths success possible for every student.
Built by teachers and maths experts, Skye uses the same pedagogy, curriculum and lesson structure as our traditional tutoring.
But, with more flexibility and a lower cost, schools can scale online maths tutoring to support every student who needs it.
Watch Skye in actionWhat does a ratio table show?
A ratio table helps to visualise multiplicative relationships. However, it’s important that students are not taught how to use a ratio table as ‘a method’ or a magic bullet just before exams.
A ratio table is part of a continuum of models for proportional reasoning, beginning with the bar model:
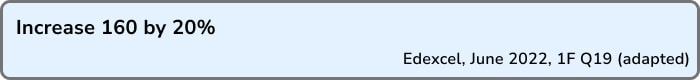
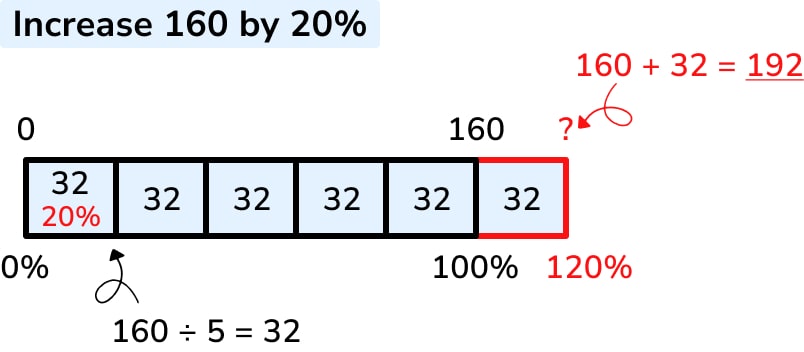
At some point, it becomes appropriate to remove some structure – so learners move on to a double number line (DNL):
This retains the visual spacing aspect of the bar model, but requires learners to think more carefully about related quantities. For example, it is more natural to then begin to talk about the connection between the two number lines and what this represents.
In the example above, we can see the multiplier 1.6 to get from the bottom line to the top – this represents 1%, so we can begin to have discussions with learners about unitary methods.
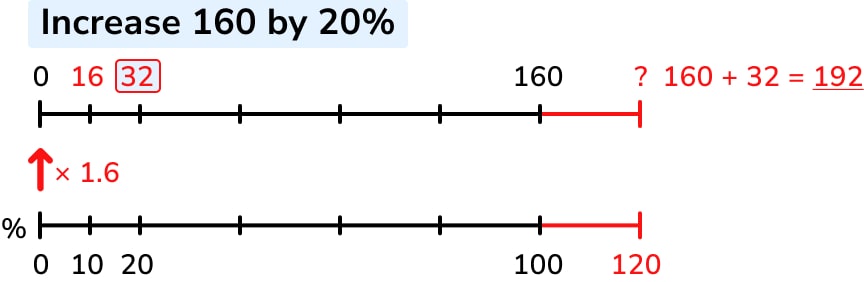
The ratio table is an extension of these models, rather than a starting point in its own right:
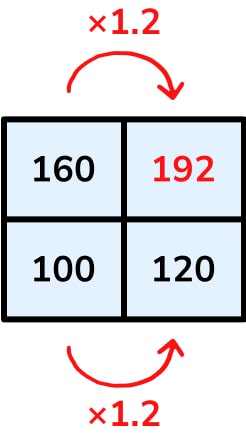
- Begin the table by writing the whole amount (160) as equal to 100%.
- If we’re increasing by 20%, then we need to find 20% of 160 and add it on.
- To find 20%, we can divide by 10 and multiply by 2.
- Finally, add 160 and 32 to get the answer 192.
The main advantage of a ratio table over a bar or DNL is that scaling is no longer an issue – for example, both bar and DNL become difficult to work with for percentages less than 5%, as you’re trying to cram working into a small space.
The ratio table also allows and encourages learners to work flexibly. When finding 20%, some may like to find 10% and double, some may divide by 5 to go straight to 20%, and some may have other strategies. Learners can also “build up” amounts by using addition or subtraction to combine previously-found quantities, such as adding 10% and 5% to find 15%.
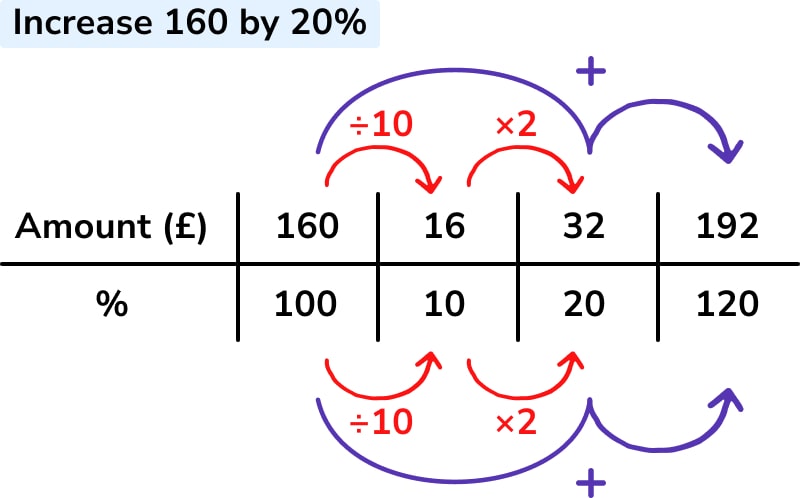
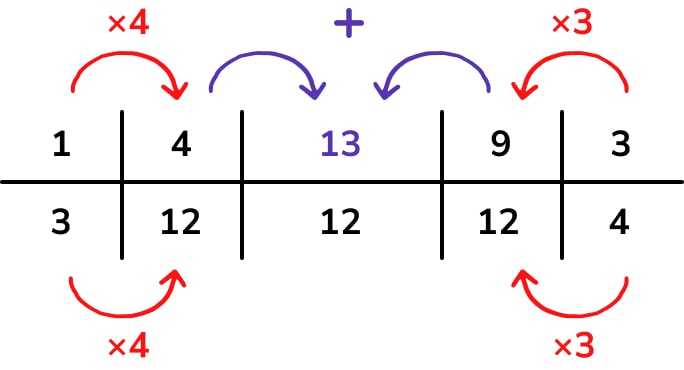
As learners become more experienced, it may be appropriate to push them further, by considering contracted ratio tables:
This is a snapshot of the key information from the ratio table above. We have the quantities in the question (160 is 100%) and the quantity we need to find (120%). We can also see the single percentage multiplier for the calculation – the strategy that is considered the ‘endgame’ for percentage change at GCSE.
It is likely that some learners, particularly Higher candidates, will go a step further and do away with ratio tables altogether for many topics. However, for some learners, particularly those towards the lower end of Foundation, I’d argue that the extended ratio table is a perfectly fine stopping point.
For some exam questions, such as speed problems involving change of units, they can be a great aid even to more advanced learners. Realistic Maths Education (RME) has an excellent discussion on the benefits of the extended ratio table – this is linked in the footnotes.
Ratio tables can be set out horizontally or vertically – there is no material difference and it seems to come down to personal preference. I would however suggest consistency of modelling within a department and across the school.
How do you solve a ratio table?
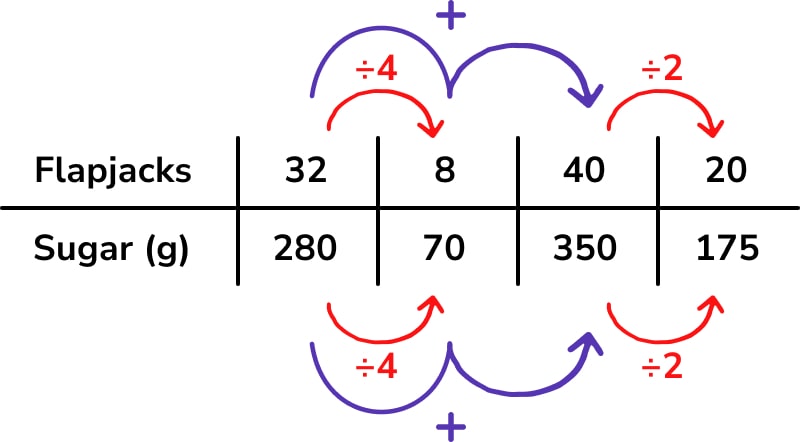
One of the biggest advantages of using ratio tables is that they support multiple pathways through to a solution. Let’s consider a recipe adaptation question:
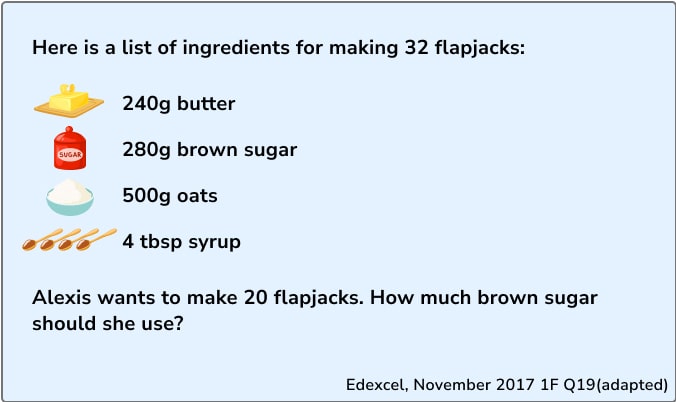
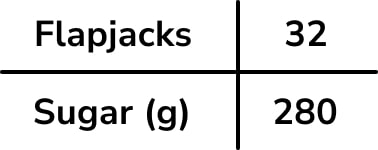
The first thing I’d want students to do is pull out the important information from the question – we’re interested in the number of flapjacks and brown sugar, and we already know a quantity from the recipe – 32 flapjacks requires 280g of sugar.
From here, a possible strategy might be:
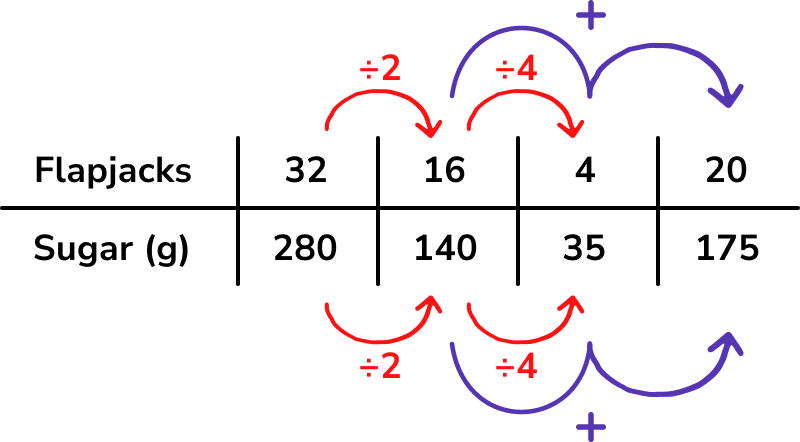
I’ve included the links between each column on the table for demonstration purposes only – I probably wouldn’t encourage learners to annotate the multiplicative links in red, but might suggest they note additive links (purple on my diagram) if it can be done clearly on their table.
Another possible strategy:
One of the great things about ratio tables as a model for teaching ratio and proportion is that varied methods or pathways to a solution can be demonstrated on the same model, meaning that learners are more likely to engage with their peers’ alternative methods. You can also produce worked examples for students to spot the method used and comment on its efficiency – could they have done it in fewer steps?
The contracted ratio table for this problem is as follows:
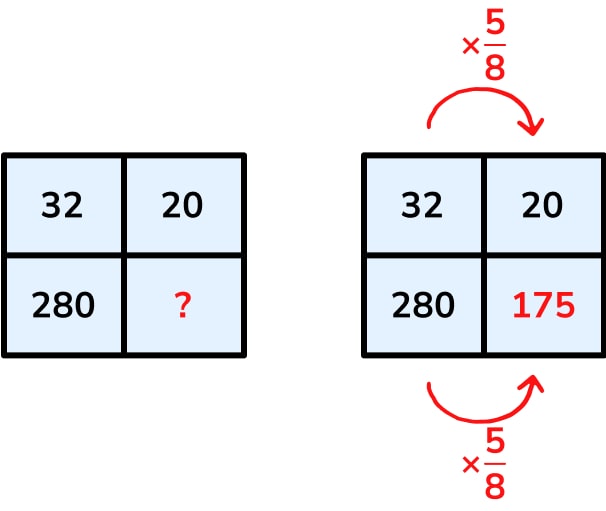
Personally this feels like a much more challenging representation for Foundation learners. Firstly, some of the context has been stripped – we’re now just considering the relationship between four numbers. Secondly, it wouldn’t be immediately obvious that the multiplier across is \frac{5}{8}.
Why is a ratio table useful for the Foundation papers?
Ratio tables are not only applicable to percentages and direct proportion problems. The beauty of the model is its wide-ranging use for many problems at GCSE, particularly the Foundation tier, which is traditionally more number-heavy.
Taking the most recent series of exams (June 2022), here is a list of all the questions that I would consider solving using a ratio table on the Edexcel Foundation papers:
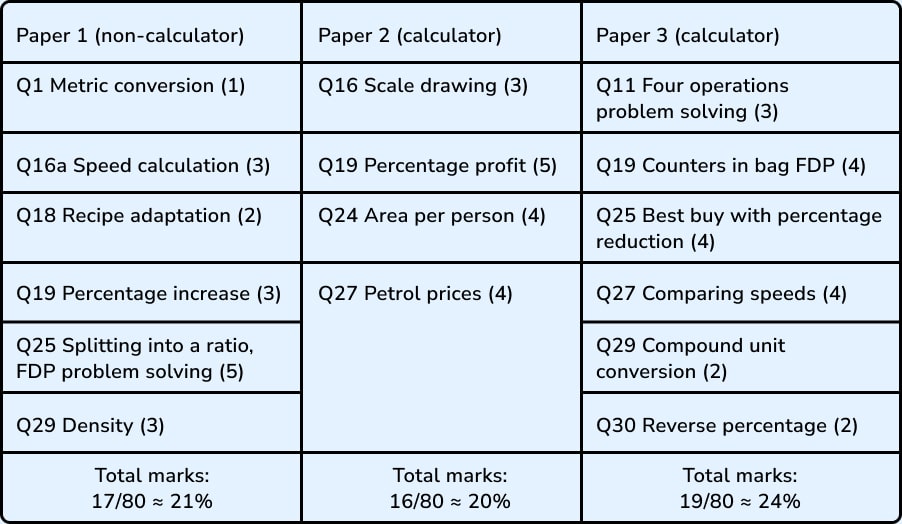
So we can see that ratio tables are a useful strategy for between a fifth and a quarter of the Foundation exam papers.
On the non-calculator paper, a ratio table helps students to break problems or calculations down into chunks that are manageable, then build back up, rather than use a single (often decimal) multiplier. Calculations often involve integers or simple decimals. Both examples we’ve already seen (the percentage increase and the recipe adaptation) are non-calculator questions.
On the calculator papers, although the mental load from carrying out arithmetic has been reduced, the difficulty is often increased in terms of the complexity of the problem and the fact that students are unlikely to be working with whole numbers.
Students may more easily be able to find a single multiplier when using a calculator, and may not need to work in stages; however the ratio table is still a useful model for organising working out and providing structure to the problem.
When considering exam techniques, ratio tables mean that students are less likely to end up with “solutions” that are just a page full of random calculations, where they often struggle to communicate to the examiner exactly which pathway they have taken through the problem.
Third Space Learning incorporates a form of ratio tables into our online one-to-one GCSE revision programme. Specialised to the needs of each individual student, our GCSE AI tutoring aims to equip students with valuable exam skills, fill gaps in knowledge and give students more confidence heading into the GCSE maths exam.
A quick word about fractions
Ratio tables for equivalent fractions, finding fractions of amounts or converting between fractions, decimals and percentages can be quite useful.
For example:

Here we use the idea that a percentage is “out of 100” and work in stages to convert the denominator from 80 into 100, so the numerator is then the required percentage.
The benefit of a ratio table here is in flexibility of working; without the table, we’re hoping students will spot that 8 is a factor of both 48 and 80, reduce down to \frac{6}{10} and then multiply back up by 10 to get 60%.
However, I would avoid attempting to use ratio tables (or structures that resemble ratio tables) for fraction arithmetic, particularly fraction addition and subtraction.

It’s technically feasible to set up the problem as follows, and I’ve seen this done in examples online:
However, we’re breaking from one of the core ideas with ratio tables – they deal with quantities in direct proportion, so we can add columns to find related amounts.
When adding or subtracting fractions, the denominators are not added or subtracted, and the table produced is not really a ratio table. It is likely that using something that resembles a ratio table for fraction arithmetic would cause additional misconceptions rather than assisting students.
If students need additional support or modelling for fraction arithmetic problems, I’d consider continued use of bar modelling diagrams.
Ratio table examples across the GCSE syllabus
Because ratio tables appear across so many GCSE topics, they are one of the most efficient methods for students to learn. If a student can master the ratio table approach in a few focused sessions of secondary maths tutoring, they immediately have a reliable strategy for tackling questions on proportion, percentages, unit conversions, and more.
We now look at some more examples based on past Edexcel GCSE Foundation exam questions.
Equivalent ratios and unit ratios

This is one of the simplest uses of ratio tables, and most students will have moved beyond this by the time they sit their GCSE maths papers. However, I have included it for completion:
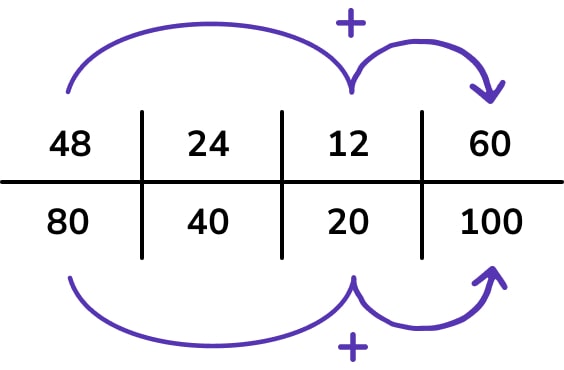
Splitting an amount into a given ratio
We can see the advantage of a ratio table here over the bar model – we’d need to draw a bar with 18 segments to represent this problem, which might end up quite fiddly!
To set up, we put the information we know from the question into a table:
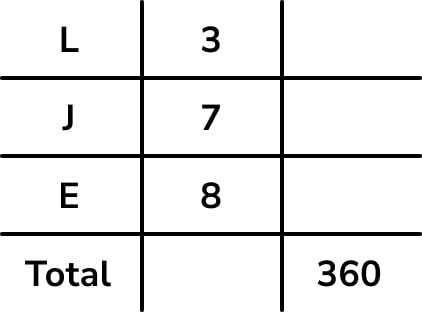
- The first column shows the number of parts in the ratio;
- The second column shows the total we’re aiming for (£360).
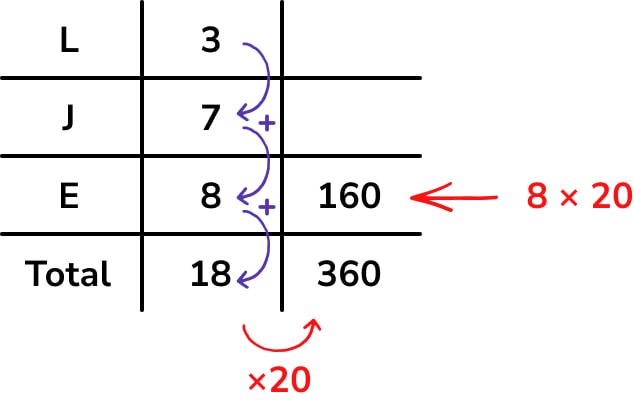
- Add together the parts in the ratio to find the total number of parts.
- Divide 360 by 18 to find the multiplier.
- Multiply 8 by 20 to get Emma’s amount, £160.
Finding missing amounts in a ratio
Students find this type of problem-solving question with linked ratios really difficult, particularly in organising their work and making it clear which number is part of which ratio.
Set up the ratio table to solve this problem as follows:
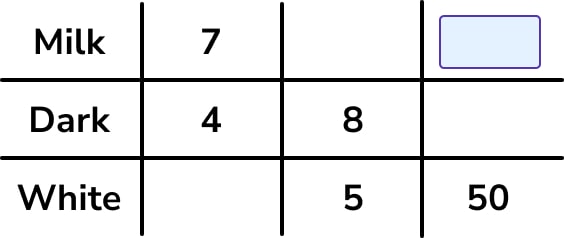
- Draw rows for milk, dark and white chocolates;
- Write the two separate ratios given in the question in two separate columns;
- We also know there are 50 white chocolates, so we can add that information in a third column.
We then look for links within the table to try and find the missing number of milk chocolates. This is how I approached the problem:
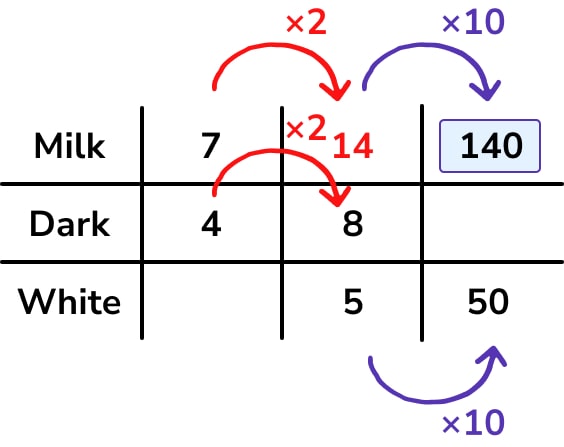
- Use the information about dark chocolate to find the link between columns 1 and 2 – we’re multiplying by 2, so we then have the ratio 14:8:5 for milk:dark:white.
- Use the information about white chocolate to multiply up for the number of white chocolates we have – we’re multiplying by 10, so the number of milk chocolates must be 140.
Exchange rates
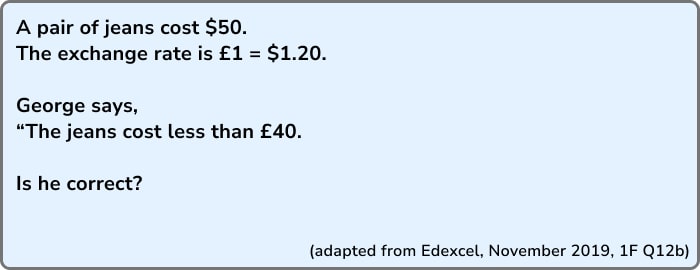
Exchange rates are an example of simple direct proportion which frequently occurs on GCSE exam papers. Here’s the approach I’d take to this question using a ratio table:
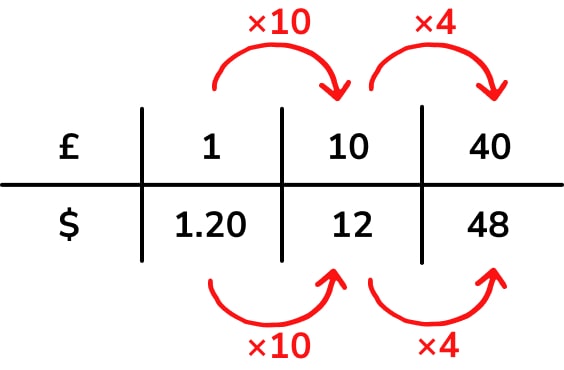
- Multiply by 10 to find £10 = $12.
- Multiply by 4 to find £40 = $48.
£40 is $48, so George’s statement is incorrect.
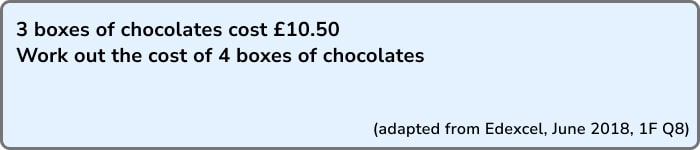
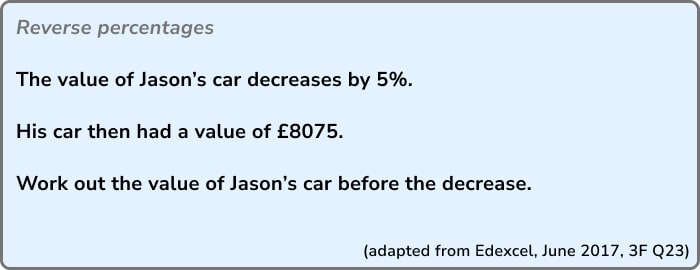
Reverse percentage
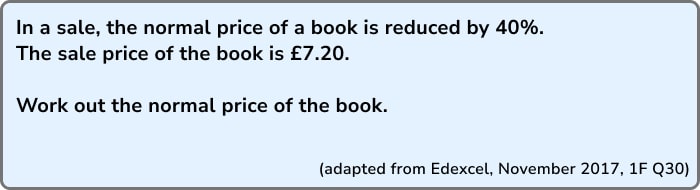
In a reverse percentage problem, the key is ensuring that learners recognise that they aren’t starting with 100%. A ratio table can help as it can encourage them to pause and think more critically about the percentage they write underneath the sale price – here, the reduction is 40%, so £7.20 is 60% of the original price.
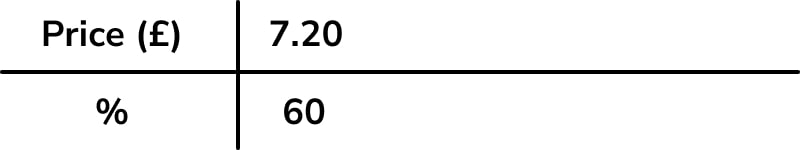
A strategy to solve is as follows:
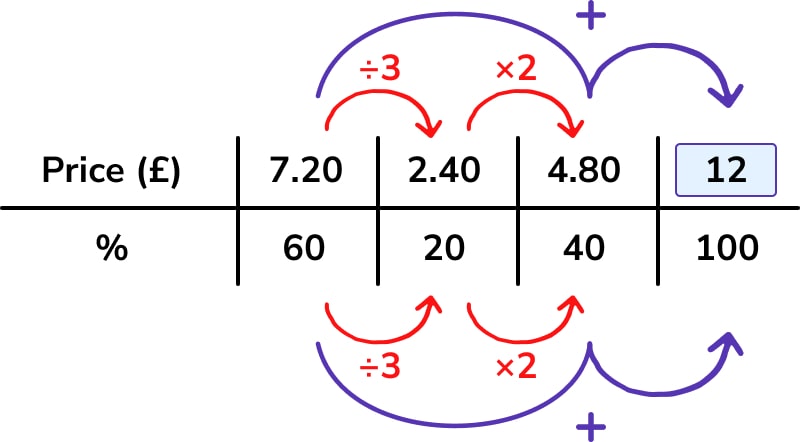
- Divide by 3 to find 20%.
- Multiply 20% by 2 to find 40%.
- Add 60% and 40% to find the original amount, 100%.
An alternative strategy could have been finding 10% by dividing by 6, then multiplying by 10.
See also: Ratio to Percentage
Speed, distance, time conversions
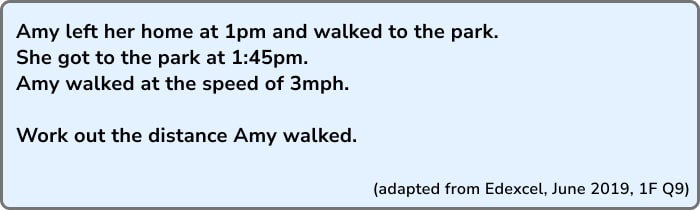
Ratio tables can be used for speed distance time problems. Speed problems, particularly those involving change of units, can be quite challenging for learners. A common misconception is doing something like 0.25 of an hour is 25 minutes, which throws the whole question out.
When using a ratio table for speed problems, the key is in the set-up – speed is the distance covered per unit of time:
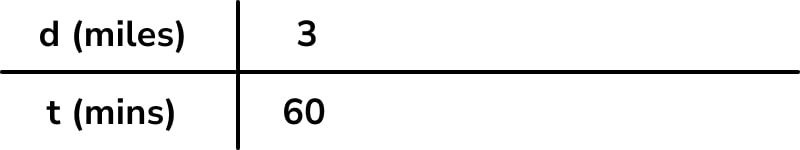
Here, we have Amy’s speed as miles per hour – so when beginning the ratio table, we can write 3 miles = 1 hour, or (better for this question), go straight to 3 miles = 60 minutes. With compound measure problems, encourage students to note the units they’re working with at the start of the table.
Here is one strategy to then find the quantity required in the question (the distance covered in 45 minutes):
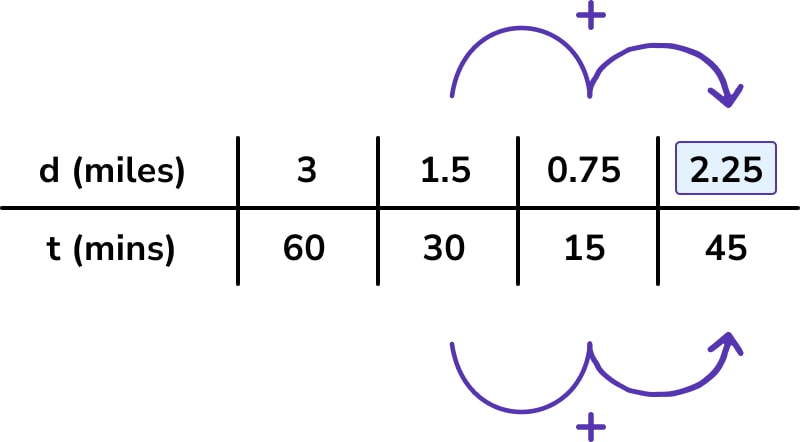
- Half each quantity to find the distance covered in 30 minutes.
- Half again to find the distance covered in 15 minutes.
- Add the quantities for 30 and 15 minutes (1.5+0.75) to get 2.25 miles.
Students seem to like the strategy of halving and halving again if they can’t immediately see a route through the problem. Hopefully in this situation, many of them would go on to spot that they could make 45 minutes from 30 and 15 minutes.
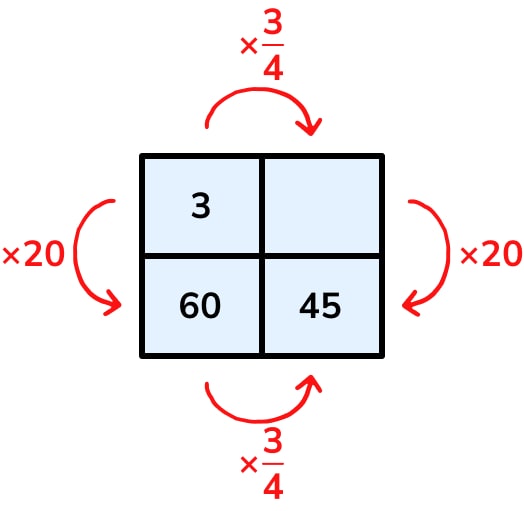
On the other hand, the contracted ratio table for this problem isn’t particularly helpful, especially considering that this is a non-calculator question. I’d argue that most Foundation students would be unlikely to spot the multiplier of \frac{3}{4}, and similarly may struggle to work vertically as this involves dividing 45 by 20.
If we consider how a student may answer this using the standard formula (or formula triangle):
d=s×t
We’d probably see misconceptions with incompatible units – i.e. simply multiplying speed in mph by time in minutes:
d=3×45=135 miles (clearly incorrect)
Students who realised a unit change was needed would probably end up with:
d=3×0.75 or d=3\times\frac{3}{4}
I’ve definitely taught students who would be put off by these calculations, not realising that they’re just finding \frac{3}{4} of 3. It is these students who I think benefit most from breaking calculations down using ratio tables.
Pressure
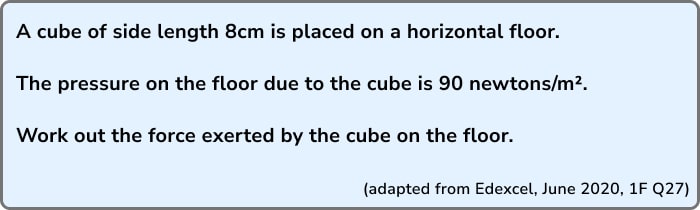
In this problem, students first need to realise that they need to work out the area of the square face of the cube resting on the floor. Unfortunately, ratio tables can’t help with this bit, but once they’re past that initial calculation to find that the area is 64cm², they can proceed with a ratio table for the pressure calculation.
As with speed problems, the set-up involves interpreting pressure as “the force per 1 square metre” and beginning the table with this information:
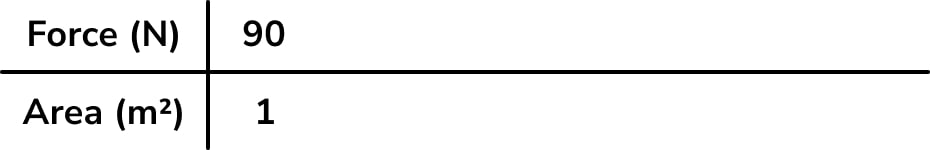
Here is one possible approach:
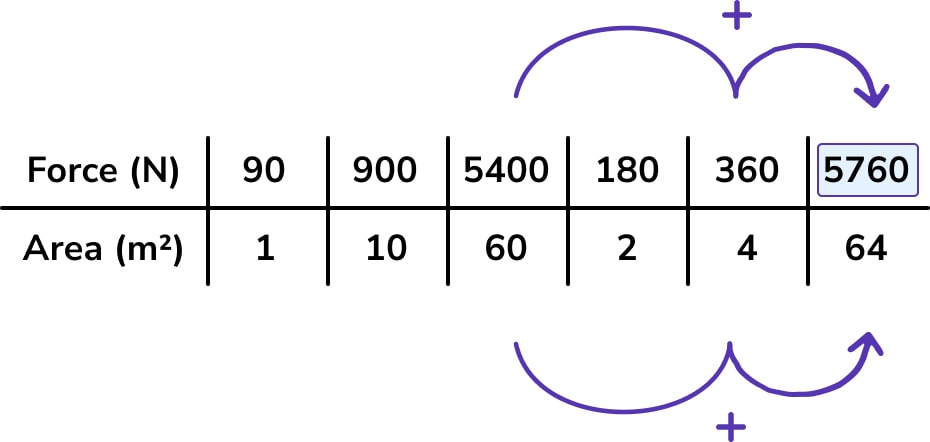
- Multiply by 10, then 6 to work out that 5400N corresponds to an area of 60cm².
- Starting again from the first column, double and double again to find that 360N corresponds to 4cm².
- Finally, add the quantities for 60cm² and 4cm² to find the total force for 64cm², which is 5760N.
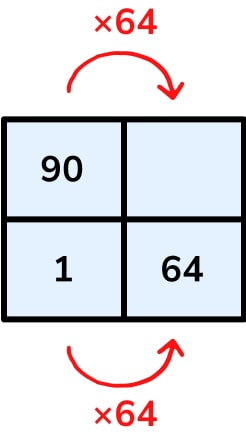
A contracted ratio table is also useful in this problem, as the single-step calculation involved is fairly manageable:
Scale drawing
Ratio tables are really powerful for ratio scale drawing problems, when students often forget what needs to be divided by what, and are often put off by decimal quantities in scales.
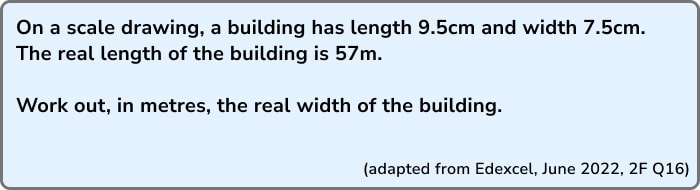
Although this question originally came from a calculator paper, the ratio table provides a useful structure to work with, assisting students with getting the calculations in the right order.
We set up with the known information from the question – we have a pair of values (drawing and real) for the length of the building, so this is how we begin our table:
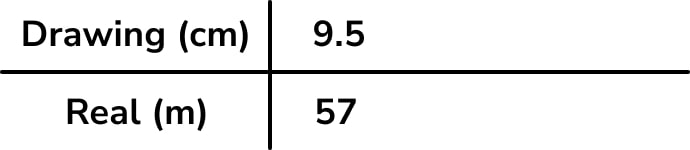
We then add some more information to the table. Because we have access to a calculator for this question, it’s quite easy to find what 1cm on the drawing represents in real life – this is the unitary method we teach throughout proportional reasoning work:
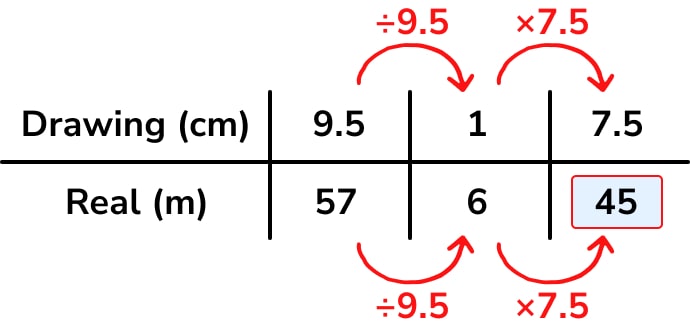
- Divide by 9.5 to find out what 1cm on the drawing represents in real life.
- Multiply up by 7.5 to work out that 7.5cm = 45m.
Students who are more confident with finding single proportional multipliers may prefer a contracted ratio table – I think this is very useful even for more advanced learners in making sure they actually multiply or divide the correct numbers!
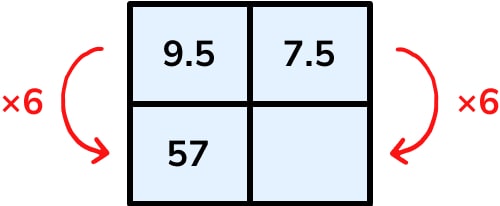
We see here the efficiency of moving between rows rather than along columns, as this quickly reveals that the scale of the drawing is 1cm : 6m, so a shorter route through the problem is to multiply the width of the drawing in centimetres by 6 to find the width of the building in metres.
Ratio table word problems and multi-step problems
Ratio tables lend themselves well to context-based problem-solving, particularly worded problems or multi-step scenarios requiring students to complete multiple linked calculations.
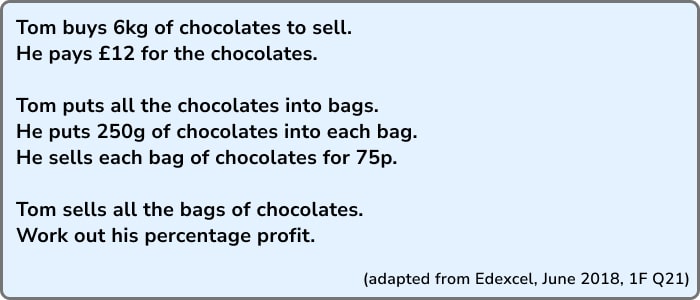
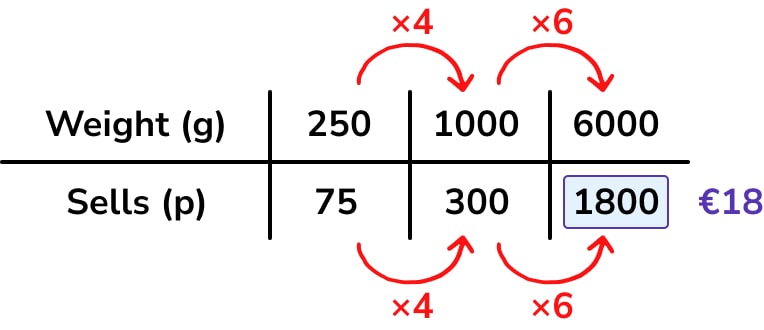
It is possible to solve this type of problem with most of the information on one large ratio table, followed by the necessary percentage profit calculation, as demonstrated below. We put all of the information about the chocolate purchase (6kg or 6000g costs Tom £12) in the first column of the table, and the information about the bag portioning and sales (250g in a bag, each of which costs 75p):
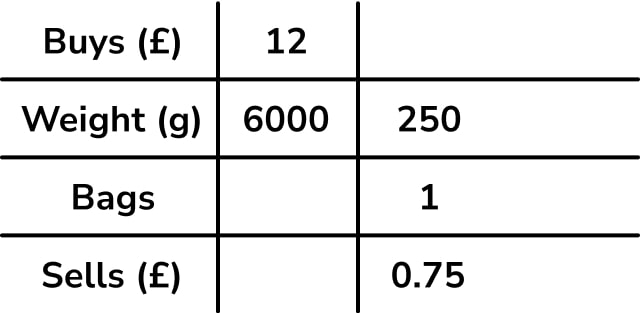
To solve the problem, we need to work out how much Tom sells his 6000g of chocolates for. I worked as follows:
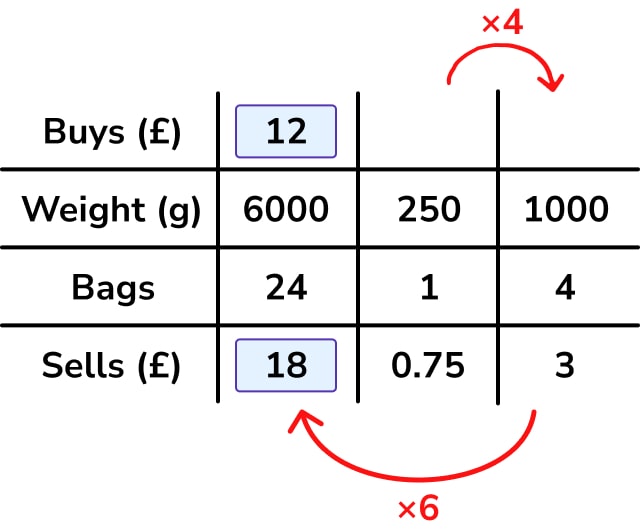
- Multiply the second column by 4 to work out the quantities for 1000g of chocolates.
- Multiply the third column by 6 to get quantities for 6000g of chocolates.
We know now that Tom buys for £12 and sells for £18. His profit is £6. We could now use a ratio table to calculate his percentage profit – however, for many students, this part of the calculation could probably be done mentally.
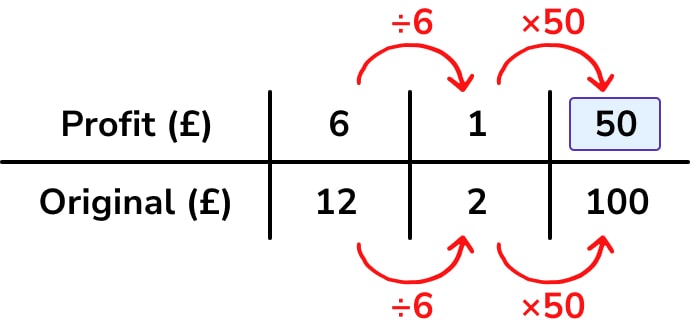
I wouldn’t necessarily expect students to construct a large ratio table as above – they may prefer to separate the calculations onto different tables. In fact, for this problem, students may only need a table for the “sales” part of the calculation:
You can see another example of a multi-step calculation problem in the worked practice problems at the bottom of the page.
Ratio table practice problems
Here are some practice problems using ratio tables.
For each one, set up a table, then find a pathway to the solution.
The HINT will give you a suggested table set-up for each problem.
Please bear in mind that there are multiple different ratio table solutions for each problem.
Hint
Solution
£36
Explanation
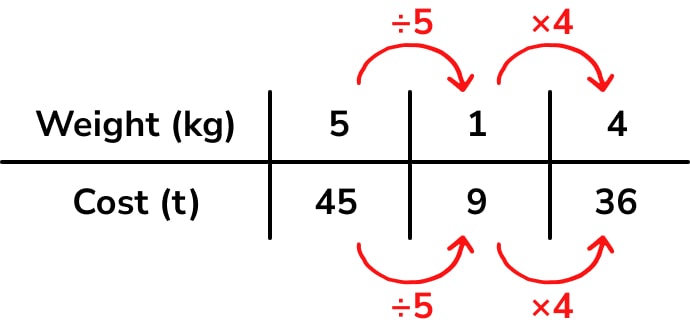
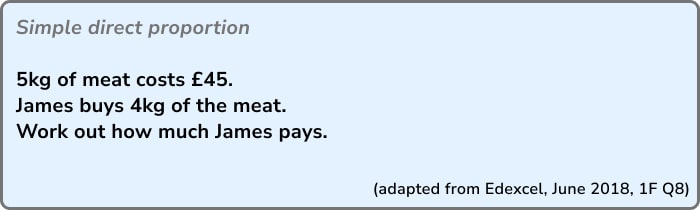
1. Divide each quantity in column 1 by 5 to find out what 1kg of meat costs.
2. Multiply each quantity in column 2 by 4 to calculate the cost of 4kg of meat as required in the question (£36).
Hint
The first step in solving this problem is to increase £18 by 30%. This can be done on a ratio table as follows:

Any alternative method could also be used.
The ratio table for the rest of the problem is set up as follows:
Solution
£1.17
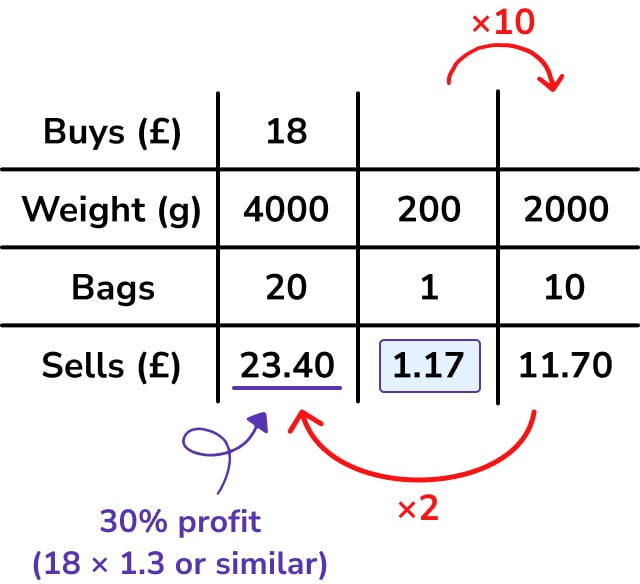
Explanation
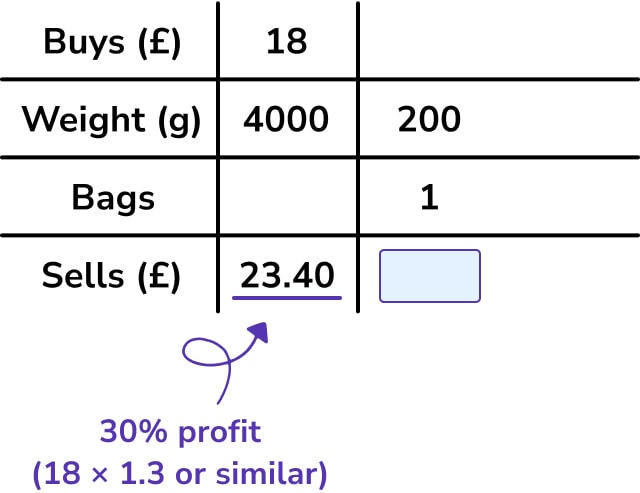
First, to work out how many bags Wasim can fill:
1. Multiply the amounts in column 2 by 10 to get the amounts for 2000g of sweets.
2. Multiply the number of bags in column 3 by 2 to get the missing number of bags for 4000g of sweets (20 bags).
Now work backwards to find the cost of one bag:
1. Divide £23.40 by 2 to get the cost of 10 bags of sweets (£11.70).
2. Divide £11.70 by 10 to get the cost of 1 bag of sweets (£1.17).
Each of these calculations could have been done in a single step as a multiplication and division by 20 – however, I think most students using ratio tables for this type of problem would work in stages, particularly as it makes the division calculation £23.40 ÷ 20 more accessible without a calculator.
Hint
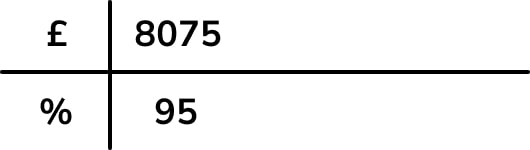
£8075 represents 95%, so begin the table with these quantities:
Solution
£8500
We can use a ratio table to structure a unitary method calculation:
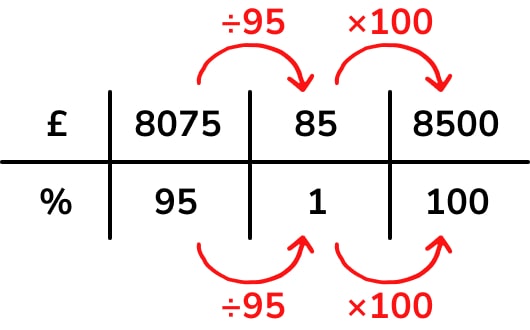
Or an alternative route through the problem:
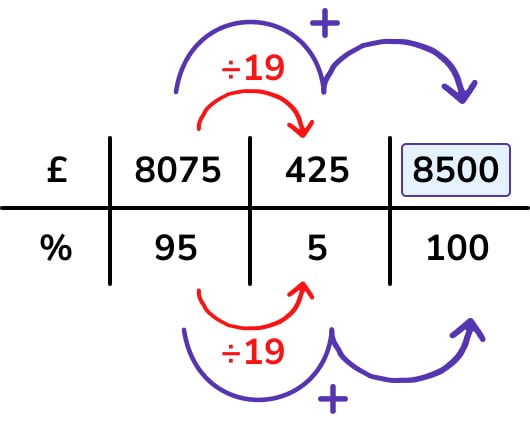
Explanation
1. Divide by 19 to find 5%.
2. Add the quantities for 95% and 5% together to find the original amount (100%).
Hint
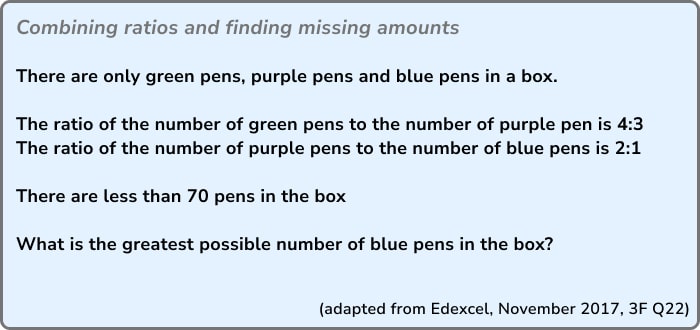
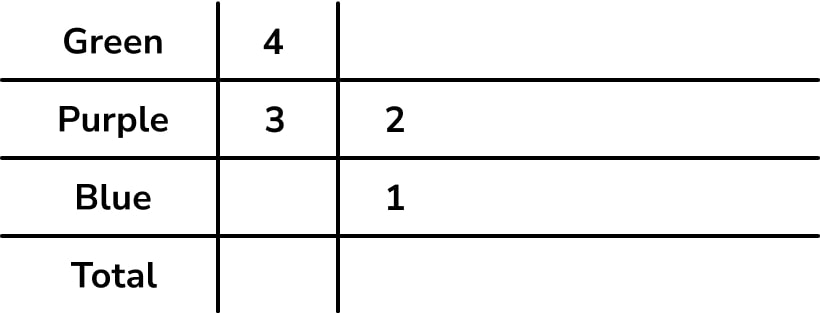
Each ratio is a column on the table – so put the information about green : purple in column 1, and the information about purple : blue in column 2.
Solution
The greatest possible number of blue pens is 12.
Explanation
The first step is to combine both ratios into a single three-part ratio:
Then we multiply up until we find the total closest to, but not exceeding, 70:
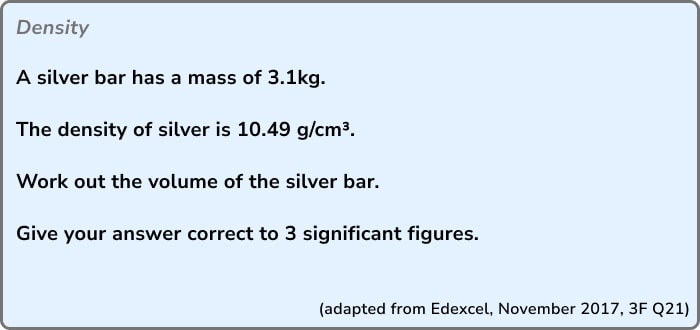
Hint
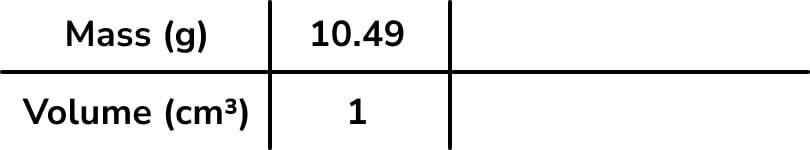
As this is a compound measures problem, remember to think about density as the mass per 1cm³ to begin the table:
Solution
296cm³
Explanation
Note that this question is adapted from a calculator paper exam question, so we use the ratio table to structure a unitary method calculation:
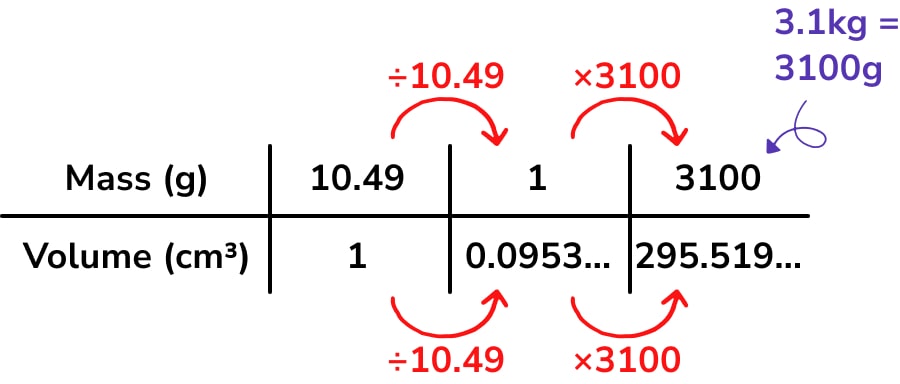
1. Divide by 10.49 to find the volume for 1g of silver.
2. Multiply by 3100 to find the required quantity – 3.1kg or 3100g of silver has volume 296cm³ to 3 significant figures.
For more GCSE practice questions, see also: Venn diagram questions & Simultaneous equations questions
The beauty of ratio tables is that they support multiple strategies or pathways through a problem. They are a model, rather than a method, so there will be multiple valid solutions for any given table.
However there are a few useful strategies to think about:
-Students often like to go down the route of doubling or halving quantities;
-It’s also important to provide them with examples of dividing or multiplying by other numbers (particularly 3 and 5);
-I also work on the unitary method with them, particularly on calculator problems – finding “one” or 1% of an amount can be very useful, as can working with tens or 10%.
In my experience, the ratio table is best introduced at an appropriate point after students have experience of bar modelling and working with double number lines. If used in isolation from these earlier models, there’s a danger that the ratio table turns into “a method” rather than a model underpinned by deep understanding.
Motivate use of the ratio table by problems requiring students to work with small amounts at one end of a bar or double number line. The ratio table provides a structure for them to record this working out.
When introducing ratio tables, it’s useful to give students time to play around with the numbers – initially ask them to write down other quantities they can work out, rather than working towards a particular goal.
A ratio table is useful because:
-It provides a structured way for students to demonstrate their working for a multi-step problem;
-It offers an alternative approach to using formula triangles for compound measure calculations;
-Students can begin to make multiplicative links between columns and rows – a good way to introduce percentage multipliers, for example;
-Students can use one when they can’t see the full pathway through a problem to a solution – a ratio table encourages them to attempt some working out.
It depends on your students and what stage they are at in their mathematical development.
While ratio tables are useful for structuring problems and supporting students, they do not always represent the most efficient way to solve a problem. For example, I would expect students aiming for a grade 6+ on the Higher paper to be competent enough in their algebra skills to be able to rearrange compound measure formulae correctly, and it would do them a disservice to insist they continue to use ratio tables throughout their GCSE study.
However, some students are just not ready for this by the time we ask them to sit GCSE exams at the end of Year 11. For these students, I feel that ratio tables are an appropriate stopping point.
Personally, I find that I naturally gravitate towards ratio tables for things like speed, distance, time, and ratio combination problems – despite having the mathematical skills to solve these problems efficiently in other ways, I find the structure of a ratio table to be a useful way to record my own working out. So you might find them creeping into your personal mathematical toolkit as well!
References and further reading
Proportional reasoning on Edexcel June 2015 P1
The post from 2015 that sparked the idea for this blog.
Realistic Maths Education: The ratio table
A great discussion about RME’s approach to ratio tables, including a look at extended vs contracted tables.
Ratio tables across the curriculum A superb blog from Kathryn (@arithmaticks) about her Maths Conference sessions on ratio tables.
You may also be interested in:
DO YOU HAVE STUDENTS WHO NEED MORE SUPPORT IN MATHS?
Skye – our AI maths tutor built by teachers – gives students personalised one-to-one lessons that address learning gaps and build confidence.
Since 2013 we’ve taught over 2 million hours of maths lessons to more than 170,000 students to help them become fluent, able mathematicians.
Explore our AI maths tutoring or find out about maths tuition for your school.