
GCSE Maths 2025 Summary: Insights, Highlights & What’s Next
The best maths preparation isn’t just about covering content, it’s about knowing which content matters most and how it’s likely to be tested. For senior leaders, heads of maths and teachers, these patterns reveal crucial insights about where your next Year 11 cohort might struggle, which topics deserve extra attention, and how to focus your department’s energy for maximum impact.
From missing transformations at Foundation to an emphasis on procedural questions, in this article, GCSE maths expert Christine Norledge looks at each trend and offers practical insights that can sharpen your department’s approach and give your students the edge they need to succeed.
Highlights from the 2025 GCSE Maths papers
- The 2025 Edexcel GCSE maths papers were broadly similar to 2024, combining procedural and problem-solving questions with topic coverage close to historic averages.
- Foundation papers felt familiar and manageable for well-prepared students, though some common questions lacked scaffolding and may have posed challenges for weaker candidates.
- Higher papers followed familiar patterns, with no major surprises; even the most demanding problems were similar to past exam questions, favouring stronger students.
- Foundation grade boundaries were almost identical to 2024.
- Higher grade boundaries showed a major shift, with boundaries for grades 7-9 being 16-17 marks higher than the average since 2017.
- Across both tiers, there was an increase in procedural (C1) questions and a drop in reasoning (C2), especially in Statistics. This limited the opportunities for students to earn explanation marks.
Stay updated for 2026 GCSE season
Join our email list to be alerted to any new changes to GCSE maths exams in 2026.
We’ve got all the GCSE dates 2026 and we will be reviewing the contents of each of the GCSE maths papers in 2026 and taking a good look at the GCSE results 2026 in August.
Expected challenge in GCSE maths 2025 papers
Previously, exam boards have been quite open about the difficulties of balancing the predictability of papers with fairness to each cohort of students. There needs to be enough variability that the papers can’t be “guessed” every year, but not so many curveballs that students find the papers too difficult or too dissimilar from the practice problems they have been doing in lessons.
This year’s 2025 Edexcel GCSE maths papers generally felt very similar to 2024’s series. We saw a mix of procedural and problem-solving questions, with topic coverage broadly in line with historic averages.
As with every exam series, there are some omissions of content and some interesting “new” questions. We will look at these in detail and consider any implications for teaching this year’s cohort.
Here’s a more granular analysis for the 2025 GCSE maths paper 1 and GCSE maths paper 2.


GCSE Maths Topic List
Your go-to year-on-year GCSE maths topic list for every student to focus revision for exams. Covering all main GCSE math topics for Foundation and Higher with links to our library of free downloadable resources.
Download Free Now!2025 maths GCSE grade boundaries
GCSE grade boundaries this year tell an interesting story. At Foundation, boundaries were within one or two marks of last year’s, indicating that the 2025 cohort had a similar experience to students in 2024.
On the other hand, while at first glance, the Higher paper looked and felt like many other previous series, students appeared to have had a much easier ride this year. Grade boundaries are significantly higher than any previous Edexcel Higher GCSE maths paper since the GCSE reform in 2017.
The biggest variation occurs in the top grades (7, 8 and 9), with boundaries a massive 16-17 marks higher than the average of all series. This indicates that students, particularly stronger mathematicians aiming for a grade 7 or higher, found this year’s Edexcel Higher paper easier than usual.

How we measure complexity
In all of our GCSE paper analyses, we use the following measure of question complexity:
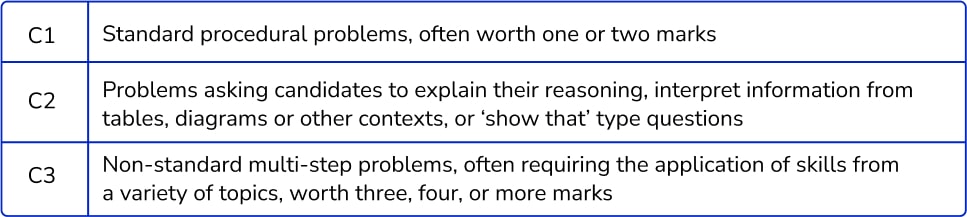
This is not necessarily a ‘difficulty’ measure. For example, ‘higher grade’ topics on each tier, such as simultaneous equations on the Foundation tier (3F Q30) or quadratic inequalities on the Higher tier (2H Q21), are often examined as standard procedural.
However, question complexity helps highlight where students may struggle, and also directs exam revision focus. Teachers can identify where it’s worth investing time in unfamiliar problems or contexts by targeting those topics most likely to be assessed in that way.
You can read about the analysis process used in our how to get ahead in Foundation GCSE maths and how to supercharge your higher GCSE maths lessons articles.
June 2025 GCSE Maths Papers: Foundation
2025’s Edexcel Foundation papers felt quite familiar in style and content; students who have prepared thoroughly using past exam papers would have been used to the types of questions that came up.
As is typical, the papers began with some 1-mark procedural questions before moving on to a couple more in-depth problems on lower-grade topics.
The common questions, those which appear on both Foundation and Higher papers, were mixed. While there was some accessible higher-grade work, some of the more in-depth problems (e.g. 1F Q24, 3F Q29) had limited scaffolding, and weaker candidates may have struggled.
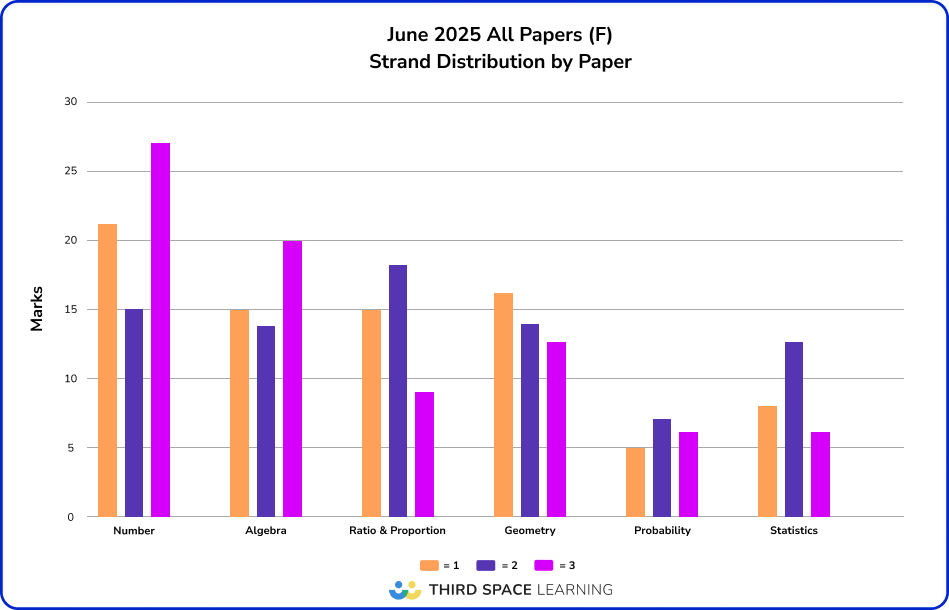
Number was the highest strand

In typical Edexcel Foundation paper fashion, Number topics attracted the most marks, followed by a roughly equal split between Algebra, Geometry and Ratio & Proportion.
This year’s Foundation papers had slightly more Algebra and slightly less Ratio & Proportion than the average paper, particularly noticeable on Paper 3.
| Strand | June 2025* | Average* |
| Number | 26% | 26% |
| Algebra | 20% | 19% |
| Ratio & Proportion | 18% | 20% |
| Geometry | 18% | 18% |
| Probability | 7.5% | 7.5% |
| Statistics | 10.5% | 9.5% |
*Rounded figures
Foundation favoured procedural problems
This year’s papers had more marks available in C1 questions than the average from all June series, but were roughly in line with last year’s figure of 59%.
However, that is not to say that students had an easy ride. These procedural problems included quite a bit of higher-grade work, including both a simultaneous equations question and expansion of double brackets on the final paper.

Number
Coverage and trends
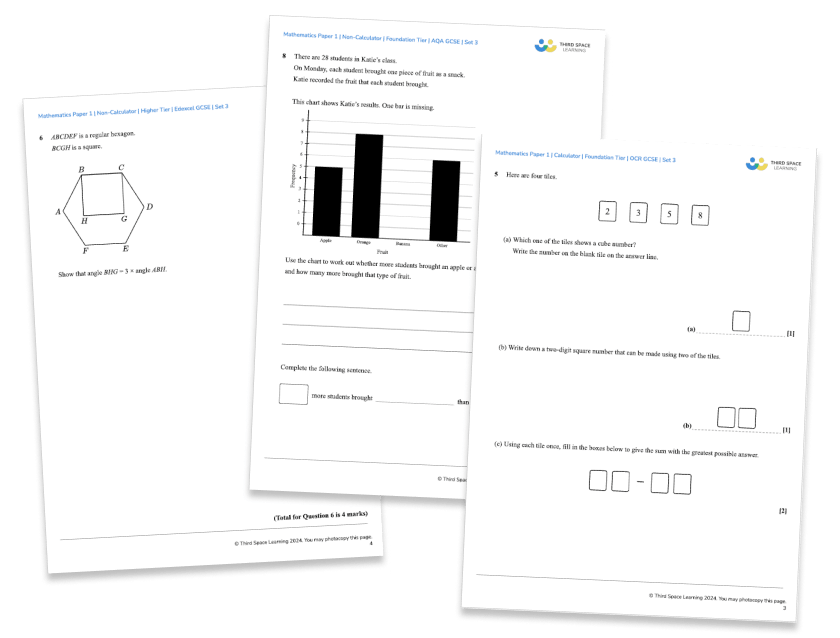
Number topic coverage was comprehensive, with most topics examined at least once. Many context-based number questions involved money, and some work in other strands also involved money calculations, such as the bar chart on Paper 1 (1F Q7).
There was also a lot of work involving fraction and percentage calculations. But many of these were “stand-alone” or more straightforward problems. Limited work required candidates to mix fractions, decimals and percentages in the same question.
Number gaps include:
- Order of operations
- Problem-solving using a combination of fractions, decimals and percentages
- Simple number properties (e.g. odds and evens)
Complexity

Most Number work was typically procedural, or required candidates to solve unfamiliar problems. There is usually less reasoning (C2) in the Number strand than in other areas.
Sample question style

Algebra
Coverage and trends
Since there was slightly more algebra in this series of Foundation papers than on average, most algebra topics were covered in some depth.
In addition to the usual work on algebraic manipulation and more straightforward equations, we also saw appearances from topics that are less frequently assessed at the Foundation level, such as solving a pair of simultaneous equations and expanding double brackets.
Algebra gaps include:
- Forming and solving equations from contexts (such as geometrical problems)
- Solving inequalities
- Work with non-linear graphs other than quadratics
Note that these topics are assessed less frequently at Foundation anyway.
Complexity

82% of the Algebra work was C1, a figure typical of Foundation papers. This reflects the fact that candidates find Algebra topics generally more challenging than Number or Ratio & Proportion.
Sample question style

Ratio and proportion
Coverage and trends
Less work on Ratio & Proportion this year was noticeable in particular topics within the strand. While there was plenty of work on context-based proportion (recipe proportion, 1F Q17 and best buy, 3F Q25), there was less work on ratio and percentage change than in some previous papers, with nothing on repeated percentage change in any paper.
Ratio & Proportion gaps include:
- Inverse proportion
- Proportion graphs
- Repeated percentage change (e.g. compound interest)
Complexity

This series favoured more procedural Ratio & Proportion questions than average, and the proportion of C3 problems was down compared to historic data, 40% in this series vs 50% overall.
That said, there was still a tricky ratio and fraction problem on Paper 1 (1F Q22), but we have seen series where there has been more than one of this type of problem!
Sample question style

Geometry
Coverage and trends
The number of marks available for Geometry this year was in line with historic averages, with typical levels of assessment of:
- 2D shape and angle properties
- Perimeter and area problems
- Scale drawing and bearings
And the addition of a couple of more infrequently-appearing topics, namely vectors and loci.
Geometry gaps include:
- Transformations (this was quite unusual)
- Circle properties and naming parts of a circle
- 3D shape properties
Complexity

Problem-solving in Geometry was directed towards angle reasoning and shape mensuration. Paper 3 posed an interesting problem, which required candidates to use the area of a trapezium in reverse and then apply Pythagoras’ theorem to find its perimeter. No doubt this was a really challenging question for Foundation students!
Sample question style

Probability and Statistics
Coverage and trends
Due to the limited amount of space on a set of three exam papers, it is common that not all topics in Probability and Statistics are assessed on every series.
2025’s profile was fairly typical, with quite a bit on single-event probability and mutually exclusive events, and frequency trees in Paper 3.
In Statistics, there was quite a bit of graph work, both bar charts and pie charts, appeared, plus a frequency polygon on the final paper.
Probability gaps include:
- Tree diagrams (it’s unusual to see both frequency trees and standard tree diagrams on the same series)
- Venn diagrams and set notation
Statistics gaps include:
- Average calculations with grouped data
- Data collection and sampling
- Scatter graphs
Complexity


There was more procedural Statistics work this year than usual. It’s usually a good place to target reasoning and explanation marks, but this year only 15% of the Statistics marks were C2, in contrast to an average of around a third (34%) on all papers.
Sample question style

Missing content from the 2025 Foundation Papers
Here’s a summary of the content gaps listed in the sections above. This is not an exhaustive list, and should not be used to try to predict what will be on next year’s exam papers.
Many of the topics in this list are viewed as “higher grade” topics, and so will not appear on every series.
| Number | Order of operations Fraction, decimal and percentage problem solving Simple number properties (e.g. odds and evens) |
| Algebra | Forming equations from contexts Solving linear inequalities Non-linear graphs other than quadratics |
| Ratio & Proportion | Inverse proportion Proportion graphs Repeated percentage change (e.g. compound interest) |
| Geometry | Transformations Circle properties 3D shape properties |
| Probability | Tree diagrams Venn diagrams and set notation |
| Statistics | Average calculations with grouped data Data collection and sampling Scatter graphs |
June 2025 GCSE Maths Papers: Higher
Similar to Foundation, 2025’s Edexcel Higher papers felt quite familiar in style and content; candidates who made good use of past exam papers in their preparation would have recognised the types of questions that came up.
The content in the common questions offered a fair start to the paper for most candidates. While Foundation students may have struggled with starting some of the more in-depth problems (e.g. 2H Q3), the mathematical content in these questions was relatively low-grade, and most Higher candidates should have been able to gain some marks here.
Although there were some tricky problems further on in the paper, there was nothing that felt massively novel. Even the most difficult problems (such as 1H Q17, involving composite functions) somehow felt “standard” – students would likely have had experience solving very similar questions while completing past papers. This question style would have particularly favoured stronger candidates, which may partially explain the higher grade boundaries at grades 7 and 8 this year.
As discussed in the 2025 GCSE Paper 1 analysis blog, one other unusual note about the first paper was the small number of questions. Students only had to tackle 17 questions compared to a historic average of around 22. The other two papers met the average, so we can assume this is a quirk of this year’s Paper 1 and not a structural change for next year’s Higher papers.

More Number than usual on this year’s Higher papers

As is typical for Edexcel Higher papers, Algebra topics attracted the most marks, followed by Geometry, then Number and Ratio & Proportion.
However, this year’s Higher papers had more Number work than average, and consequently, some of the other strands were slightly underrepresented. This may have been a factor in candidates finding the papers easier than usual.
2025’s Foundation papers had slightly more Algebra and slightly less Ratio & Proportion than the average paper; this felt particularly noticeable on Paper 3.
| Strand | June 2025* | Average* |
| Number | 18% | 14% |
| Algebra | 28% | 29% |
| Ratio & Proportion | 16% | 17% |
| Geometry | 23% | 25% |
| Probability | 8% | 7% |
| Statistics | 7% | 8% |
*Rounded figures
More procedural, less reasoning
Similarly to the Foundation papers, this year’s Higher series had more marks available in C1 problems than the average from all June series.
More remarkable is the lower proportion of C2 marks: questions which involve reasoning, explaining answers or synthesising information from charts or graphs. This is partly due to the significantly lower-than-average proportion of C2 marks in the Statistics strand this year.
Interestingly, the proportion of C3 marks available is slightly higher than average, particularly when combined with the raises in grade boundaries on the Higher papers this year.
This further supports my theory that the type of C3 questions asked this year must have felt more accessible to students due to the familiarity of style and lack of curveballs.

Number
Coverage and trends
Number topic coverage was more comprehensive than is typical on Higher papers. Consequently, some easier marks were available in the common questions. For example, over the three papers, HCF, LCM and product of prime factors were all assessed procedurally, for a total of six marks.
There was also some procedural work on error intervals, surds and standard form. Looking at Q9 and Q10 of Paper 3, there were four very accessible marks for standard form calculations and the use of a calculator. The standard form question in particular would not have been out of place on a Foundation paper, and it is unusual to see something this straightforward in the Higher-only content.
Number gaps include:
- Decimal calculations (usually in context at Higher)
- Problem-solving using a combination of fractions, decimals and percentages
Complexity profile

Over half of Number work was procedural (56%) or required candidates to solve unfamiliar problems (37%); there is usually less C2 reasoning in the Number strand than in other areas. Again, reflecting typical patterns, most number properties and integer calculations work is assessed procedurally, with more problem-solving when working with fraction and percentage representations and calculations.
Sample Question Style

Algebra
Coverage and trends
Algebra coverage this year was in line with historic averages, with most topics either assessed in stand-alone form or embedded in other questions.
There was quite a bit of graph work for candidates to tackle, including:
- Drawing inequalities on a graph (assessing graphs of straight lines as an embedded skill)
- Plotting a quadratic in the common questions
- Coordinate geometry, including the graph of a circle
Unusually, there was no work on sequences at all on this series, and quite a bit less work on forming or solving quadratics than has appeared previously.
Algebra gaps include:
- Linear, quadratic and other non-linear sequences.
- Forming and solving quadratic equations from contexts.
Complexity profile

The complexity profile for Algebra this year mostly followed historic trends, with higher-grade topics like solving systems containing non-linear equations assessed procedurally, and lower-grade topics such as coordinates or the equation of a line assessed via more in-depth problems (2H Q20).
However, this year’s paper had quite a lot of procedural work on solving equations, and it is unusual not to see any C3-type questions with solving linear or quadratic equations as the main topic.
Sample Question Style

Ratio and proportion
Coverage and trends
Despite the number of marks available for Ratio & Proportion work being slightly below average, coverage of topics in this strand was fairly standard with work on:
- Compound measures (speed and density)
- Proportion equations
- A range of ratio calculations
Ratio work was also embedded in other problems, such as the equation of a line question on Paper 2 (2H Q20).
We also saw a couple of topics that appear less frequently: estimating gradients and areas under travel graphs, and population growth. The former was worth seven marks in total and was a fair, accessible problem for more competent mathematicians.
Ratio & Proportion gaps include:
- Repeated percentage change (e.g. compound interest)
- Proportion and other real-life graphs (less frequently assessed on Higher)
Complexity Profile

We frequently see Ratio & Proportion topics at Higher assessed via problem-solving as opposed to procedural questions, and this trend has continued with the 2025 papers. In fact, this year’s proportion of C3 questions is 8% higher than the average of all Higher Edexcel series, with 68% of questions in this strand requiring some element of in-depth thinking.
That said, these C3 questions felt familiar (e.g. best buy 3H Q4), and stronger candidates would likely have found most of these fairly straightforward.
Sample Question Style

Geometry
Coverage and trends
Like the Ratio & Proportion strand, the number of marks available for Geometry topics was also slightly below average. There was less work on more straightforward Pythagoras and trigonometry, but quite a bit more on trigonometry using sine and cosine rules, area of a triangle and 3D trigonometry.
Work on transformation, congruence and similarity was mostly procedural; the transformation question in particular (1H Q9) represented an easy four marks for well-prepared candidates.
It’s become a bit of a tradition in these blogs that I comment every year on the lack of work on loci on Higher papers. To my knowledge, loci have not appeared on any Higher paper since the first assessment of the new specification in June 2017. This year has bucked that trend (2H Q4), although the topic was still only worth one mark.
Geometry gaps include:
- Scale drawing (less frequently assessed at Higher).
- Exact trigonometric values.
- Volume and surface area with compound measures.
- Surface area calculations.
Complexity Profile

Thanks to the procedural work on congruence, similarity and transformation, this year saw a slightly higher proportion of C1 questions in the Geometry strand than average, 58% compared to an all-series average of 64%.
However, the list of topics where we’re more likely to see C3 problem-solving has remained fairly consistent. Perimeter, area and volume, trigonometry and work on angle facts all required candidates to think in a little more depth.
Sample Question Style

Probability and Statistics
Coverage and trends
There were very few gaps in Probability in June 2025; the papers covered most topics in some way. Sometimes there’s repeated assessment of the same topics on different papers (usually problem-solving with multiple events), but this doesn’t seem to have happened to the same extent this year.
Paper 3 assessed Venn diagrams in depth (3H Q18) for six marks. Despite looking tricky (a three-part Venn and conditional probability), students have likely tackled very similar problems in past papers. Again, more competent mathematicians should have found this question straightforward.
Statistics saw typical coverage of Higher work on charts and graphs, with inclusion of box plots and histograms. Except for one five-mark question requiring students to problem-solve using mean calculations (2H Q6), assessment of average and range calculations was embedded in these graph problems.
Probability gaps include:
- Tree diagrams (explicitly presented as such – students could have used a tree diagram method to solve some questions).
Statistics gaps include:
- Time series graphs (infrequently assessed at Higher)
- Scatter graphs
- Cumulative frequency graphs
- Averages for grouped data
Complexity Profile


Looking at the complexity profile in Probability, there are significantly more C1 and C2 questions than usual; consequently, the number of marks available in C3 problems is below average, 15% vs the all-series average of 45%.
As in the Foundation, there was more procedural Statistics work in 2025. Although typically a good source of reasoning and explanation marks, this year only 13% of the Statistics marks fell into the C2 category, compared with the broader average of over a third (39%) across all papers.
Sample Question Style

Missing content from the June 2025 Higher papers
Here’s a summary of the content gaps listed in the sections above. This is not an exhaustive list, and should not be used to try to predict what will be on next year’s exam papers.
Some of the topics in this list are viewed as “lower grade” topics, and so will not appear on every series as they are limited to common questions or assessed as embedded skills.
| Number | Decimal calculations Problem-solving using a combination of fractions, decimals and percentages |
| Algebra | Linear sequences including the nth term Quadratic and geometric sequences Other non-linear sequences (e.g. Fibonacci) Forming and solving quadratic equations from contexts. |
| Ratio & Proportion | Repeated percentage change (e.g. compound interest) Proportion and other real life graphs |
| Geometry | Scale drawing Exact trigonometric values Volume and surface area with compound measures Surface area calculations |
| Probability | Tree diagrams |
| Statistics | Time series graphs Scatter graphs Cumulative frequency graphs Averages for grouped data |
Implications for 2026
Here are some teaching strategies to integrate the insights from this year’s exam papers into your teaching for the upcoming academic year:
Teaching content
- Sequence teaching: high-priority topics first, less frequent ones later.
- At Foundation, frontload Number, Ratio & Proportion and core Geometry.
- At Higher, make sure students’ Algebra knowledge is watertight.
Question types
- Incorporate challenging or unusual problems from previous year’s exams into teaching materials for the next cohort of Year 11s.
- Repeated or scaffolded variations of challenging problems can be especially beneficial.
- Include frequently-appearing topic crossovers in teaching materials and give students plenty of opportunity to practise these problems.
Assessment procedures
- Choose mock exam materials that reflect typical patterns of topic content and question types.
- Include a balance of procedural questions and reasoning/problem-solving.
- Use the GCSE maths mark schemes to implement consistent mock exam marking.
Data use and CPD
- Use student feedback from this year’s cohort to identify which questions they found difficult on the exams and determine if current learning materials need adjustments to address these gaps.
- Use the question-level analysis tools available from your exam board to identify gaps, either at the class or tier level, or for the whole cohort.
- Consider any teaching gaps in your department that are not reflected nationwide – this may indicate a need for departmental CPD or sharing of best practices on key topics.
DO YOU HAVE STUDENTS WHO NEED MORE SUPPORT IN MATHS?
Skye – our AI maths tutor built by teachers – gives students personalised one-to-one lessons that address learning gaps and build confidence.
Since 2013 we’ve taught over 2 million hours of maths lessons to more than 170,000 students to help them become fluent, able mathematicians.
Explore our AI maths tutoring or find out how our GCSE maths tutoring programmes could support students in your school.


![GCSE Maths Marking Decoded: How to Train Your Department and Boost Student Exam Performance [Video]](https://thirdspacelearning.com/wp-content/uploads/2026/02/Youtube-thumbnail_-GCSE-maths-marking-decoded-1-180x160.png)