FREE DOWNLOAD
Probability Distribution Worksheet

Help your students prepare for their Maths GCSE with this free probability distribution worksheet of 20+ questions and answers
- Section 1 of the probability distribution worksheet contains 20+ skills-based probability distribution questions, in 3 groups to support differentiation
- Section 2 contains 3 applied probability distribution questions with a mix of worded problems and deeper problem solving questions
- Section 3 contains 4 foundation and higher level GCSE exam style probability distribution questions
- Answers and a mark scheme for all probability distribution questions are provided
- Questions follow variation theory with plenty of opportunities for students to work independently at their own level
- All questions created by fully qualified expert secondary maths teachers
- Suitable for GCSE maths revision for AQA, OCR and Edexcel exam boards
Probability distribution at a glance
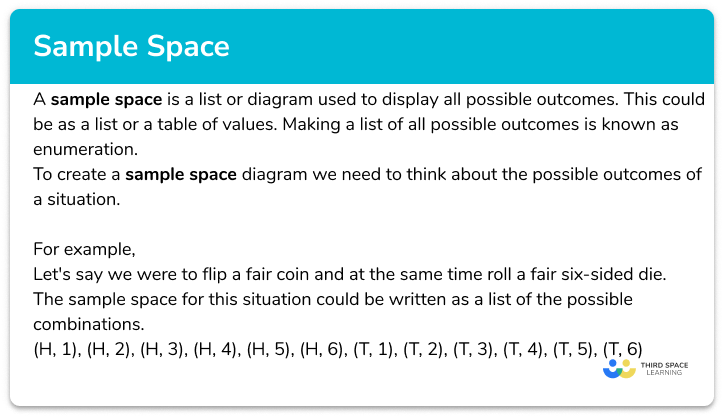
A probability distribution tells us the probability of each event occurring within the sample space. When rolling a dice, the discrete random variable is the possible outcomes of a roll (1, 2, 3, 4, 5, 6). The probability of rolling a number on this dice has a discrete probability distribution as each probability is equal to 1 out of 6.
A probability p in a probability distribution, can be written as a fraction, decimal or percentage and they are often given in a probability distribution table.
The probabilities of an exhaustive set of mutually exclusive events sum to 1. For example, let the random variable x represent the possible values that can be rolled on a fair 6 sided dice. When rolling the fair die, the probability of getting each number is 1 out of 6. This can be expressed as P(x=1)=1 out of 6, P(x=2)=1 out of 6, P(x=3)=1 out of 6, etc. There are 6 possible events and so if we add the probability of each event occurring, we get 1.
We can find missing probabilities by subtracting known probabilities from 1. For example, a spinner has 4 colours with the following probability distribution: P(Red)=0.1, P(Blue)=0.4, P(Green)=0.3, and P(Yellow)=x. The probability of landing on yellow is found by subtracting the other probabilities from 1. This is because the sum of the probabilities for these mutually exclusive events is 1. So we have P(Yellow)=1-(0.1+0.4+0.3)=0.2, so x=0.2.
Given a probability distribution, we can find the expected number of times a certain outcome will happen, known as the expected value. We do this by multiplying the probability by the number of trials (tosses). Let X represent the probability of flipping a coin and landing on Heads, P(X=Heads)=0.5. If we flipped the coin 100 times, we would expect the number of Heads to be 0.5✖100=50. Remember, this is just an estimate
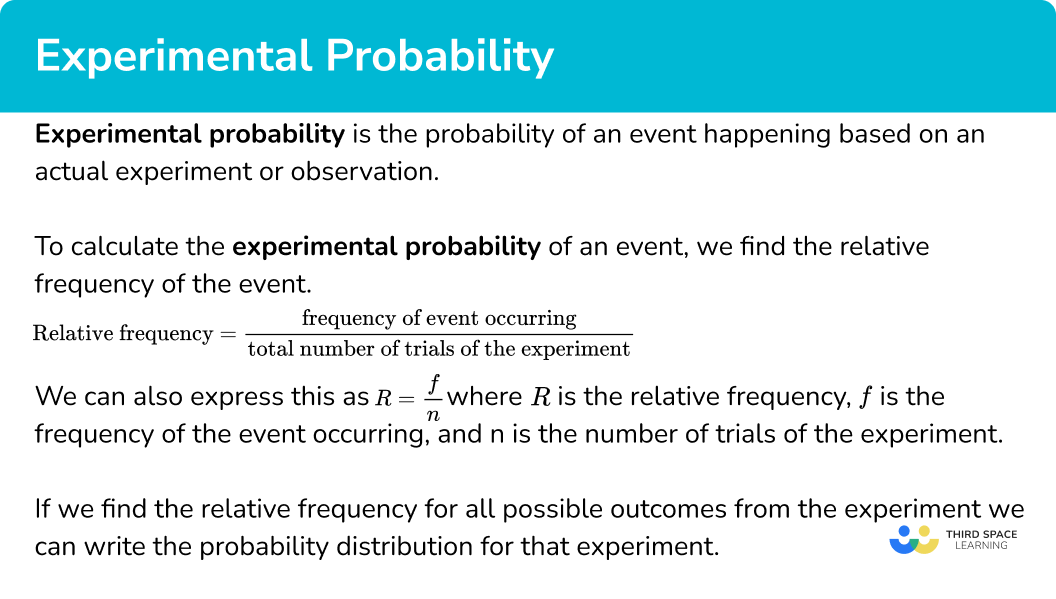
Experimental probability (also called relative frequency) is the probability of an event occurring based on previous events. This is useful when we don’t know the theoretical probability of an event occurring. For example, a high school is investigating how many students get to school by car on a given day. They record the number of students who travel to school by car every day for 1 month out of 800 students. The mean μ of students who travel by car is 200 out of 800 students, and so the experimental probability (or the probability of success) would be 200 out of 800, 0.25, or 25%.
Looking forward, students can then progress to additional probability worksheets, for example the random sample worksheet, the conditional probability worksheet, or the and / or probability worksheet.

For more teaching and learning support on Probability our GCSE maths lessons provide step by step support for all GCSE maths concepts.
Do you have students who need additional support?
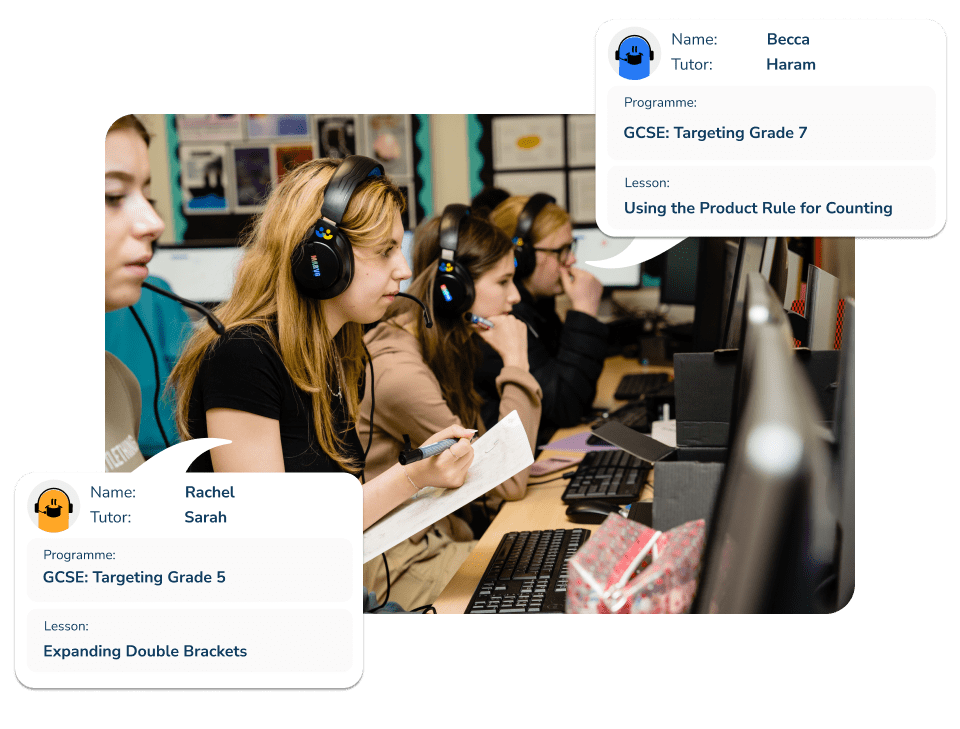
With Third Space Learning's secondary maths tutoring programmes, students in Year 7-11 receive regular one to one maths tutoring to address gaps, build confidence and boost progress.
"My confidence in the tutoring is high. We've had some phenomenal results. I even had one girl get a Grade 8 this year; she came to every tutoring session."
Stacey Atkins, Maths Director, Outwood Grange Academies Trust

