FREE DOWNLOAD
Graphing Sine, Cosine And Tangent Worksheet
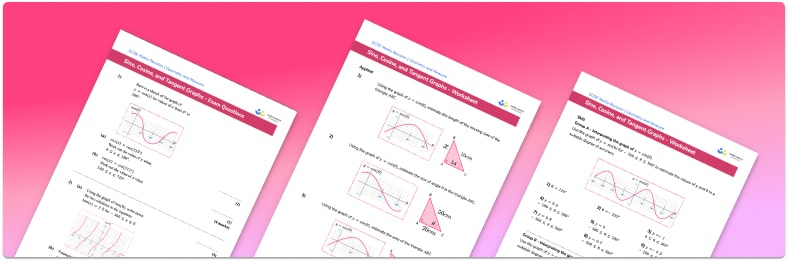
Help your students prepare for their Maths GCSE with this free graphing sine, cosine and tangent worksheet of 33 questions and answers
- Section 1 of the graphing sine, cosine and tangent worksheet contains 27 skills-based graphing sine, cosine and tangent questions, in 3 groups to support differentiation
- Section 2 contains 3 applied graphing sine, cosine and tangent questions with a mix of worded problems and deeper problem solving questions
- Section 3 contains 3 foundation and higher level GCSE exam style graphing sine, cosine and tangent questions
- Answers and a mark scheme for all graphing sine, cosine and tangent questions are provided
- Questions follow variation theory with plenty of opportunities for students to work independently at their own level
- All questions created by fully qualified expert secondary maths teachers
- Suitable for GCSE maths revision for AQA, OCR and Edexcel exam boards
Raise maths attainment across your school with hundreds of flexible and easy to use GCSE maths worksheets and lessons designed by teachers for teachers.
Graphing sine, cosine and tangent at a glance
By entering different values of x into the equations y=sin(x), y=cos(x) and y=tan(x), we can plot the graphs of the trig functions sine, cosine and tangent. The graphs can also be created using a unit circle.
We often plot the graphs for values of x from 0o to 360o but we can extend them to show any positive or negative angle.
There are some special features of graphs of trigonometric functions. The graphs of sine and cosine both have an amplitude of 1 and period of 360o. The graph of the tangent function is different from the others and has a period of 180o and also an asymptote every 180o.
Once we have plotted the graphs of the sine function, cosine function and tangent function, we can use these to find solutions, or approximate solutions, to equations involving sin x, cos x or tan x.
Transformations of graphs can also be applied to sine graphs, cosine graphs and tangent graphs. They can undergo stretches, horizontal and vertical shifts and reflections in the same way that any other graph can.
Looking forward, students can then progress to additional geometry worksheets, for example a 3D shapes worksheet or an area of a triangle worksheet.
For more teaching and learning support on Geometry our GCSE maths lessons provide step by step support for all GCSE maths concepts.
Do you have students who need additional support?

With Third Space Learning's secondary maths tutoring programmes, students in Year 7-11 receive regular one to one maths tutoring to address gaps, build confidence and boost progress.
"My confidence in the tutoring is high. We've had some phenomenal results. I even had one girl get a Grade 8 this year; she came to every tutoring session."
Stacey Atkins, Maths Director, Outwood Grange Academies Trust