GCSE Tutoring Programme
Our chosen students improved 1.19 of a grade on average - 0.45 more than those who didn't have the tutoring.
In order to access this I need to be confident with:
Coordinates maths Linear inequalities Straight line graphsThis topic is relevant for:

Inequalities On A Graph
Here we will learn about inequalities on a graph, including horizontal lines, vertical lines, systems of inequalities and shading regions.
You can also download the following free inequalities on a graph resources all suitable for those following Edexcel, AQA or OCR exam boards:
What are inequalities on a graph?
Inequalities on a graph allow us to visualise the regions that satisfy one or more inequalities.
In GCSE mathematics these inequalities are often linear and can be expressed using straight line graphs. You may have to use graphs already provided to find solutions to the inequalities or you may need to draw lines and indicate a region that satisfies the system of inequalities.
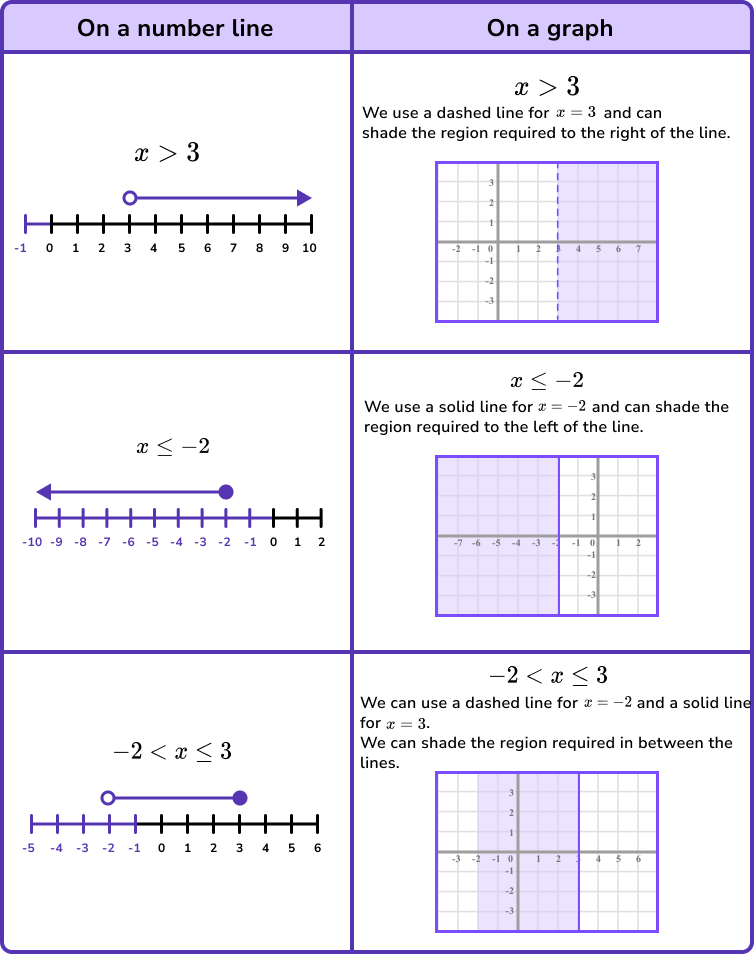
To do this we use the linear equations to plot straight line graphs using either a solid line or a dashed line.
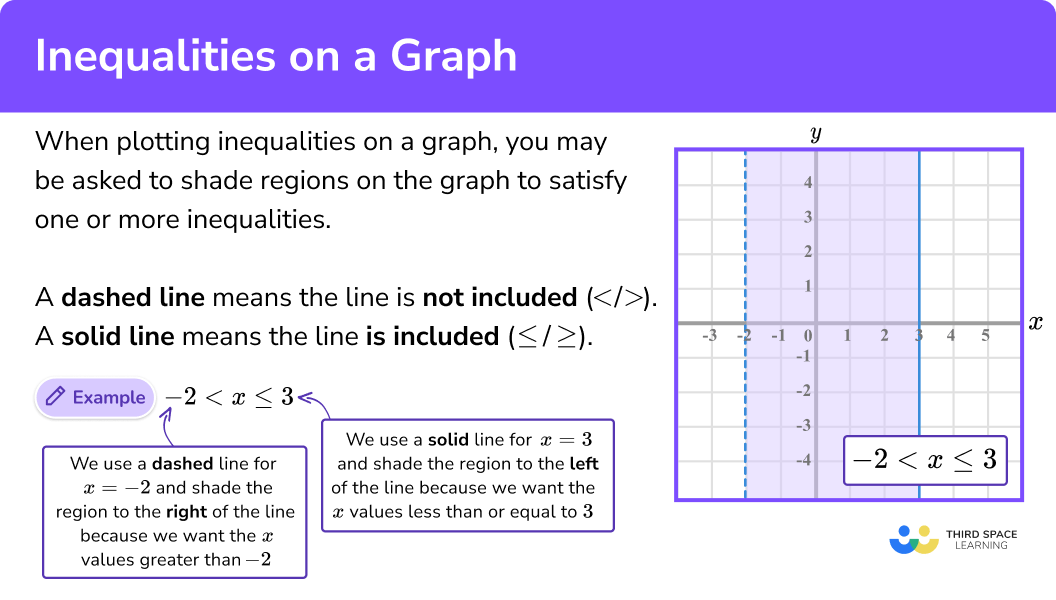
A solid line means the line is included.
A dashed or dotted line means the line is not included.
This is similar to using the solid (or closed) circle and open circles when displaying inequalities on a number line.
It is important to indicate the region required using the method requested in the question.
The question may ask you to shade a region required, it may ask you to indicate the region with a letter or it may ask you to indicate integer coordinates that satisfy a system of inequalities with crosses.
To get the correct region, think about what coordinates will satisfy the inequality.
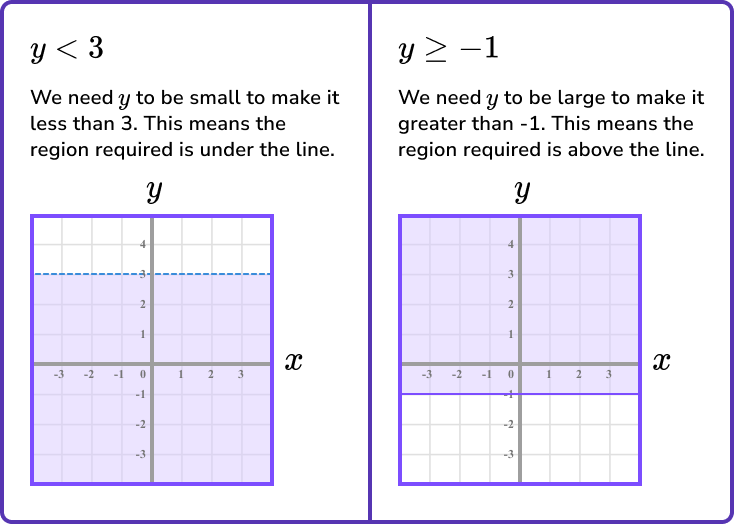
For horizontal inequality lines in the form y < a or y > a, you need to think about what the y coordinate could be.
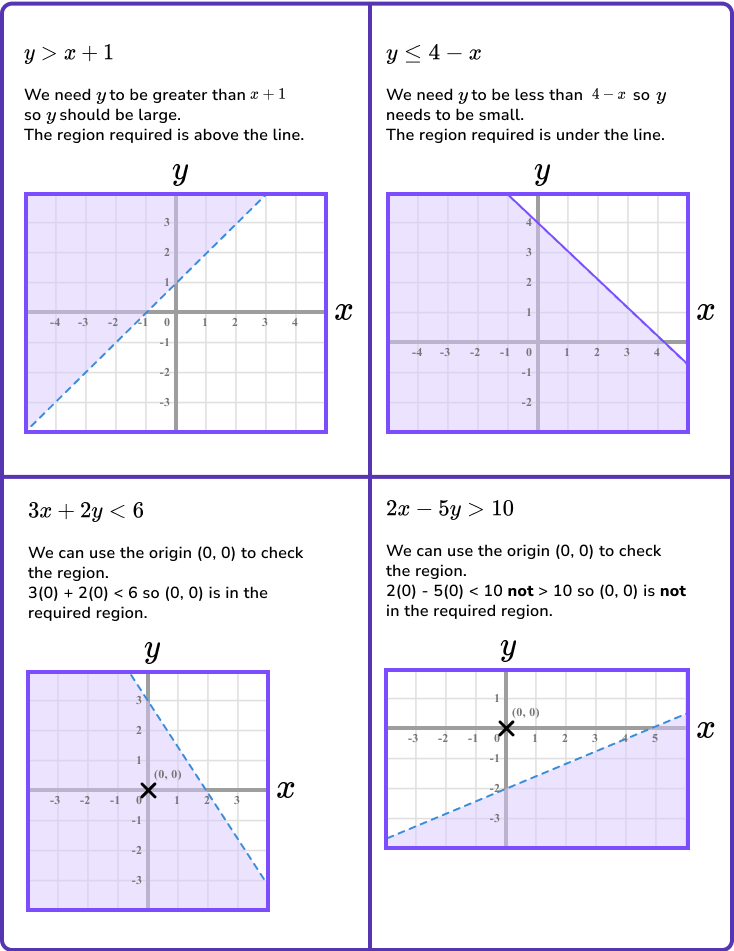
For lines that are not vertical or horizontal you can use the same thinking to find the correct region.
Step-by-step guide: How to plot a straight line graph
What are inequalities on a graph?
System of inequalities
For a system of inequalities you need to draw the regions that satisfy all of the inequalities stated.
For example,
In A level mathematics, more complicated functions such as quadratic equations or trigonometric functions may feature in inequalities questions. In A level further mathematics, systems of linear inequalities are solved in a topic called linear programming.
How to use inequalities on a graph
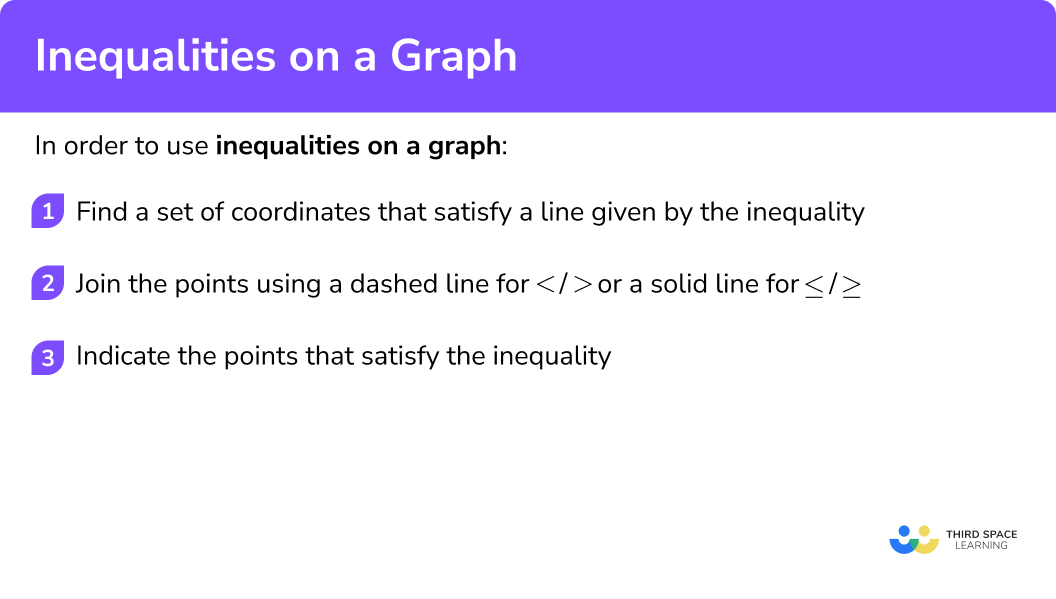
In order to use inequalities on a graph:
- Find a set of coordinates that satisfy a line given by the inequality.
- Join the points using a dashed line for \textbf{< / >} or a solid line for \bf{\leq / \geq.}
- Indicate the points that satisfy the inequality.
Explain how to use inequalities on a graph
Inequalities on a graph worksheet
Get your free inequalities on a graph worksheet of 20+ questions and answers. Includes reasoning and applied questions.
DOWNLOAD FREE Inequalities on a graph worksheet
Get your free inequalities on a graph worksheet of 20+ questions and answers. Includes reasoning and applied questions.
DOWNLOAD FREERelated lessons on inequalities
Inequalities on a graph is part of our series of lessons to support revision on inequalities. You may find it helpful to start with the main inequalities lesson for a summary of what to expect, or use the step by step guides below for further detail on individual topics. Other lessons in this series include:
Inequalities on a graph examples
Example 1: shading a region for a single inequality
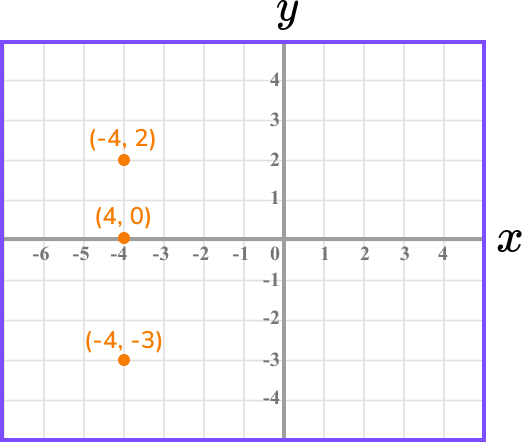
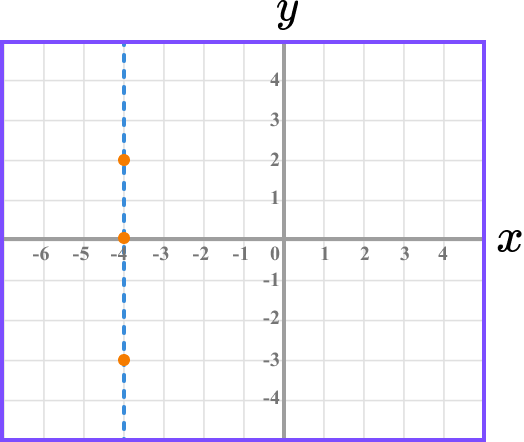
Shade the region that satisfies the inequality x>-4.
- Find a set of coordinates that satisfy a line given by the inequality.
You need points on the line x>-4.
Such as, (-4,-3), \ (-4,0), \ (-4,2), ...
2Join the points using a dashed line for \textbf{< / >} or a solid line for \bf{\leq / \geq.}
x>-4 will require a dashed line.
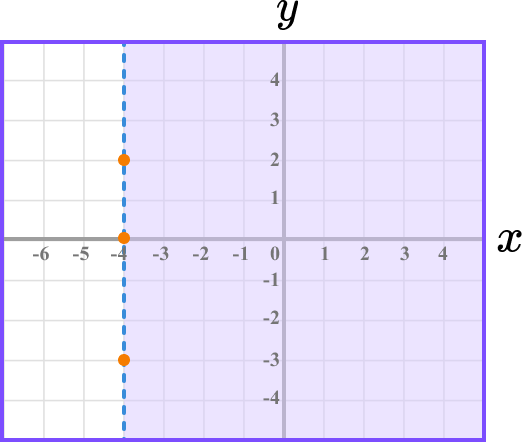
3Indicate the points that satisfy the inequality.
We want the values of x that are greater than -4, so shade the right hand side of the line.
Example 2: shade a region between two inequalities
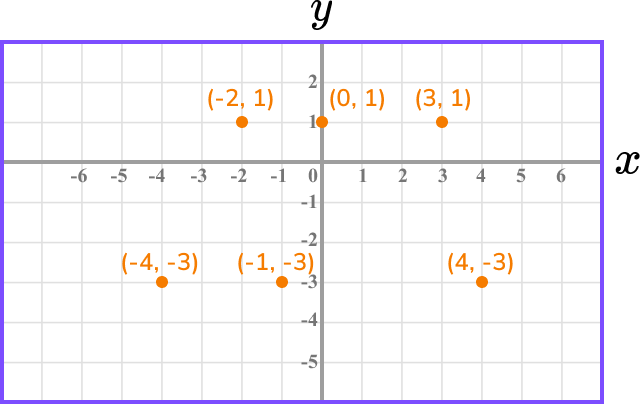
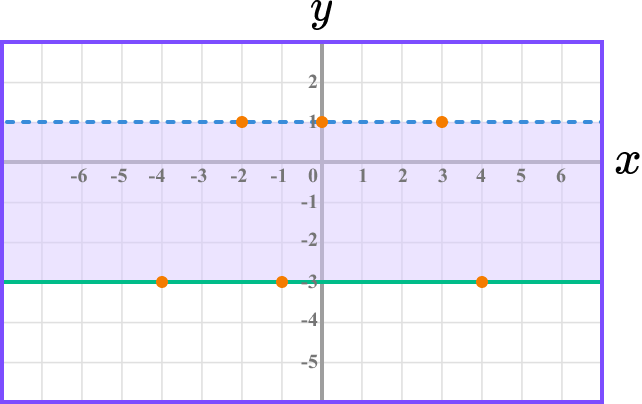
Shade the region that satisfies the inequality -3\le y<1 .
You need points on the line y=-3 and y=1.
Join the points on y=-3 with a solid line and the points on y=1 with a dashed line.
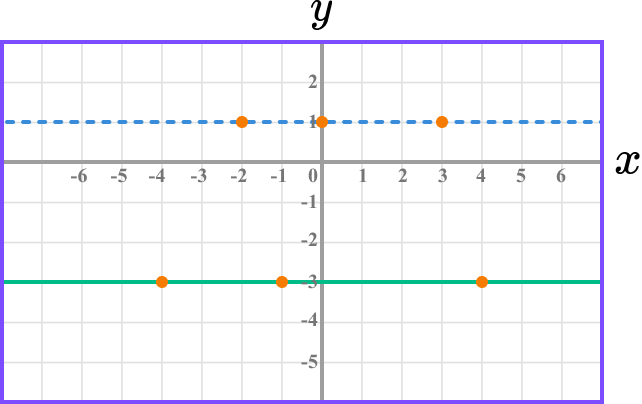
You are looking for y values between -3 and 1, so shade the region in between the two lines.
Example 3: shade the region for an inequality with a line in the form y = mx + c
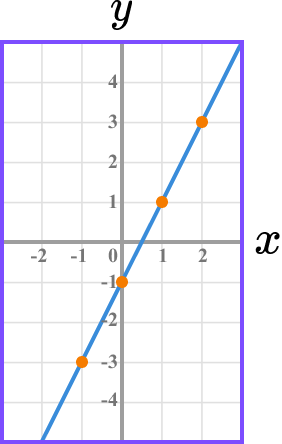
Shade the region that satisfies y\ge 2x-1.
Make a table of values for the line y=2x-1.
| x | -1 | 0 | 1 | 2 |
|---|---|---|---|---|
| y | -3 | -1 | 1 | 3 |
Plot the points and join with a solid line for the \geq symbol.
y needs to be greater than or equal to 2x-1, so y needs to be large. Shade above the line.
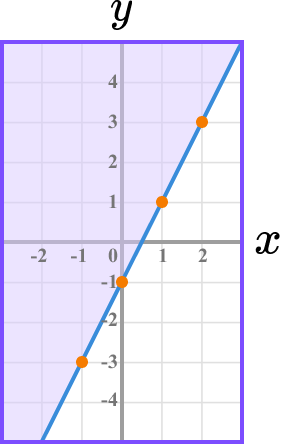
To check you have shaded the correct region, you can check that a point in the region satisfies the inequality. It doesn’t matter which point you pick, but choose integer coordinates to make the check easier.
Here let’s check the point (1,3). Substitute these values:
\begin{aligned} &3 \geq 2(1)-1 \\\\ &3 \geq 2-1 \\\\ &3 \geq 1 \end{aligned}
3 is greater than 1, so this is a true statement and you know you’ve selected the right region.
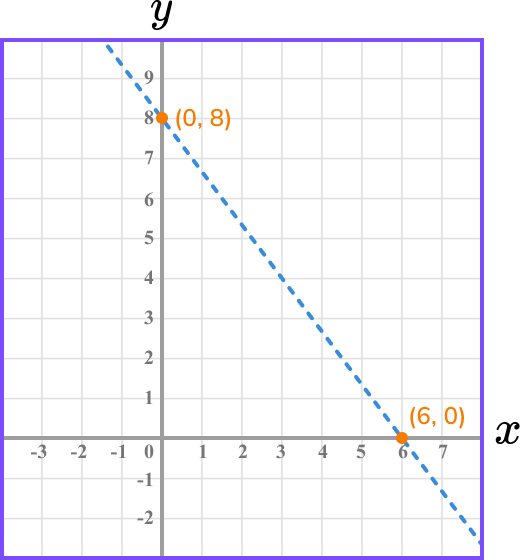
Example 4: indicate a region for an inequality with a line in the form ax + by = c
Indicate the region that satisfies the inequality 4x+3y < 24 with an R.
The line 4x+3y=24 can be plotted using a table of values or by finding the y intercept and x intercept by substituting x=0 for the y intercept and y=0 for the x intercept.
Step-by-step guide: Plotting graphs (coming soon)
When x=0,
4(0)+3y=24 gives y=8.
When y=0,
4x+3(0)=24 gives x=6.
The line 4x+3y=24 goes through the points (0,8) and (6,0).
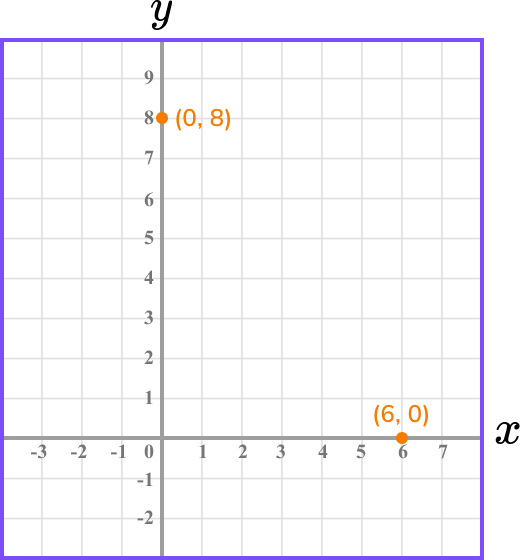
Join the points with a dashed line.
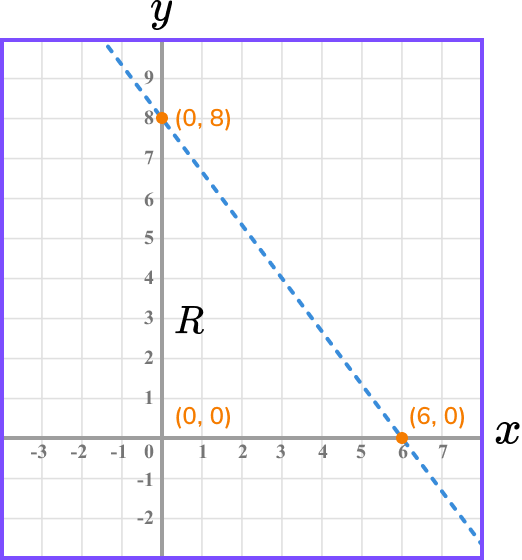
Using the point (0,0), 4(0)+3(0)<24.
Therefore, (0,0) satisfies the inequality.
Write an R under the line.
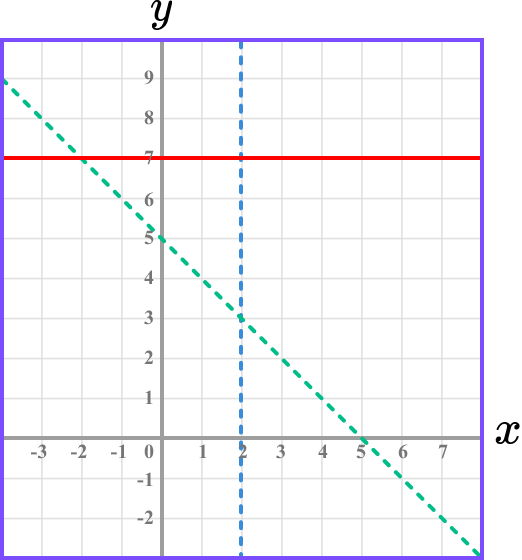
Example 5: indicating a region that satisfies a system of inequalities
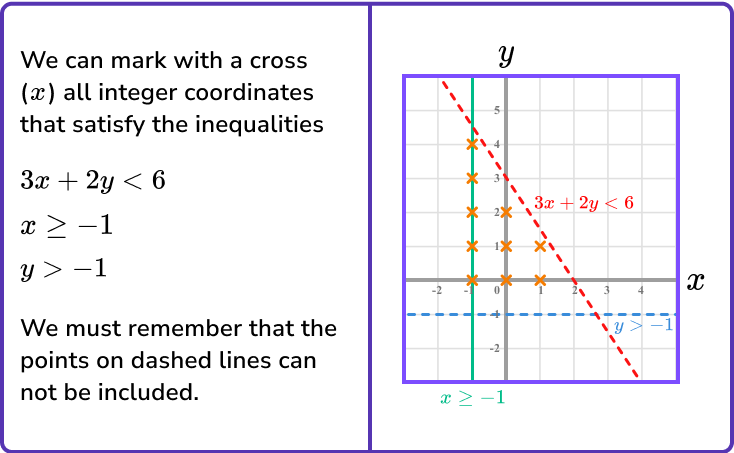
Mark with a cross (x) the integer coordinates that satisfy
x+y>5, \ x<2 and y\le 7 .
x+y=5 goes through the points (0,5), \ (1,4), \ (2,3) etc..
x=2 is a vertical line through (2,0).
y=7 is a horizontal line through (0,7).
Plot the points and lines using dashed lines for x+y>5 and x<2 and a solid line for y \leq 7.
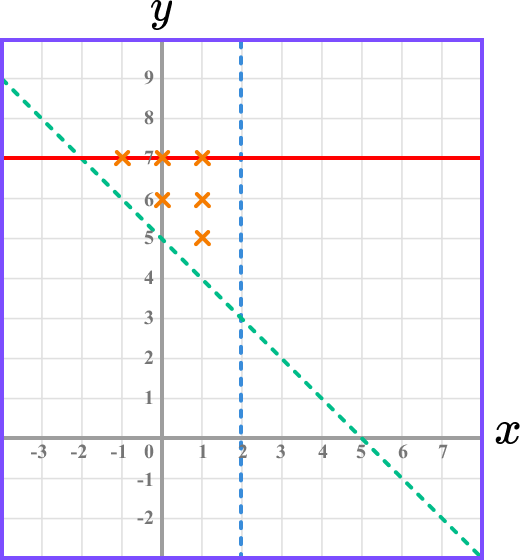
x+y>5 means the integer coordinates must be above x+y=5.
x<2 means the integer coordinates must be the the left of x=2.
y \leq 7 means the integer coordinates must be on or below y=7.
Common misconceptions
- Indicating the wrong side of the line with equations involving \bf{y}
It is common to indicate the wrong side of the line that satisfies an inequality involving the variable y. The sight of a positive y> means it will be above the line, a positive y< means it will be below the line.
- Using the wrong type of line
When drawing lines it is important to use a dashed line for inequalities using the symbol < or >. There may be questions using these symbols with solid lines already drawn – this sort of question will usually want you to indicate integer coordinates that satisfy the inequality.
- Indicating that points on a dashed line will satisfy the inequality
When we’re dealing with inequalities that are strictly less than or greater than (indicated by the symbol < or > ), the points on the line are not included.
Practice inequalities on a graph questions
1. The diagram shows a shaded region satisfying an inequality.
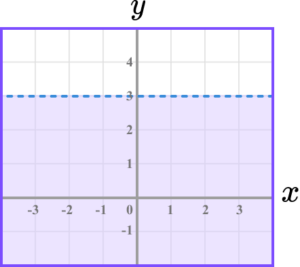
Select the correct inequality.


It is a horizontal dashed line and the region is below the line.
2. The diagram shows a shaded region satisfying an inequality.
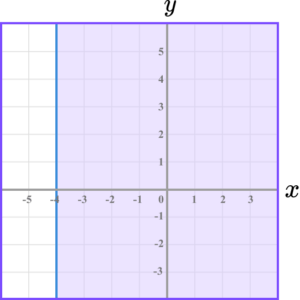
Select the correct inequality.
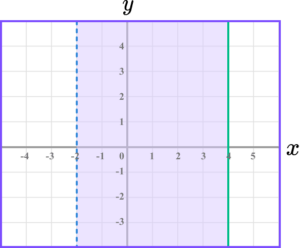
It is a vertical solid line and the region is to the right of the line.
3. The diagram shows a shaded region satisfying an inequality.
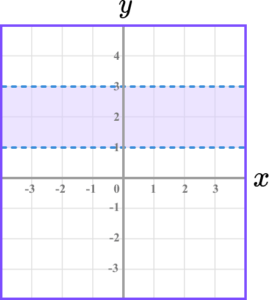
Select the correct inequality.
They are both horizontal dashed lines and the region between them is shaded.
4. The diagram shows a shaded region satisfying an inequality.
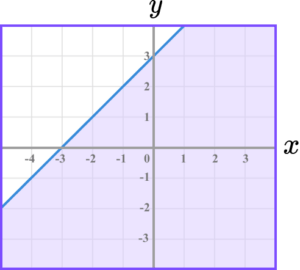
Select the correct inequality.
The line is solid and the region is below the line meaning y needs to be small.
5. Which diagram indicates the region satisfied by the inequalities
y\geq x, \ x\leq 4 and y\geq 1 .
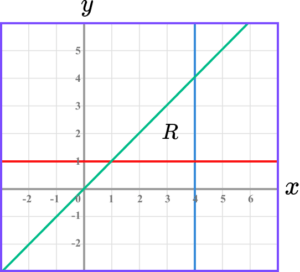
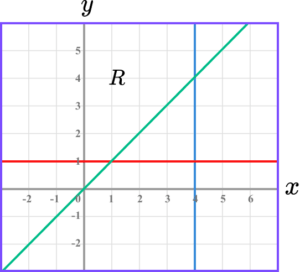
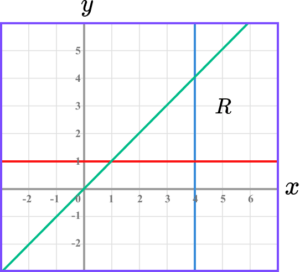
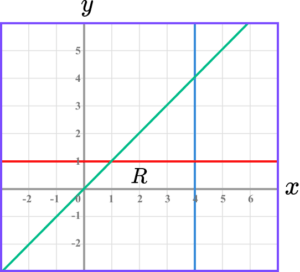
The region must be above the line y=x, the the left of the line x=4 and above the line y=1.
6. Which diagram indicates the region satisfied by the inequalities
y\geq 2, \ 2x+y\leq 4 and x\geq-1 .

The region must be below the line 2x+y=4, above the line y=2 and to the right of the line x=-1.
Inequalities on a graph GCSE questions
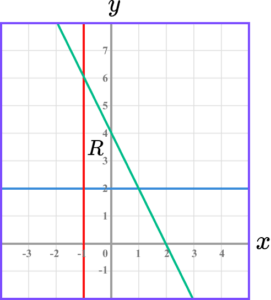
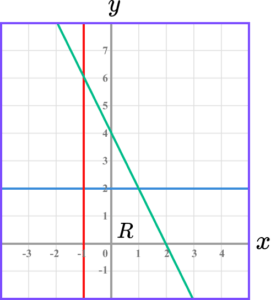
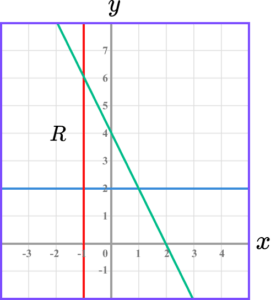
1. Write down the inequalities that the region R indicates.
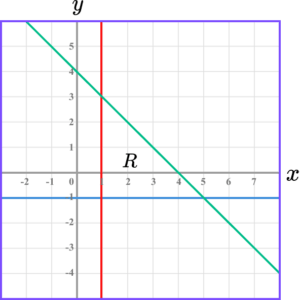
(3 marks)
(1)
x \geq -1(1)
x+y \leq 4(1)
2. On the grid, shade the region that satisfies -2< x \leq 4.
(3 marks)
Dashed line drawn for x=-2.
(1)
Solid line drawn for x=4.
(1)
Correct region shaded.
(1)
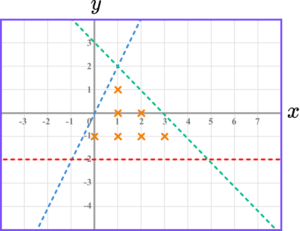
3. Mark with a cross (x) the integer coordinates that satisfy
y<2x, \ x+y<3 and y>-2.
(5 marks)
Correct line drawn for y=2x (dashed or solid).
(1)
Correct line drawn for y=-2 (dashed or solid).
(1)
Correct line drawn for x+y=3 (dashed or solid).
(1)
Any 2 correct points indicated.
(1)
All correct points indicated.
(1)
Learning checklist
You have now learned how to:
The next lessons are
Still stuck?
Prepare your KS4 students for maths GCSEs success with Third Space Learning. Weekly online one to one GCSE maths revision lessons delivered by expert maths tutors.

Find out more about our GCSE maths tuition programme.