KS2 Sats Results 2019: What You Need To Know
This article was originally published on 9th May 2019.
The national SATs results 2019 are in, and here’s everything you need to know about what they mean for your school, what to do next, and how to explain and discuss them with teachers, parents and children. We’ve worked with our maths consultant and Third Space author, Tim Handley on this comprehensive analysis of the 2019 maths SATs.
We will be focusing on the impact that the Maths Arithmetic and Reasoning papers have on the KS2 SATS results in 2019 what it means for your future SATs preparation.
SATS 2026: STAY UP TO DATE
Join our email list to stay up to date with the latest news and free resources for SATs 2026. As usual our expert teachers will be on hand to provide one to one tuition support, revision resources, expert paper analysis, SATs teacher survey results and the SATs results 2026.
So, the 2019 KS2 SATs results are now out, and according to the official data attainment in maths and writing has increased, whereas in reading attainment has decreased.
The DfE are publicly stating that the increase in 1% of children meeting the expected standard in Reading, Writing and Maths (the combined measure), shows that standards are rising, and the majority of primary school pupils are ‘secondary school ready’.
KS2 Maths SATs Practice Papers (Set of 3)
Download a set of practice maths SATs papers for your pupils to use, written by the same people who write the real thing!
Download Free Now!The KS2 SATS Results 2019: The Headlines
In case you need it, here is a reminder of the headline national statistics for the 2019 National Curriculum Assessments.
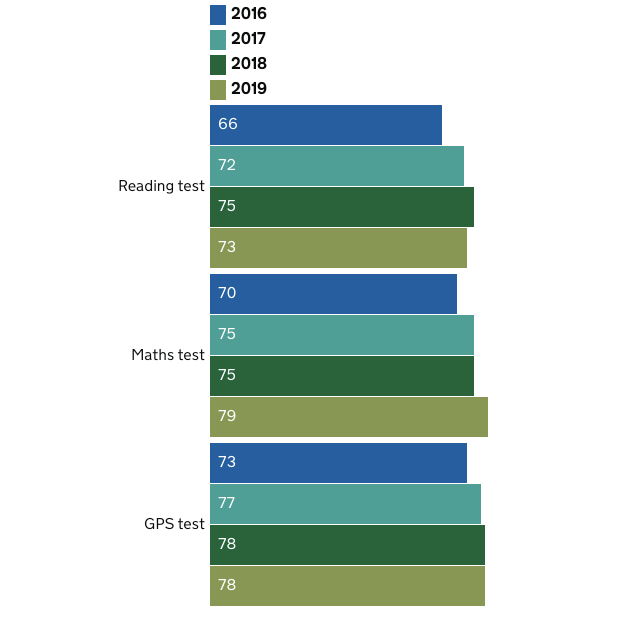
- 65% of pupils met the expected standard in reading, writing and maths combined – an increase of 1 percentage point from 2018, and an increase of 4 percentage points since 2017.
- 73% of pupils achieved the expected standard in reading – a decrease of 2 percentage points since 2018, but still 2% higher than in 2017.
- 78% of pupils achieved the expected standard in writing, which is teacher assessed – which is the same proportion as in 2017.
- 79% of pupils achieved the expected standard in mathematics – an increase of 3 percentage points from 2018 and 4 percentage points from 2017.
- 78% of pupils achieved the expected standard in Grammar, Punctuation and Spelling (GPS), which was the same as 2018. Remember however that GPS results do not count towards the school accountability measures.
Scaled score conversion tables: KS2 SATs results 2019
The conversion tables convert a pupils raw score in each of their SATs papers to the infamous scaled score. This year’s tables were released alongside the 2019 KS2 SATS results.
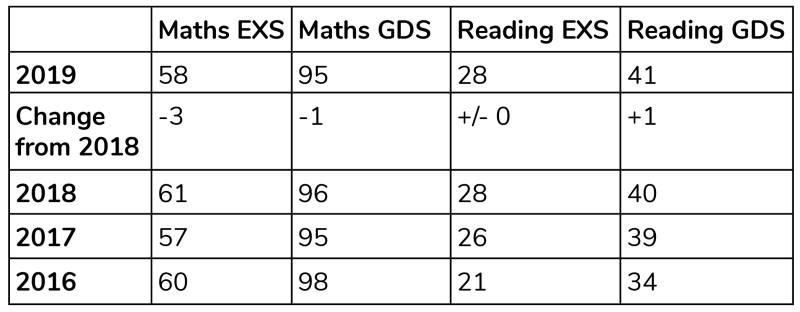
From these tables, we can see that the raw score needed to gain a scaled score of 100 (i.e the expected standard) for Maths in 2019 is 58.
This is a decrease of 3 raw score marks compared to 2018, where the raw score needed was 61, and 1 mark from 2017.
This means that children only need a percentage score of 51.2% across all three papers to be judged at working at the expected standard in Maths at KS2.
This compares to children needing to gain 56% in reading and 54% in GPS in order to meet the expected standard.
Interestingly, the scaled score needed for greater depth has only decreased by 1 mark compared to 2018. We’ll unpick more what this may indicate about the 2019 maths later on in this post.
Read More: Standardised Scores: What Do They Mean?
Unlimited primary maths tutoring with Skye, the voice-based AI maths tutor.
Built on the same principles, pedagogy and curriculum as our traditional tutoring, but with more flexibility, reach and lower cost.
Join the schools already helping hundreds of primary pupils nationwide with Skye’s one to one maths tutoring.
Watch Skye in actionKS2 SATS results trends: 2019
We are now in the fourth year of the ‘new style’ KS2 national assessments, so it’s certainly possible to begin to look at what trends are emerging.
1. The raw score required to get 100 is the second lowest it has been since the start of the new style assessments.
Most Year 6 teachers will be relieved to hear that this certainly implies that across the country children generally found the KS2 maths SATs this year significantly harder than last years (which, were seen by many as generally quite fair).
2. The percentage of pupils gaining the expected standard in Maths has increased.
This is interesting given the change in scaled scores, and could be seen to imply that the DfE, as part of its standardisation process (where the raw scores to scaled score conversion tables are set) has tried to ensure a higher percentage of pupils achieving the expected standard in maths.
This could be because the increase in the proportion of children gaining the expected standard was less marked in 2017 and 2018 than it was in other subjects.
3. The raw score required to reach greater depth in maths paints an interesting picture.
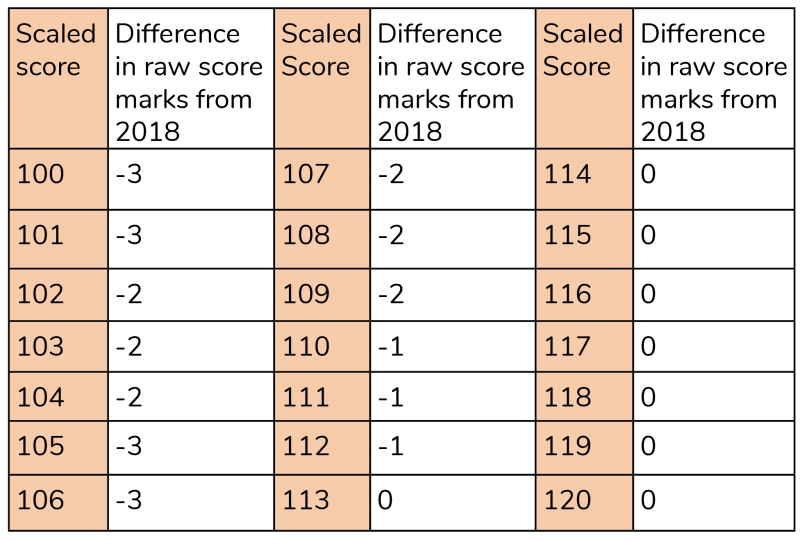
The raw score required to reach a scaled score of 110 only decreased by 1.
When we look at the raw score required to gain the scaled scores between 101 and 110, we see that, with only a couple of exceptions, the score required to gain each scaled score is between 2 and 3 raw score marks lower than 2018.
This indicates that this paper strongly favoured children who were working at greater depth within the expected standard, and (based on the 2018 progress measures at least) who gained a level 3 in all subjects at KS1.
4. The number of children gaining the combined expected standard increased by 1%.
However, this still remains 8% lower than the proportion of children gaining the expected standard in the individual subjects.
This indicates that schools may still benefit from ensuring they really focus on children who are on track to gain the expected standard in two subjects but not the third (i.e. a child who is on track to gain expected standard in reading and writing but not maths).
5. 54.1% of content was from outside the Y6 programme of study.
Therefore, once again, the scaled scores confirm that it is technically possible to gain the expected standard without knowledge of the Year 6 curriculum.
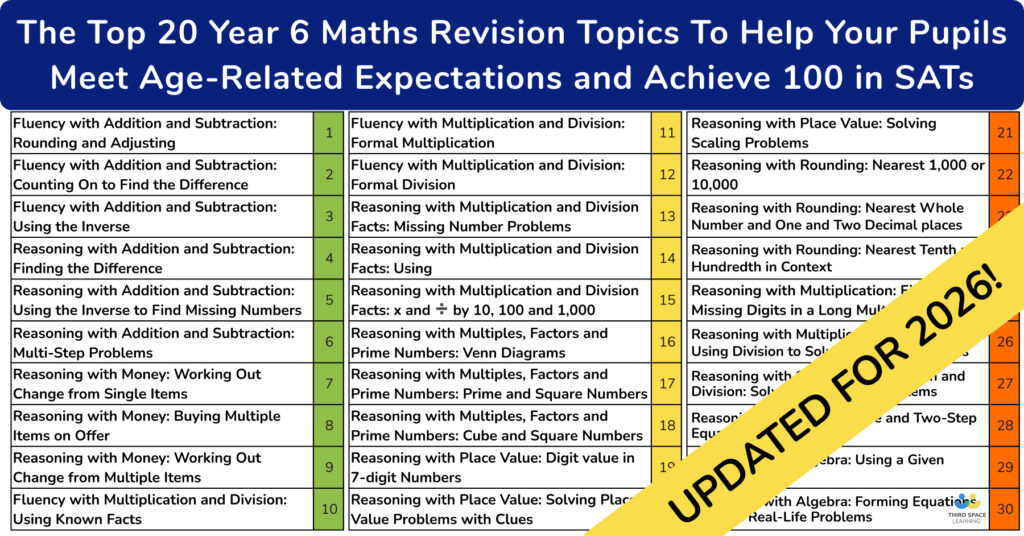
This is of particular importance to consider when planning revision schedules for future SATs.
Of course, the national data released is very broad at this stage. More detailed breakdowns will be released on the 5th September, which is also when schools will get their first view of their official progress measures from their 2019 KS2 SATs results (more on this below).
The SATS Arithmetic Test Remains Key To Great KS2 SATs Results
The arithmetic test is now in its fourth year, and many schools are starting to realise how key this is to the overall success in the KS2 maths SATs. This is especially the case this year, with the raw score needed to gain 100 being reduced.
This year, only 58 marks were required to gain the expected standard.
If pupils gained 30 out of the 40 marks on the arithmetic paper (which is easily achievable by most if they have practised developed true fluency), this means they only need to gain 28 marks combined on the reasoning papers, meaning that they, astonishingly, only need to get 40% of the reasoning papers correct.
If you work hard to keep children’s knowledge, skills and fluency in arithmetic current throughout Key Stage 2 it will become second nature, almost automatic by Year 6 and this gives them a huge advantage.
Read more: What Are SATs: A Comprehensive Guide
KS2 SATs results 2019: next steps for your school
Before comparing your 2019 SATs results to national data, go through these steps to make sure the data you are comparing is accurate:
1. Small schools – check if the school level results will be published
Schools with less than 11 pupils sitting the KS2 SATS won’t have their data published.
2. Add on any special consideration uplift that you were granted
Scores reported on NCA tools do not take special considerations into account.
Add 3 points on to the scaled scores of children whose special consideration application was granted.
3. Do you need to submit any marking reviews
Schools can apply for pupils’ scripts for a particular subject to be reviewed and marked again, if they think there is an error in the marking.
It’s worthwhile looking in detail at the scripts of any pupil who has a scaled score of 99.
Make sure that all page have been taken into account, including workings that are outside the answer area, as this is the most common reason for marking mistakes.
SATs papers marking errors can go either way!
Also note any marking errors that go in your favour. These need to be a part of your decision-making process for whether to submit a pupil’s paper for review.
If you feel you have found mistakes that would make a difference to a pupil’s scaled score you should know that if you submit it, all 3 papers will be remarked, and this can sometimes lead to the marks going down! Being aware of the points you may lose.
There is also a cost associated with the review if there has been no change to the marking decisions.
Results for any remarks will be published at the start of September.
4. Know how you compare to the national data
Look at how your school’s percentages for the combined reading/writing/maths expected standard, as well as the expected standard for each subject, compares to the national figures.
Whilst it is important to see how you compare nationally, remember the fewer KS2 SATs students in your school, the less statistically relevant the national data is.
SATs results by school are available from the government’s school comparison service.
KS2 SATS results 2019: predicting progress scores
School progress scores are calculated based on an average of each pupil’s progress scores, but the progress score measure is only statistically reliable as a school average, so individual scores should not be reported to parents.
Calculate a child’s average point score (and therefore their PAG), by:
- Adding the child’s point score for reading and writing together from the English and Reading tests.
- Divide this by 2.
- Add the child’s point score for maths to this total.
- Divide this new total by 2.
Predicting progress scores: next steps
After the calculation above, each PAG is then given an average scaled score.
This is the actual average of the scaled scores of all children nationally who fit into the PAG. Therefore it is likely to be slightly different for 2019 than 2018, however given the change in scaled scores, we can expect that these will be roughly the same, and that the 2018 figures are likely to give you a ‘worst case’ scenario for progress.
The individual progress scores for all children who have KS1 assessment data available are all totalled per subject, and divided by the number of eligible pupils to give the school average.
You can only make a rough prediction at this stage, as the tables which give the average scaled scores for each PAG will not be published until at least October. You can find the latest tables and data here.
There has been some variance between the 2016, 2017 and 2018 averages for each PAG, but when taken as an average across the school, it is likely that predictions made based on 2017 average scaled scores can be made with a fair degree of accuracy.
Supporting pupils with negative progress scores in KS2 SATS
The DfE has put in place measures to reduce the impact of pupils with disproportionately negative progress scores (i.e. those who scored highly at KS1 but significantly below the national standard in 2019 KS2 SATs).
However, these only apply in very rare circumstances.
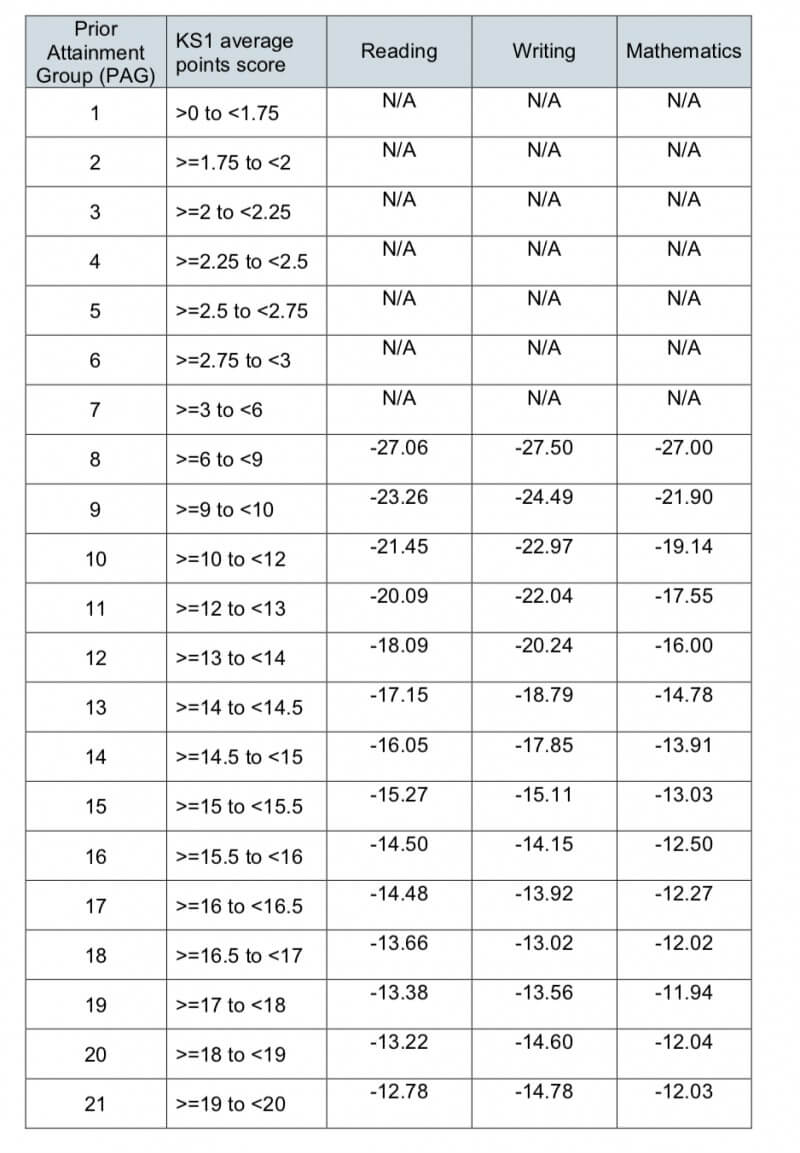
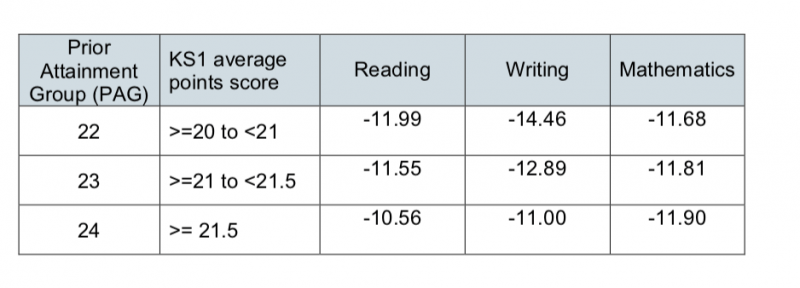
The table below, taken from the 2018 technical guidance, shows the lowest progress measure for each prior attainment group.
If a child’s progress is BELOW the figures in the table, their progress score is REPLACED by the figure in the table below.
Floor standards and coasting schools are no more
In May 2019, the DfE announced that there are no floor standards or coasting school definitions.
Patterns in your KS2 SATs results data
It is then important to look at your school level data, including any progress predictions you may have made, and see what ‘messages’ they are sending.
Three key questions:
1. Was there just one subject where your results do not meet or exceed national averages?
If so, is this a pattern from previous years, or something new?
2. Is there one subject which is impacting on children gaining expected standard across all 3 subjects?
Do you have a disproportionate number of children who gained expected standard in Reading and Writing but not in Maths? Consider how you will track in the future to make sure this does not become a pattern.
3. Is there a gap between attainment of any key groups? (i.e. Pupil Premium/Non Pupil Premium, Girls/Boys).
If so, how can these be addressed?
Consider what you need to put in place to help improve your results in the future.
Remember, the KS2 SATs are only a measure, but they are a measure of the whole of KS2, not just Year 6 – so any issues you have identified, and/or changes you make, need to take place across all of the school to have a real impact at the end of KS2 – this is the sort of thing that Ofsted will look for during inspections.
Support staff regardless of you 2019 KS2 SATs results
If the 2019 SATs results are good, then there is cause to celebrate.
If the results are not as expected or desired then, it is a leader’s responsibility to help staff come to terms with disappointment.
KS2 SATs are a whole-school effort and the responsibility for results should not fall solely on the shoulders of the Year 6 teachers. To make any follow up productive, teachers will need to feel trusted and supported by their leaders – avoid any ‘knee-jerk’ reactions.
Report KS2 SATs results to children and parents
Children will want to know their scores, and schools are legally required to provide a written report which includes results of national curriculum tests (including the scaled score and measure of if they have met the expected standard or not) alongside teacher assessment judgements.
It is also a legal requirement that you provide enough time for parents to have the opportunity to discuss the results if they wish.
What more can you do for your Year 6 pupils?
Beyond the statutory letter, it is up to individual schools what else they do.
In some schools, Year 6 teachers make time to sit with each child and explain their results along with teacher assessment data.
This gives staff an opportunity to show their children that the test is not the be-all-and-end-all.
It also lets them show the child that their full year of progress, not just the scores from the SATs matters. This should be done on the same day (not before) the results go out to parents.
Look on the bright side of your 2019 KS2 SATs results
When results come out, especially if they are less than ideal, It’s easy to forget to look for the positives.
But the positives will be there!
Look at successes for particular individuals or pupil groups, or certain tests that have gone well for your cohort – find a reasons to celebrate.
Remember, negative trends can begin to form part of your plan for next year. It’s important not to just focus and dwell on what went wrong, but to think forward to how to do it right next time.
It’s also worth remembering that your children are more than a score- as this video shows:
Why primary schools use Third Space Learning to improve their SATs results in maths
- We have a proven track record of providing Year 6 pupils with a targeted revision programme that combines a focus on the individual’s gaps with the key topics they need to know
- Our SATs revision lessons have been designed around a maths mastery approach building fluency, reasoning and problem solving.
- Schools often use us to support their target pupils who would otherwise not be securely on track to achieve expected standard; with the support Skye, the AI maths tutor, most of them are able to turn around their results.
“We did amazingly well in our maths SATs results and achieved 81%. All of our Third Space pupils achieved expected progress, one Third Space pupil achieved one of the highest results in year 6! (Before they started, 5 pupils were middle, 1 was low and 2 were high).”
Sam Linton, Temple Grove Academy.
If you’re looking for a way to make a drastic improvement in maths attainment next year, particularly for SATs, book a quick demo of our AI maths tutoring for a quote or call us on 0203 771 0095.
Read More:
DO YOU HAVE STUDENTS WHO NEED MORE SUPPORT IN MATHS?
Skye – our AI maths tutor built by teachers – gives students personalised one-to-one lessons that address learning gaps and build confidence.
Since 2013 we’ve taught over 2 million hours of maths lessons to more than 170,000 students to help them become fluent, able mathematicians.
Explore our AI maths tutoring or find out about year 6 SATs for your school.


