High Impact Tutoring Built By Math Experts
Personalized standards-aligned one-on-one math tutoring for schools and districts
In order to access this I need to be confident with:
Fractions Fractions operations Adding and subtracting fractionsLine plot
Here you will learn about line plots, including how to create a line plot with whole number units and fractional units, and how to solve addition and subtraction problems involving information presented in line plots.
Students will first learn about line plots as part of measurement and data in 2 nd grade.
What is a line plot?
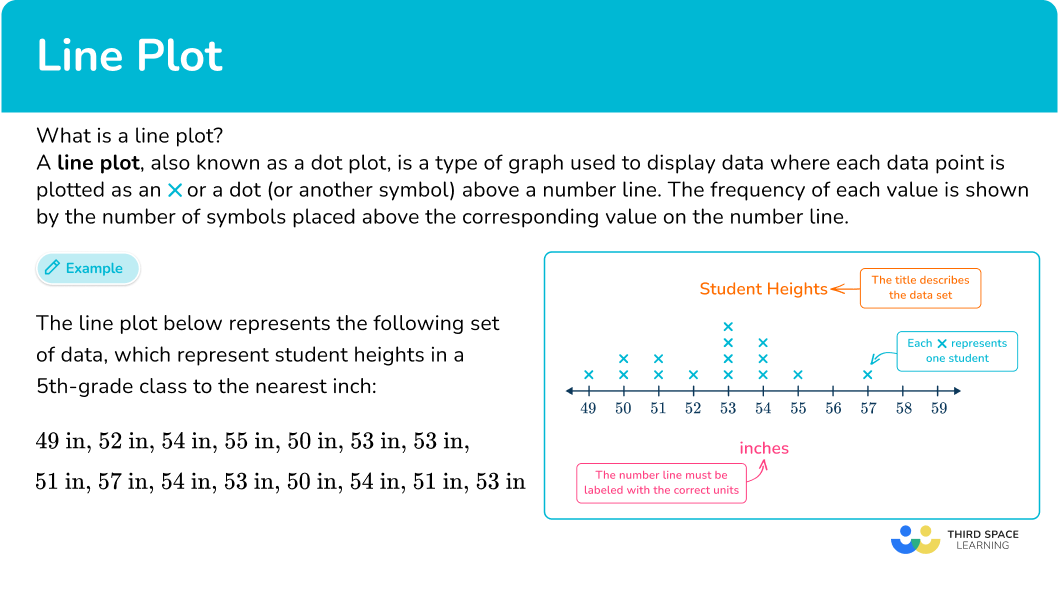
A line plot, also known as a dot plot, is a type of graph used to display data where each data point is plotted as an X or a dot (or another symbol) above a number line. The frequency of each value is shown by the number of symbols placed above the corresponding value on the number line.
For example,
The line plot below represents the following set of data, which represent student heights in a 5 th-grade class to the nearest inch:
49 \, in, \, 52 \, in, \, 54 \, in, \, 55 \, in, \, 50 \, in,
53 \, in, \, 53 \, in, \, 51 \, in, \,57 \, in, \, 54 \, in,
53 \, in, \, 50 \, in, \, 54 \, in, \, 51 \, in, \, 53 \, in

What is a line plot?
Common Core State Standards
How does this relate to 2 nd grade math through 5 th grade math?
- Grade 2 – Measurement and Data (2.MD.D.9)
Generate measurement data by measuring lengths of several objects to the nearest whole unit, or by making repeated measurements of the same object. Show the measurements by making a line plot, where the horizontal scale is marked off in whole-number units.
- Grade 3 – Measurement and Data (3.MD.B.4)
Generate measurement data by measuring lengths using rulers marked with halves and fourths of an inch. Show the data by making a line plot, where the horizontal scale is marked off in appropriate units— whole numbers, halves, or quarters.
- Grade 4 – Measurement and Data (4.MD.B.4)
Make a line plot to display a data set of measurements in fractions of a unit (\cfrac{1}{2}, \cfrac{1}{4}, \cfrac{1}{8}). Solve problems involving addition and subtraction of fractions by using information presented in line plots.
For example, from a line plot find and interpret the difference in length between the longest and shortest specimens in an insect collection.
- Grade 5 – Measurement and Data (5.MD.B.2)
Make a line plot to display a data set of measurements in fractions of a unit (\cfrac{1}{2}, \cfrac{1}{4}, \cfrac{1}{8}). Use operations on fractions for this grade to solve problems involving information presented in line plots.
For example, given different measurements of liquid in identical beakers, find the amount of liquid each beaker would contain if the total amount in all the beakers were redistributed equally.
![[FREE] Represent and Interpret Data Worksheet (Grade 1 to 3)](https://thirdspacelearning.com/wp-content/uploads/2023/11/Represent-and-Interpret-Data-listing-image.png)
[FREE] Represent and Interpret Data Worksheet (Grade 1 to 3)
Use this quiz to check your 1st, 2nd and 3rd grade students’ understanding of representing and interpreting data. 15+ questions with answers covering a range of 1st, 2nd and 3rd grade represent and interpret data topics to identify areas of strength and support!
DOWNLOAD FREE [FREE] Represent and Interpret Data Worksheet (Grade 1 to 3)
Use this quiz to check your 1st, 2nd and 3rd grade students’ understanding of representing and interpreting data. 15+ questions with answers covering a range of 1st, 2nd and 3rd grade represent and interpret data topics to identify areas of strength and support!
DOWNLOAD FREEHow to create a line plot
To create a line plot:
- Draw the horizontal axis ( \textbf{x} -axis, or the number line) and mark it off in appropriate units.
- Plot each data point as an X, dot, or other symbol above its value on the number line.
- Label the number line with the appropriate units and add a title.
Line plot examples
Example 1: whole number data values
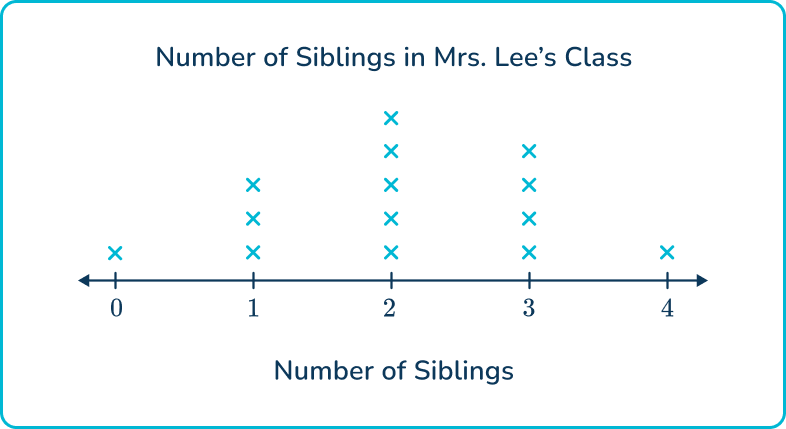
Mrs. Lee’s class conducted a survey to find out how many siblings each student had. Here are the results:
2, \; 3, \; 1, \; 2, \; 4, \; 2, \; 1, \; 3, \; 2, \; 0, \; 3, \; 2, \; 1, \; 3.
Create a line plot to show the number of siblings each student has.
- Draw the horizontal axis ( \textbf{x} -axis, or the number line) and mark it off in appropriate units.
To draw the number line, draw a straight line horizontally with arrows on the ends. Then mark it off in equal intervals. All of the data values in the set are whole numbers between 0 and 4, so the number line can be marked off as so:

2Plot each data point as an X, dot, or other symbol above its value on the number line.

3Label the number line with the appropriate units and add a title.
This data set does not represent measurement data, so the number line label is a category (number of siblings) rather than a unit of measurement such as inches, feet, etc.
Example 2: whole number data values
During recess, students in Mr. Garcia’s class measured the lengths of different sticks they found on the playground in inches. Here are their measurements:
2, \; 4, \; 6, \; 5, \; 7, \; 4, \; 6, \; 5, \; 8, \; 7, \; 6, \; 5, \; 6, \; 7, \; 6, \; 4.
Create a line plot to show the lengths of the sticks in inches.
Since the data points are all whole numbers, the lowest being 2 and the highest being 8, the number line can be marked off from 2 to 8.
It is not required to have the first and last numbers on the number line be the lowest and highest data points, however. For example, you could also draw a number line from 0 to 10.

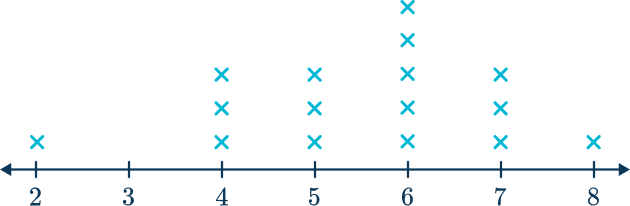
Since the data set represents measurement data, the number line is labeled in the correct measurement unit, which is inches.

Example 3: fractional data values (halves and quarters)
Maria measured the lengths of ribbons in her craft supplies to the nearest quarter of a foot. Here are their measurements:
\begin{array} {l} 1, \; 2, \; 1 \cfrac{1}{2}, \; 3, \; 2 \cfrac{1}{2}, \; 1 \cfrac{1}{2}, \; 2, \; 3, \; 1 \cfrac{1}{2}, \; 2 \cfrac{1}{2}, \\\\ 2, \; 1, \; 2, \; 1 \cfrac{1}{2}, \; 3, \; 2 \cfrac{1}{4}, \; 2 \cfrac{3}{4}, \; 1 \cfrac{3}{4}, \; 1 \cfrac{3}{4}, \; 2 \cfrac{1}{4}. \end{array}
Create a line plot to show the lengths of Maria’s ribbons.
Since the data points included fractional measurements (halves and quarters), the number line is marked off in fourths from 1 to 3.


Example 4: fractional data values (halves, quarters, eighths)
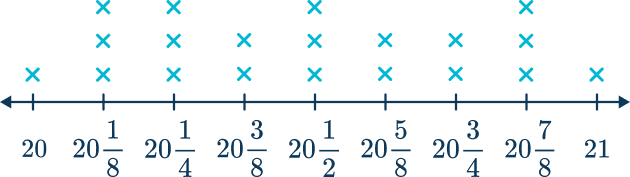
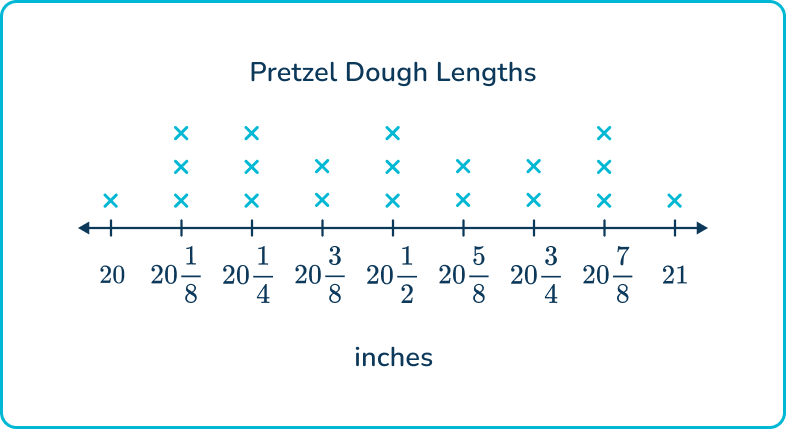
The owner of a pretzel stand is measuring out the dough to make a fresh batch of pretzels. The lengths are shown to the nearest eighth of an inch:
\begin{array} {l} 20 \cfrac{1}{2}, \; 20 \cfrac{5}{8}, \; 20 \cfrac{7}{8}, \; 20 \cfrac{3}{4}, \; 20 \cfrac{1}{8}, \; 20 \cfrac{1}{8}, \; 20, \\\\ 21 \cfrac{3}{8}, \; 20 \cfrac{1}{2}, \; 20 \cfrac{5}{8}, 20 \cfrac{3}{8}, \; 20 \cfrac{1}{4}, \; 20 \cfrac{7}{8}, \; 20\cfrac{1}{4}, \\\\ 20 \cfrac{1}{4}, \; 21, \; 20 \cfrac{7}{8}, \; 20 \cfrac{1}{8}, \; 20 \cfrac{1}{2}, \; 20 \cfrac{3}{4}\end{array}
Create a line plot to represent the pretzel dough.
Since the data points included fractional measurements (halves and quarters), the number line is marked off in eighths from 20 to 21.

How to answer a question about a line plot.
In order to answer a question about a line plot:
- Examine the line plot carefully to understand the information it represents.
- Use the information from the line plot to answer the specific question being asked.
Example 5: read a line plot
According to the line plot, how many students in Mrs. Lee’s class have 2 or more siblings?

Looking at the line plot, you can see that each X represents one student in Mrs. Lee’s class and the numbers on the number line represent the number of siblings they have.
The question asks you to determine how many students in Mrs. Lee’s class have 2 or more siblings. To find this answer, you would count the number of Xs above the 2, above the 3, and above the 4.
These Xs represent all of the students who have 2 siblings or more than 2 siblings.
Therefore, 10 students in Mrs. Lee’s class have 2 or more siblings.
Example 6: read a line plot – measurement data
Alex drew a line plot to represent the lengths of the pencils on his desk. What is the difference between the longest pencil and the shortest pencil?
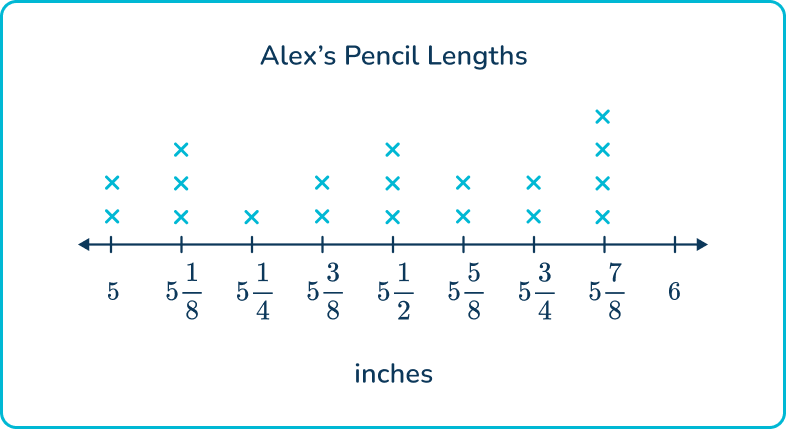
After examining the line plot, you can see that it represents the lengths of Alex’s pencils to the nearest eighth of an inch.
The highest number with Xs above it is 5 \cfrac{7}{8} and the lowest number with Xs above it is 5, which means those measurements represent the longest and shortest pencils.
The question asks to find the difference between the longest and shortest pencils, so you can use subtraction to find the answer.
5 \cfrac{7}{8}-5=\cfrac{7}{8}
After solving, write a sentence to provide the correct context for the answer.
The difference between the longest pencil and the shortest pencil is \cfrac{7}{8} inches.
Teaching tips for line plots
- Begin by introducing line plots using concrete examples that students can relate to, such as the number of pets students have or the number of books they’ve read in a week. Then progress to fractional data values such as the lengths of a set of ribbons.
- Provide plenty of opportunities for students to practice reading and interpreting line plots. Ask questions about the data, such as finding the mean, mode, median, or range.
- In place of worksheets, allow students to use interactive whiteboards or other online graphing tools to create line plots. This helps students develop a strong understanding of data visualization and makes the learning experience more engaging.
- As the curriculum progresses, practice problems with line plots can include decimals instead of fractions.
Easy mistakes to make
- Thinking the line plot needs a \textbf{y} -axis
Many graphs use an x -axis and y -axis but a line plot will only include an x -axis or number line.
- Incorrect scaling
Students might incorrectly scale the number line. For example, if the numeric data set includes fourths, the number line should be marked off in fourths, even if some of the fourths do not represent a data point.
- Missing labels
Forgetting to label the axes or title the graph can make it difficult for others to read and interpret the graph.
- Confusing line plots for other types of line graphs
Students might confuse line plots with other types of line graphs because they all involve lines, but line plots specifically show the frequency of data points along a number line, while other line graphs display trends or relationships between variables.
Related represent and interpret data lessons
Practice line plot questions
1. Which line plot represents the following data?
A group of 3 rd graders conducted a survey to find out how many hours each student spent reading books during the past week.
Data: 2 hours, 3 hours, 1 hour, 2 hours, 4 hours, 2 hours, 3 hours, 1 hour, 2 hours, 3 hours, 2 hours, 4 hours
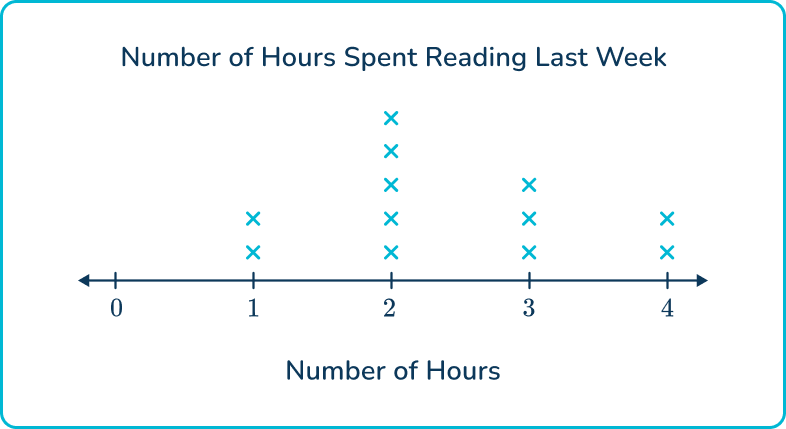


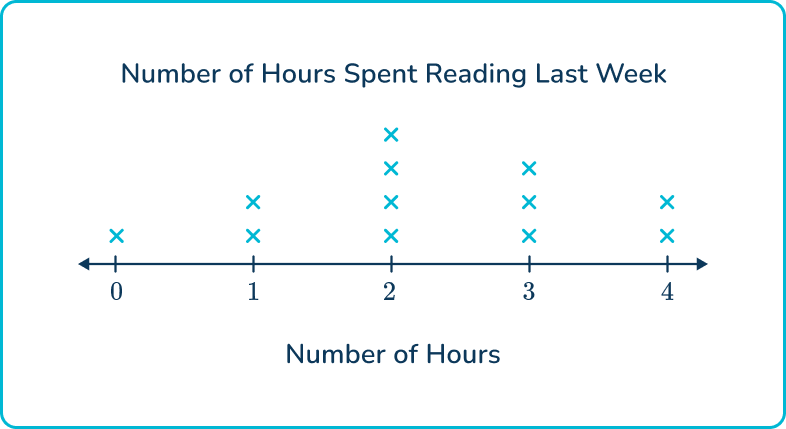

The first graph represents the data correctly. The number of Xs and frequencies on the 2 nd graph are correct, but the title and label are incorrect.
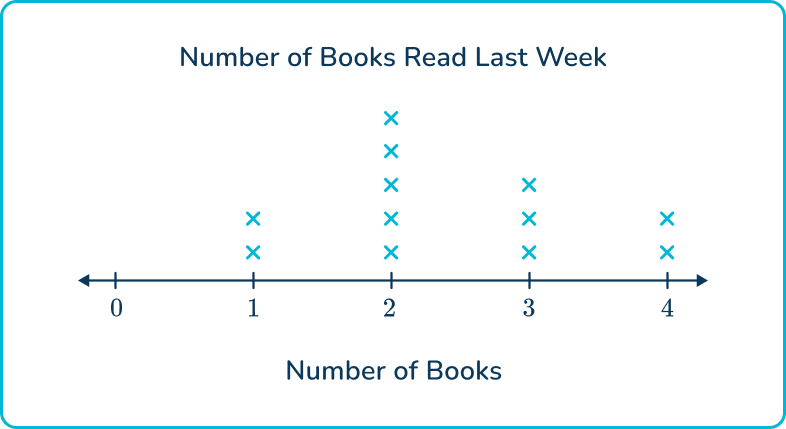
2. Which line plot represents the following data?
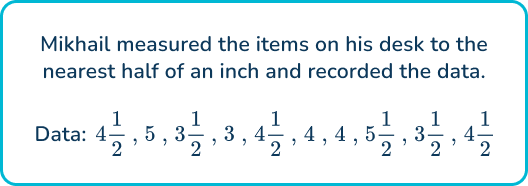
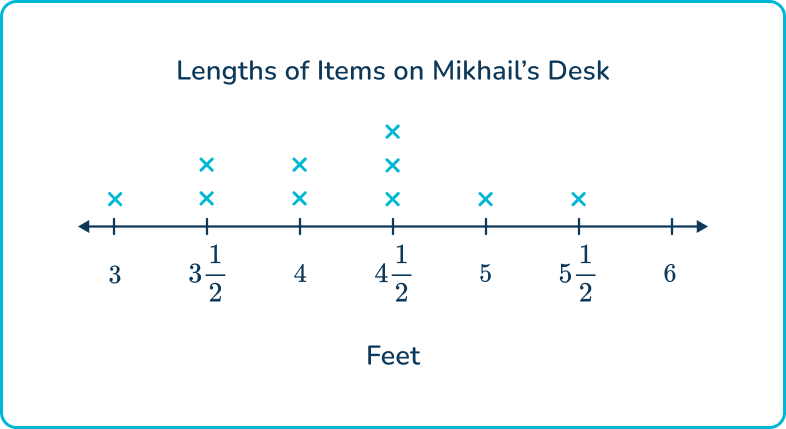
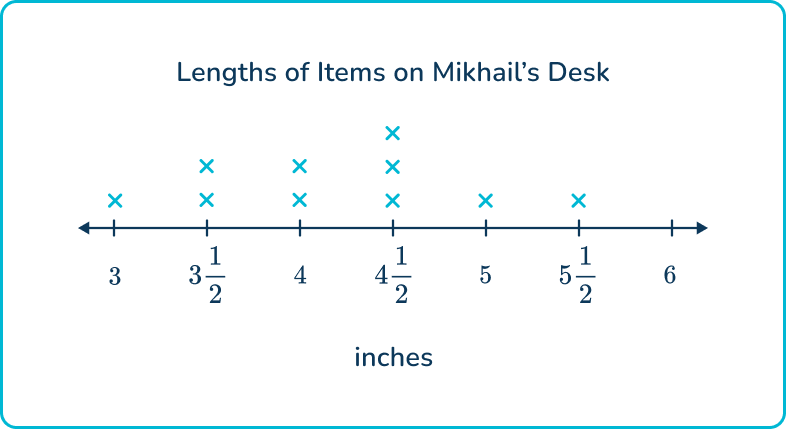
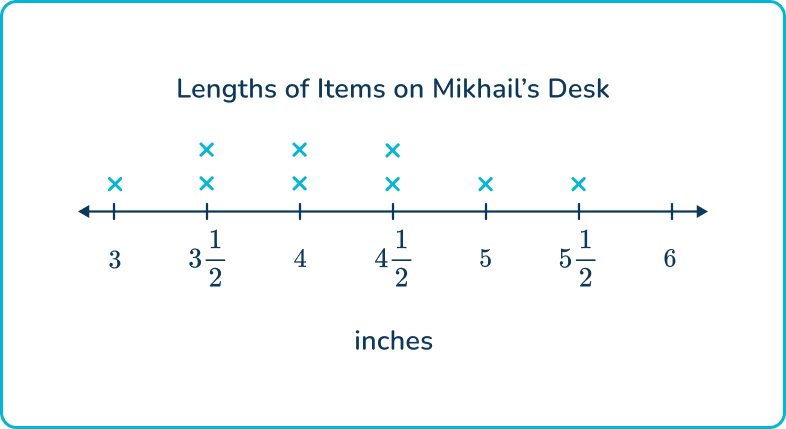
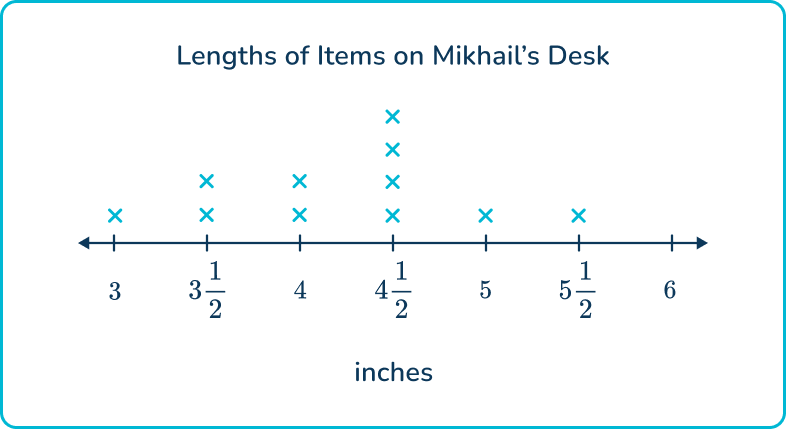
The second option has the correct title, label, and the data points are plotted correctly.
The first line plot also has the correct data points plotted correctly, but the number line units are shown as feet instead of inches.
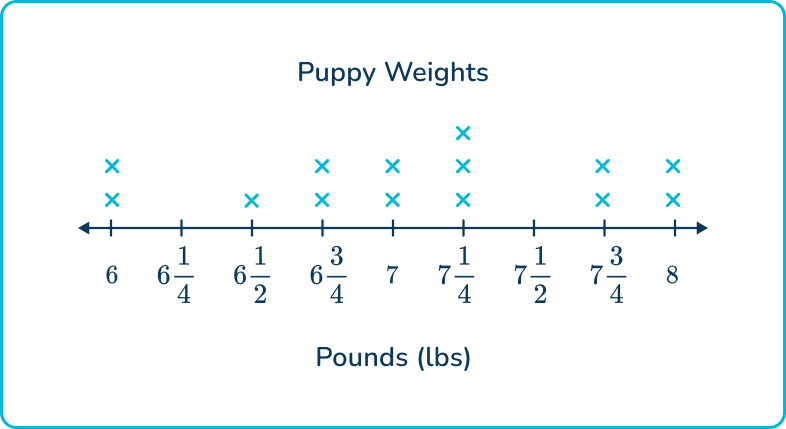
3. The number line below represents the weights of a group of puppies. How many puppies were weighed?

Each X represents one puppy, so to find the total number of puppies that were weighed, you need to count the number of Xs on the line plot, which is 14.
4. The line plot below represents the weights of a litter of puppies. What is the difference between the most common puppy weight and the least common puppy weight?
2 lbs
7 \cfrac{1}{4} lbs
\cfrac{3}{4} lb
6 \cfrac{1}{2} lbs
The most common puppy weight is the one with the most Xs above it, which is 7 \cfrac{1}{4} lbs.
The least common puppy weight is the one with the lowest number of Xs above it, which is 6 \cfrac{1}{2} lbs.
To find the difference, subtract the two numbers.
7 \cfrac{1}{4}-6 \cfrac{1}{2}= \; ?
To find the difference, first, you need to find a common denominator.
7 \cfrac{1}{4}-6 \cfrac{2}{4}= \; ?
Then, you’ll need to take \cfrac{4}{4} from 7 so that you have enough fourths to subtract the fractions.
6 \cfrac{5}{4}-6 \cfrac{2}{4}=\cfrac{3}{4}
The difference between the most common puppy weight and least common puppy weight is \cfrac{3}{4} lbs.
5. A group of 5 th graders each planted a seed. They have been tracking the heights of their plants over the last 2 weeks. The line plot below represents the heights of the plants to the nearest eighth of an inch.
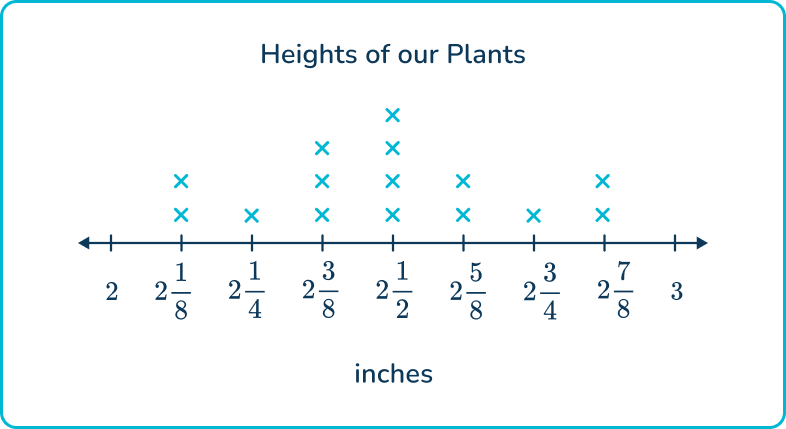
What is the combined height of the 3 tallest plants?
8 \cfrac{3}{4} inches
8 \cfrac{1}{2} inches
5 \cfrac{3}{4} inches
8 \cfrac{5}{8} inches
To find the combined height of the three tallest plants, you need to find the Xs that are furthest to the right on the number line, then add their values together.
2 \cfrac{7}{8}+2 \cfrac{7}{8}+2 \cfrac{3}{4}= \; ?
To add the three fractions, you need a common denominator first. Then, you can add the whole numbers and add the fractions, then simplify.
2 \cfrac{7}{8}+2 \cfrac{7}{8}+2 \cfrac{6}{8}=6 \cfrac{20}{8}=8 \cfrac{4}{8}=8 \cfrac{1}{2}
6. A group of 5 th graders each planted a seed. They have been tracking the heights of their plants over the last 2 weeks. The line plot below represents the heights of the plants to the nearest eighth of an inch.

What is the difference between the tallest plant and the shortest plant height?
\cfrac{3}{4} inch
\cfrac{7}{8} inch
1 inch
\cfrac{5}{8} inch
The tallest plant height is 2 \cfrac{7}{8} inch and the shortest is 2 \cfrac{1}{8} inch.
Subtract to find the difference, then simplify the answer.
2 \cfrac{7}{8}-2 \cfrac{1}{8}=\cfrac{6}{8}=\cfrac{3}{4}
Therefore, the difference is \cfrac{3}{4} inch.
Line plot FAQs
A line plot is a type of graph used to display data where each data point is plotted as an X or a dot (or another symbol) above a number line.
The different types of frequency graphs include histograms, bar graphs, and line plots.
Line plots show the frequency distribution of discrete data points along a number line, while line graphs display trends or relationships between variables over time or categories.
To find outliers on a line plot, look for data points that are noticeably far away from the main cluster of points.
The next lessons are
Still stuck?
At Third Space Learning, we specialize in helping teachers and school leaders to provide personalized math support for more of their students through high-quality, online one-on-one math tutoring delivered by subject experts.
Each week, our tutors support thousands of students who are at risk of not meeting their grade-level expectations, and help accelerate their progress and boost their confidence.

Find out how we can help your students achieve success with our math tutoring programs.
[FREE] Common Core Practice Tests (3rd to 8th Grade)
Prepare for math tests in your state with these 3rd Grade to 8th Grade practice assessments for Common Core and state equivalents.
Get your 6 multiple choice practice tests with detailed answers to support test prep, created by US math teachers for US math teachers!