High Impact Tutoring Built By Math Experts
Personalized standards-aligned one-on-one math tutoring for schools and districts
Pictograph
Here you will learn about pictographs, including constructing, reading, and interpreting them.
Students first learn about pictographs in 2 nd grade with their work representing data in measurement and data. They expand their knowledge of analyzing and representing data as they progress through elementary and middle school.
What is a pictograph?
A pictograph or a picture graph uses pictures to show data. It is a method of data visualization.
Tally charts can be represented by pictographs. To draw a pictograph, you use a graphic symbol that goes with the frequency or value. The key of the pictograph explains the numerical value that the symbol represents.
A pictograph design can be constructed using a table with two columns. In the first column is the name of the group or category, and the second column features the graphic symbol.

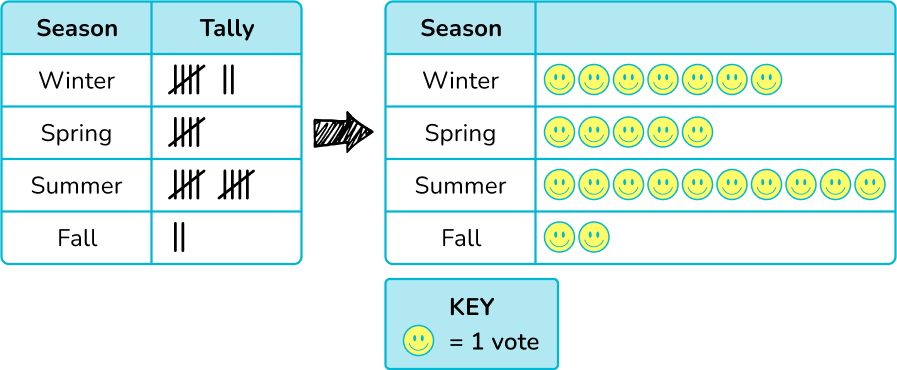
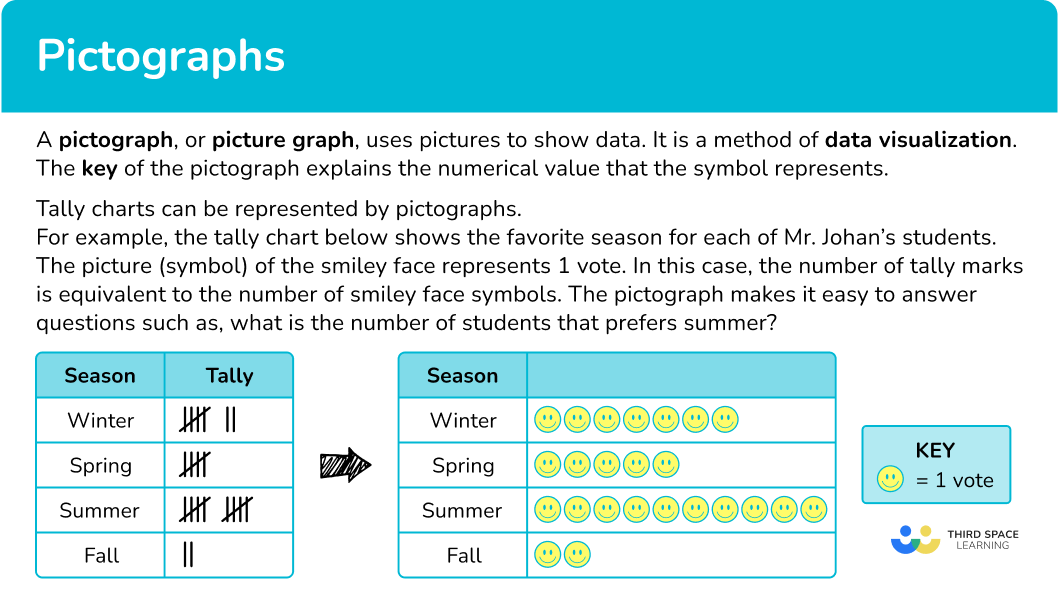
In the above example, the tally chart below shows the frequency of the data for the favorite season for each of Mr. Johan’s students. Let’s represent the tally chart as a pictograph.
The picture (symbol) of the smiley face represents 1 vote. In this case, the number of smiley faces is equivalent to the number of tally marks. 7 students liked winter as their favorite season, so on the pictograph there are 7 smiley faces for winter.
The pictograph makes it easy to answer questions such as, what is the number of students that prefer summer?
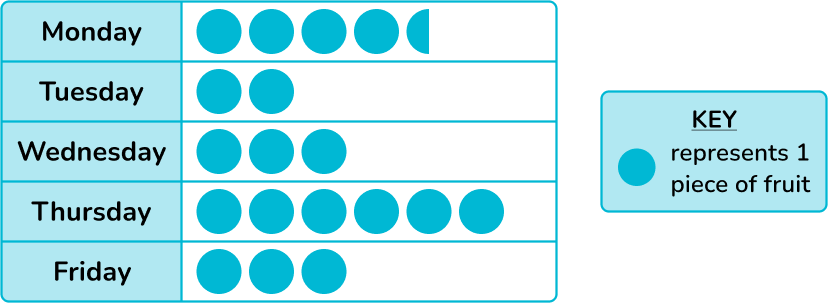
This pictograph represents the amount of fruit eaten by one person per day over the course of one week. Here, each green circle represents 1 piece of fruit and so we can see that 4 and a half pieces of fruit were consumed on Monday, 2 pieces of fruit were consumed on Tuesday, etc.
History of pictographs
Some of the first pictographs were found in the Americas. Have you been to the Petroglyph National Monument in New Mexico? Here you will find some of the first pictographs ever created.
Petroglyphs are rock carvings or rock paintings, which are also called pictographs.

Approximately 90 \% of the national monument’s petroglyphs were created by the ancestors of today’s Pueblo people (Native Americans) who lived in the Rio Grande Valley since about 500 \, AD.
What is a pictograph?
Common Core State Standards
How does this apply to 1 st grade – 6 th grade math?
- Grade 1 – Measurement and Data (1.MD.C.4)
Organize, represent, and interpret data with up to three categories; ask and answer questions about the total number of data points, how many in each category, and how many more or less are in one category than in another.
- Grade 2 – Measurement and Data (2.MD.D.10)
Draw a picture graph and a bar graph (with single-unit scale) to represent a data set with up to four categories. Solve simple put together, take-apart, and compare problems using information presented in a bar graph.
- Grade 3 – Measurement and Data (3.MD.B.3)
Draw a scaled picture graph and a scaled bar graph to represent a data set with several categories. Solve one- and two-step “how many more” and “how many less” problems using information presented in scaled bar graphs.
- Grade 4 – Number and Operations – Fractions (4.NF.B.3.b)
Decompose a fraction into a sum of fractions with the same denominator in more than one way, recording each decomposition by an equation. Justify decompositions, for example, by using a visual fraction model.
- Grade 5 – Number and Operations – Base Ten (5.NBT.A.2)
Explain patterns in the number of zeros of the product when multiplying a number by powers of 10, and explain patterns in the placement of the decimal point when a decimal is multiplied or divided by a power of 10. Use whole number exponents to denote powers of 10.
How to read a pictograph
In order to read a pictograph:
- Read the key in order to find the value of each symbol.
- Interpret the data to answer the question.
![[FREE] Represent and Interpret Data Check for Understanding (Grade 1 to 3)](https://thirdspacelearning.com/wp-content/uploads/2023/11/Represent-and-Interpret-Data-listing-image.png)
[FREE] Represent and Interpret Data Check for Understanding (Grade 1 to 3)
Use this quiz to check your 1st, 2nd and 3rd grade students’ understanding of representing and interpreting data. 15+ questions with answers covering a range of 1st, 2nd and 3rd grade represent and interpret data topics to identify areas of strength and support!
DOWNLOAD FREE [FREE] Represent and Interpret Data Check for Understanding (Grade 1 to 3)
Use this quiz to check your 1st, 2nd and 3rd grade students’ understanding of representing and interpreting data. 15+ questions with answers covering a range of 1st, 2nd and 3rd grade represent and interpret data topics to identify areas of strength and support!
DOWNLOAD FREEPictograph examples
Example 1: read/interpret pictograph
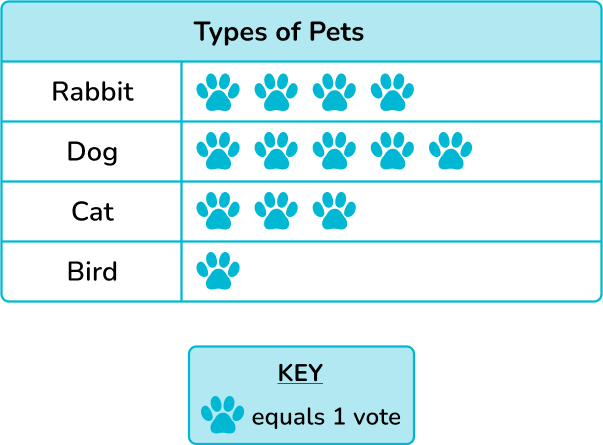
At a family reunion, Dara took a survey of her relatives’ favorite type of pet and made the pictograph below. Which pet had exactly four votes?
- Read the key in order to find the value of each symbol.
Each paw print symbol is equal to 1 vote.
2Interpret the data to answer the question.
Looking at each of the rows
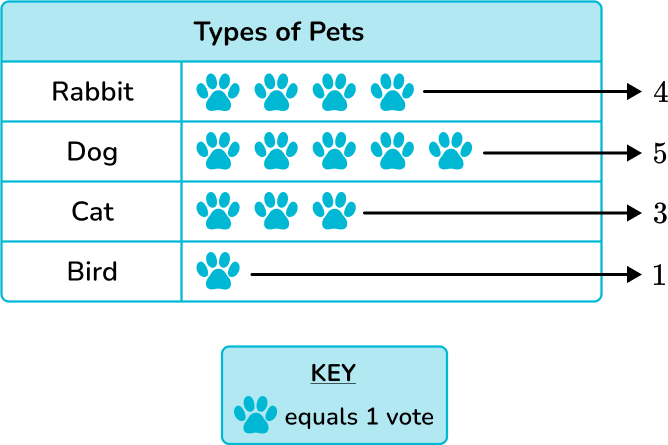
The rabbit was the pet with exactly 4 votes.
Example 2: read/interpret a pictograph
The pictograph below shows the favorite sport of Ms. Barr’s class. How many fewer students like baseball than soccer?
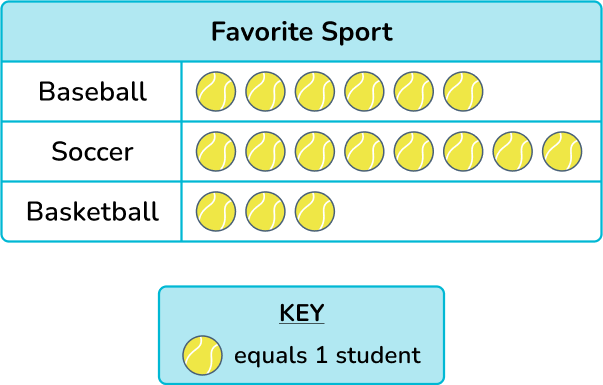
Each ball symbol is equal to 1 student.
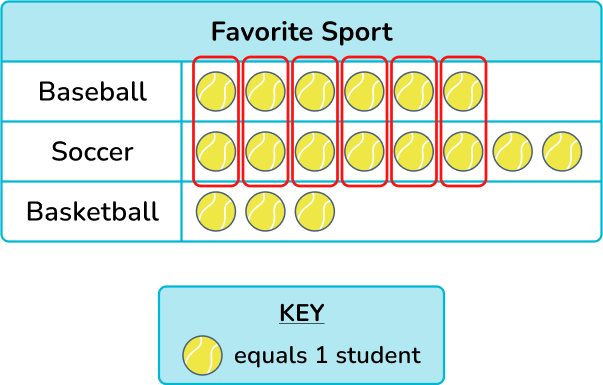
There are 8 ball symbols for soccer which means 8 students favor soccer. There are 6 ball symbols for baseball which means 6 students favor baseball.
Comparing the ball symbols in each row, you can see there are 2 more ball symbols in the soccer row which means 2 fewer students favored baseball than soccer.
Example 3: read/interpret pictograph
The pictograph below represents the number of cars that parked in the train station parking lot over the course of 7 days. How many cars were parked in the lot on Day 4?
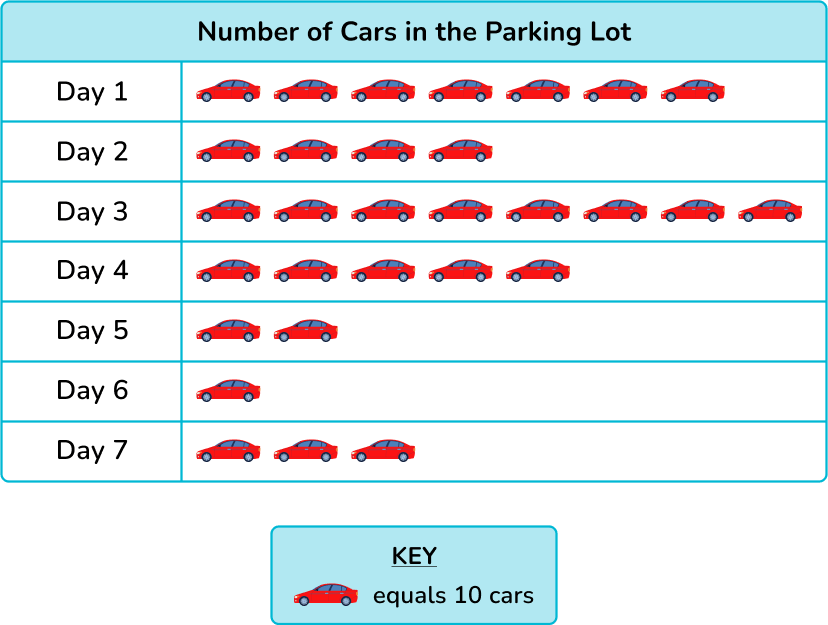
Each car symbol represents 10 cars.
On the pictograph, Day 4 has 5 cars.
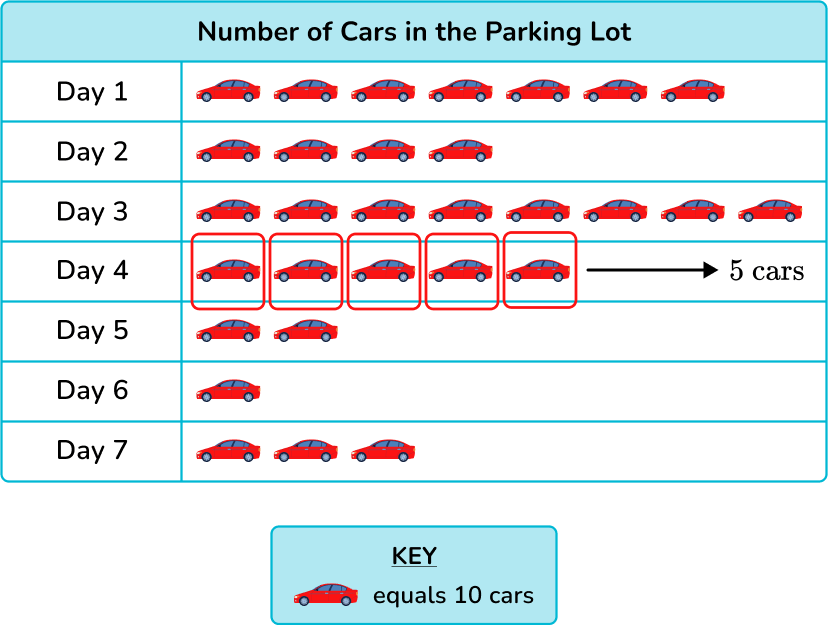
You can skip count starting with 10.

OR
You can add,
10+10+10+10+10=50
There were 50 cars in the lot on Day 4.
How to construct a pictograph
In order to construct a pictograph:
- Make sure the table has the correct number of rows.
- Label the table.
- Make a key.
- Count the graphic symbols for each row.
- Draw the graphic symbols into the pictograph.
Example 4: construct a pictograph with graphic symbol equal to 1 unit
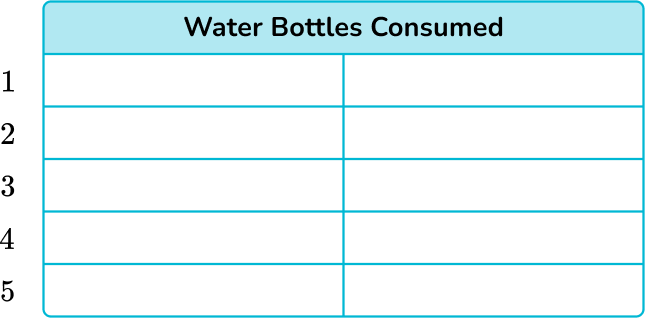
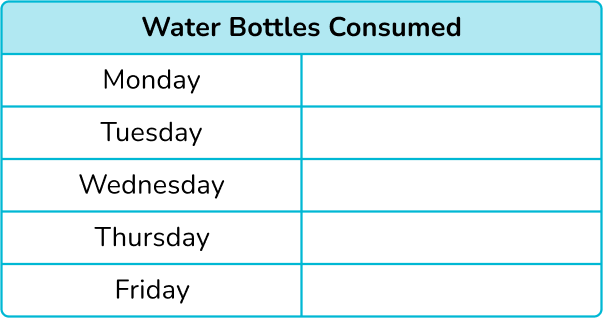
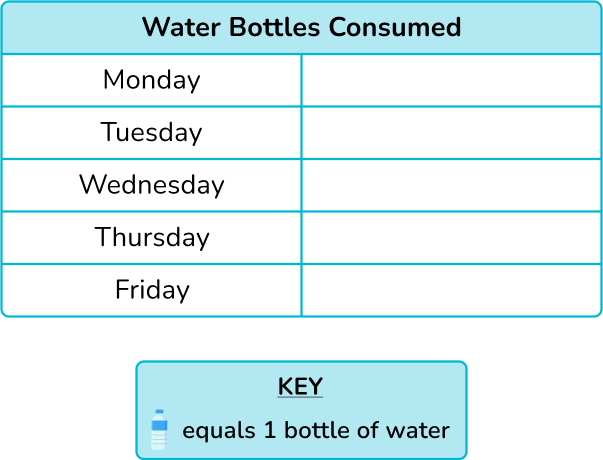
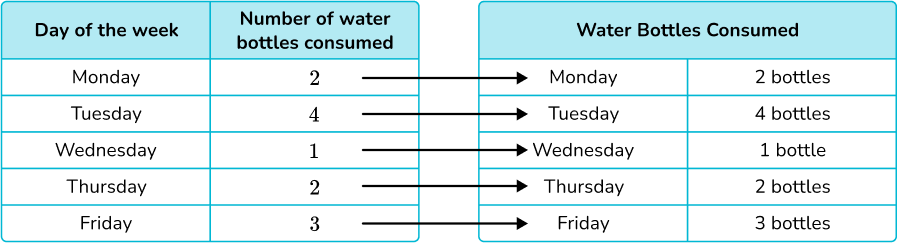
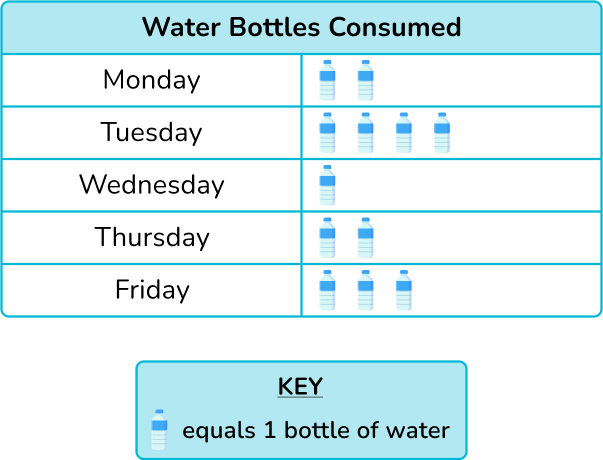
Use the information in the following table to construct a pictogram of the number of water bottles drank per day over 5 days.
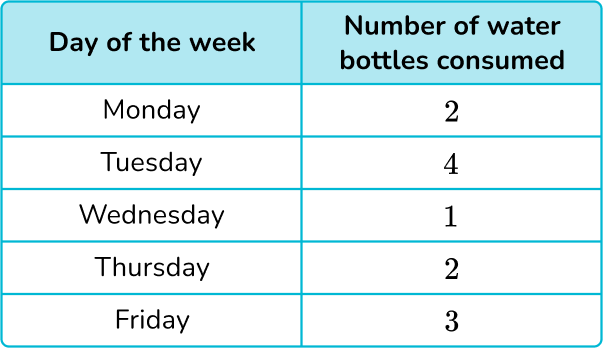
There are 5 days on the tally chart, so there should be 5 rows on the pictograph.
Example 5: construct a pictograph from a tally chart
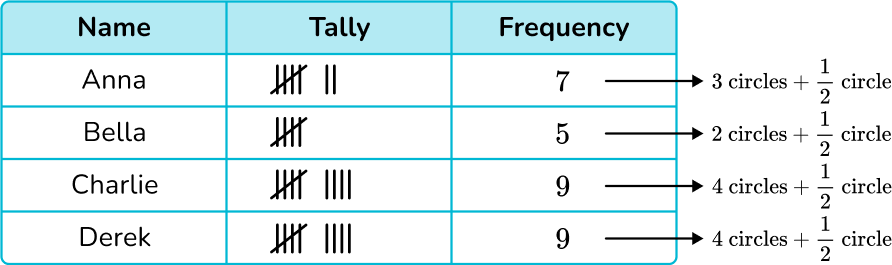
Four students were playing a game of marbles. The number of games won is recorded in the tally chart below.
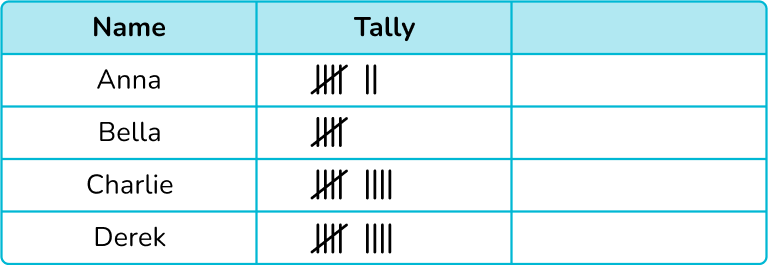
Draw a pictogram of the number of game wins. Use the key provided.

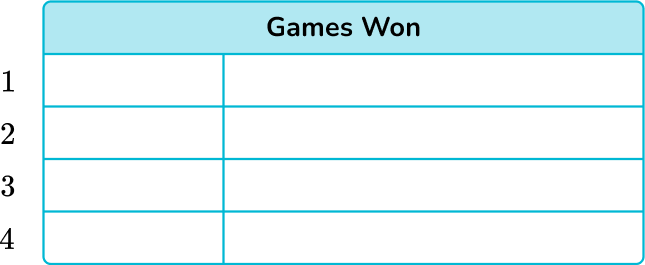
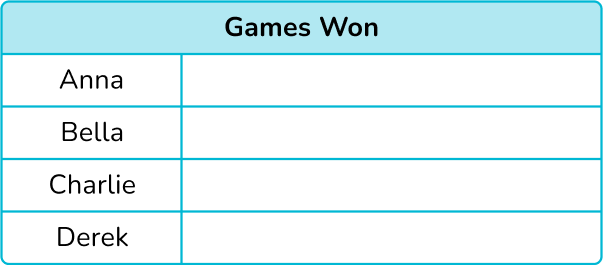
There are 4 people, Anna, Bella, Charlie, and Derek so the pictograph has 4 rows.
The key is given.

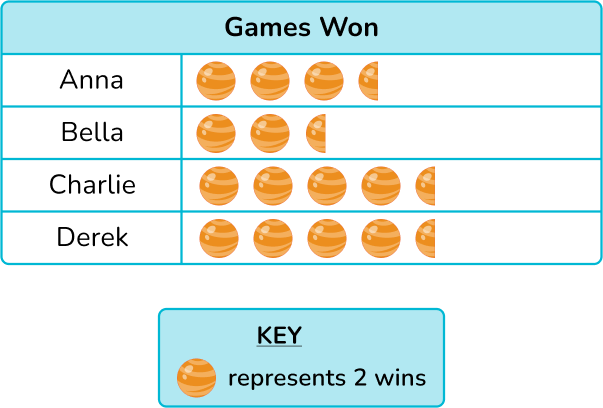
One circle represents 2 wins.
Half circle represents 1 win. ![]()
Example 6: construct a pictograph with graphic symbol equal to a large value
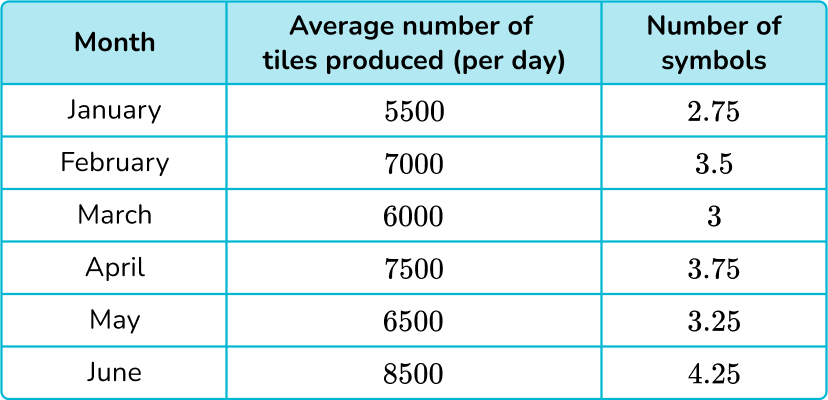
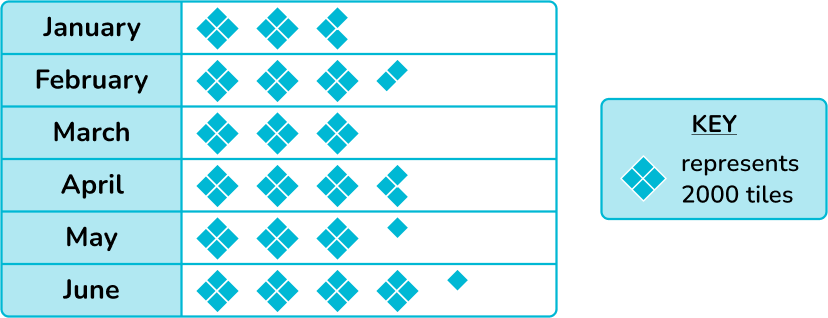
A tile manufacturer is calculating the average number of tiles the factory produces per day over the first 6 months of the year. Below is a table of results.
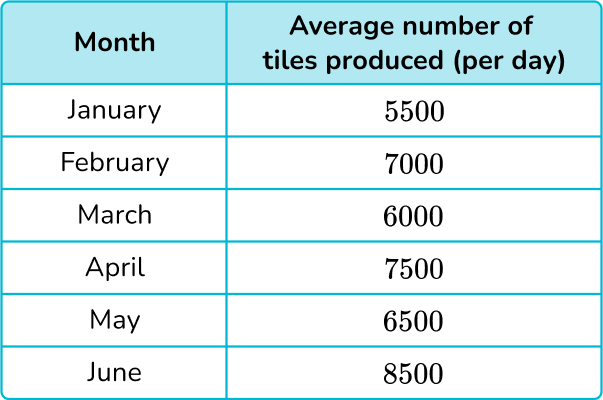
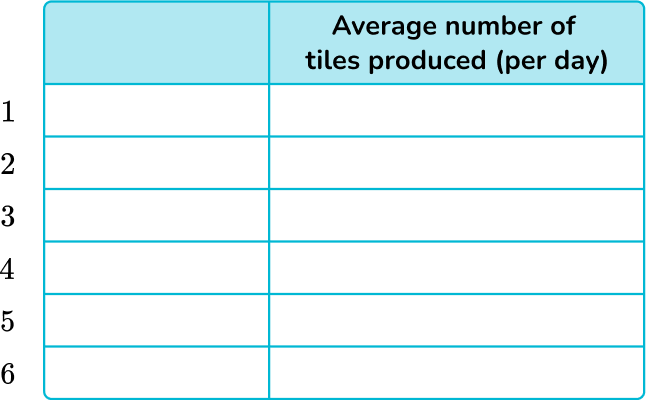
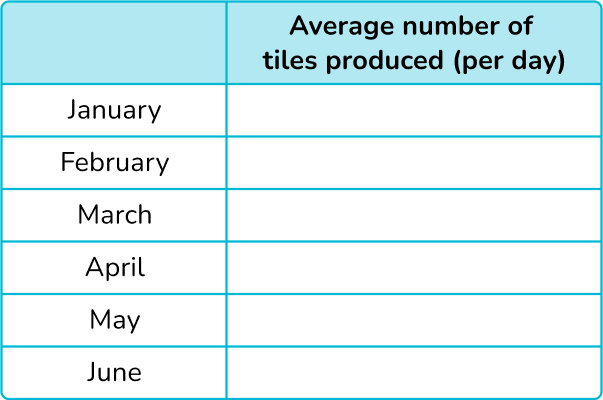
There are 6 months, January, February, March, April, May, and June so there should be 6 rows.

Since there are four diamond shapes in the symbol, each small diamond equals 500 tiles.
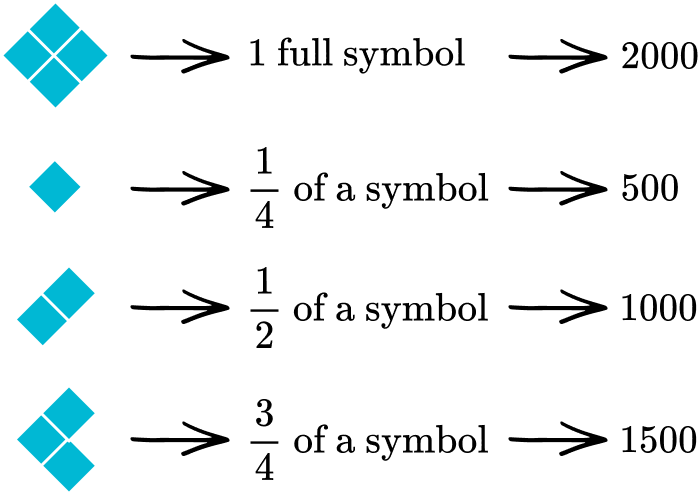
In order to figure out how many symbols there should be in each row, divide the tally for each month by 2000.
\text { January }=5000 \div 2000=2.75 → 2 full symbols and 0.75 or \cfrac{3}{4} of the third symbol.
\text { February }=7000 \div 2000=3.5 → 3 full symbols and 0.5 or \cfrac{1}{2} of the fourth symbol.
\text { March }=6000 \div 2000=3 → 3 full symbols.
\text { April }=7500 \div 2000=3.75 → 3 full symbols and 0.75 or \cfrac{3}{4} of the fourth symbol.
\text { May }=6500 \div 2000=3.25 → 3 full symbols and 0.25 or \cfrac{1}{4} of the fourth symbol.
\text { June }=8500 \div 2000=4.25 → 4 full symbols and 0.25 or \cfrac{1}{4} of the fifth symbol.
Teaching tips for pictographs
- Make it a habit of creating a pictograph as a classroom, for common daily, weekly or monthly activities.
- Instead of giving students math worksheets to practice, provide authentic learning experiences for students where they can create their own pictographs with data they collected.
- Include projects that provide choice for students where they can choose the visual representation of data.
- Reinforce with students the importance of reading the key of pictographs so that they interpret the pictorial symbols and data correctly.
- Reinforce to students that pictographs are pictorial representations of numerical data. Similarly, bar graphs and pie charts are other ways to visually represent data.
Easy mistakes to make
- Students lining up the graphic symbols incorrectly
The graphic symbols should be aligned to the left of the column, and not randomly placed within the space. This is because the pictogram is easier to read when the symbols are in line with each other.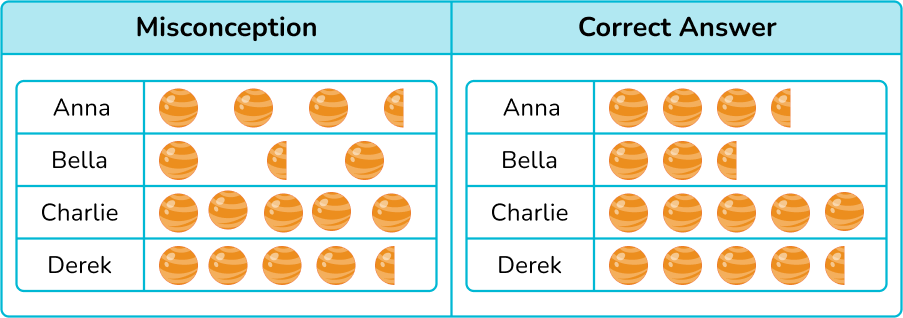
- Students not putting the fractional or part of the graphic symbol last
On pictographs, list the full symbols first followed by the fractional parts of the symbols. For example, the pictogram below would be incorrect as the half smiley faces do not appear as the last image in the row.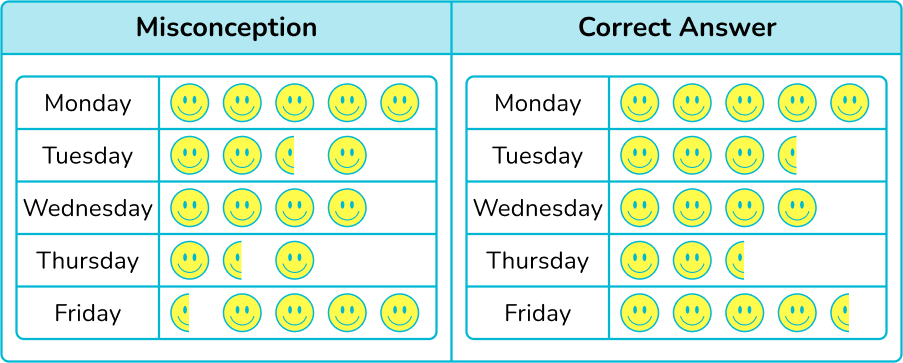
- Thinking that a part of a symbol cannot be a whole number
The use of part of a symbol does not mean that the actual value is fractional. For example, in the graph above, if the smiley face represents 4 people, then half of a smiley face would represent 2 people, which is NOT fractional, but a whole number.
Related represent and interpret data lessons
Practice pictograph questions
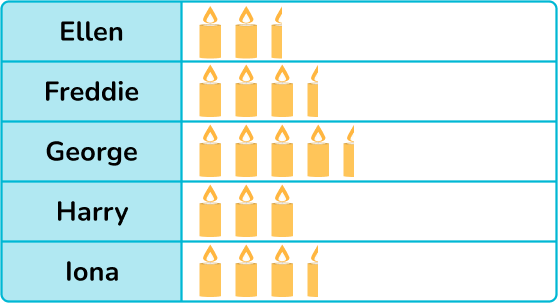
1. Jamil records the number of sodas he drinks per day over one week.
He displays his results in the pictogram below.
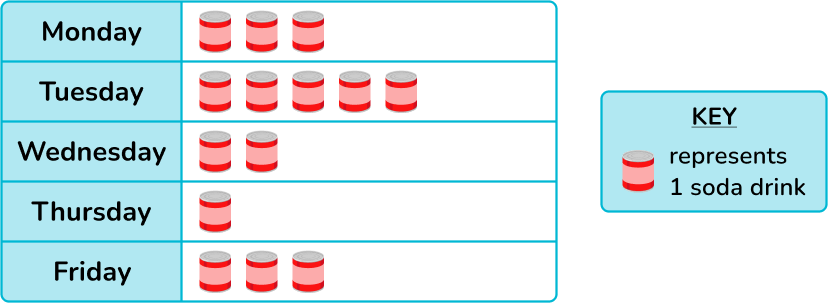
Use the given data to determine how many sodas Jamil drank in total for the week?


The key shows that one symbol represents 1 soda. To find the total number of sodas Jamil drinks in the week, add up the amount of symbols in the pictograph.
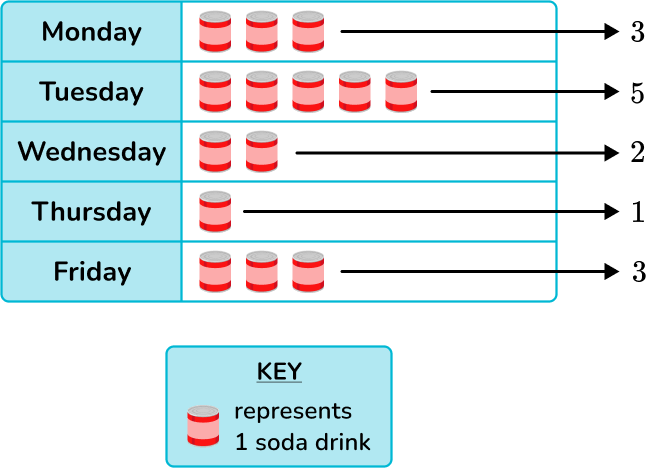
3+5+2+1+3=14
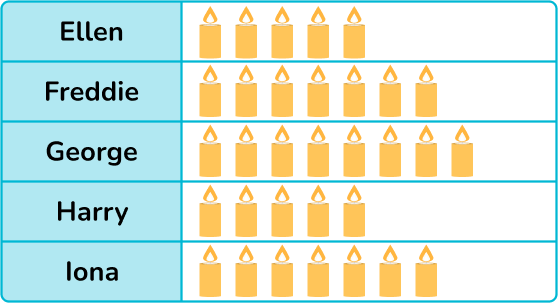
2. A nursery school records the number of children that attend their after school play group over one week. The pictogram below shows their results.
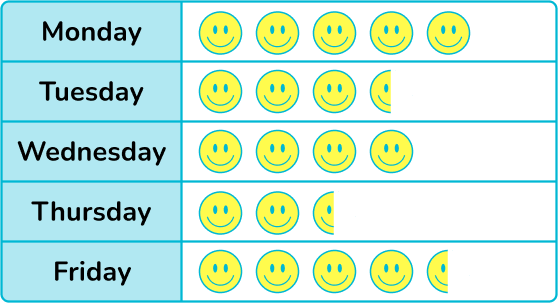
Given that 8 children attended on Wednesday, determine the number of children who attended on Thursday.
The two rows that are important to focus on are Wednesday and Thursday.
There is no key provided with this pictograph, so you need to find the value of one smiley face so that you can find the number of children on Thursday.
Notice there are 4 smiley faces for Wednesday, which is equivalent to 8 children. To find out what 1 smiley face is equal to you can divide, 8 \div 4=2. \; 1 smiley face is equal to 2 children.
So, there are 2.5 smiley faces represented for Thursday, which means that there are 5 children in attendance for Wednesday. You can multiply, 2.5 \times 2=5
3. The table below shows the age of 5 children.
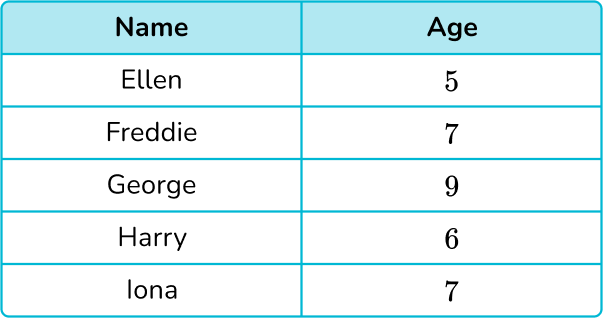
Represent this information in a pictogram. Use the key provided
below.

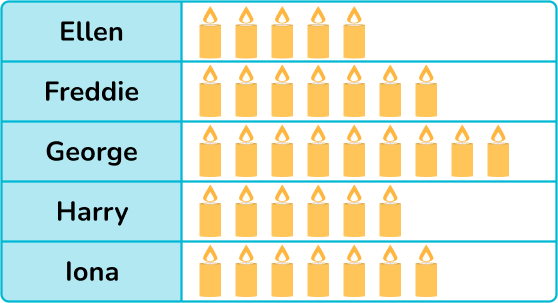
Each candle represents 1 year so the number of candles for each row matches the age of the child. All the symbols are left aligned with the correct number in each row.
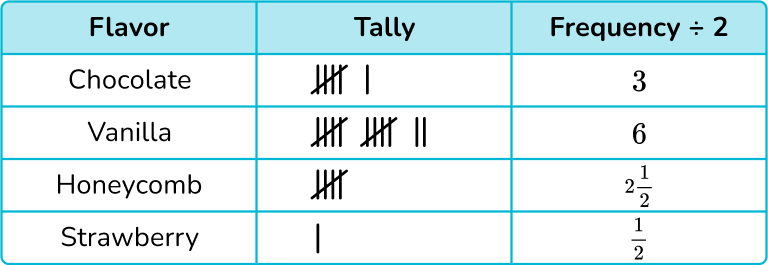
4. The number of different flavors of ice cream sold on one day is shown in the tally chart below.
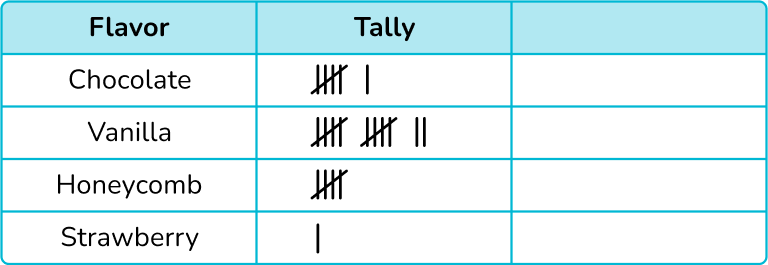
Using the key, ![]() represents 2 ice creams, construct a pictogram to show this data.
represents 2 ice creams, construct a pictogram to show this data.
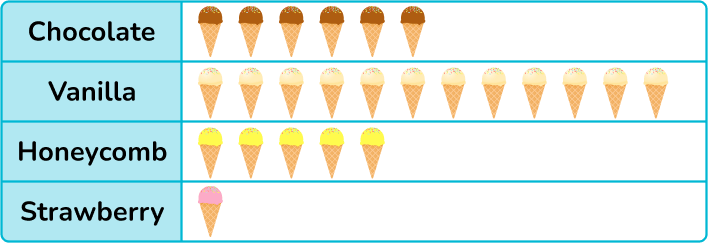
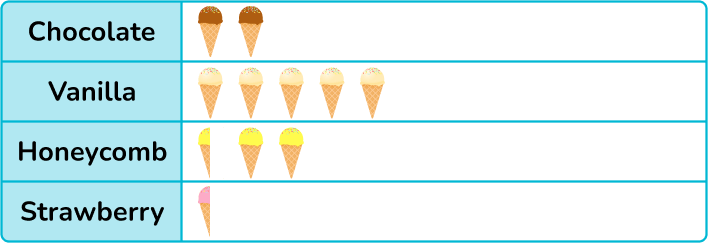
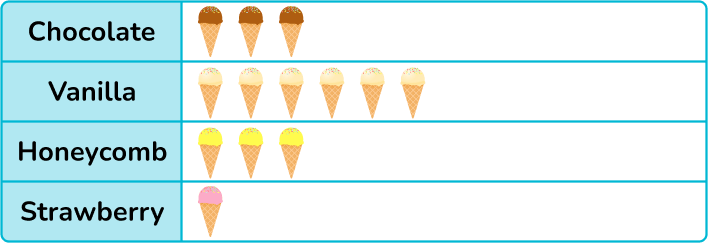
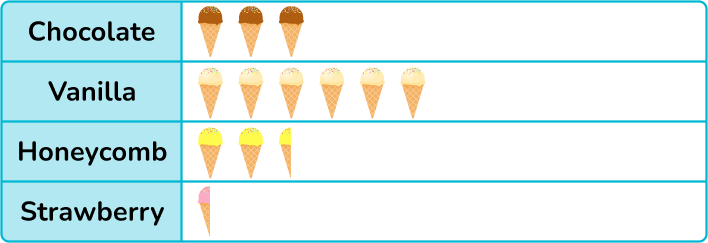
Each symbol represents 2 ice creams, so we need to divide each frequency by 2 and then draw that number of ice creams in each row.
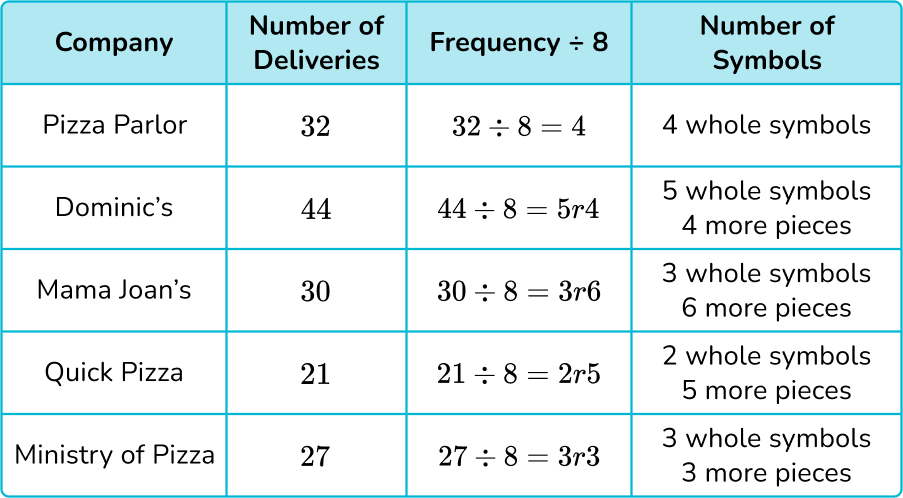
5. A delivery company is looking at how many pizzas they have delivered from 5 different companies in one evening.
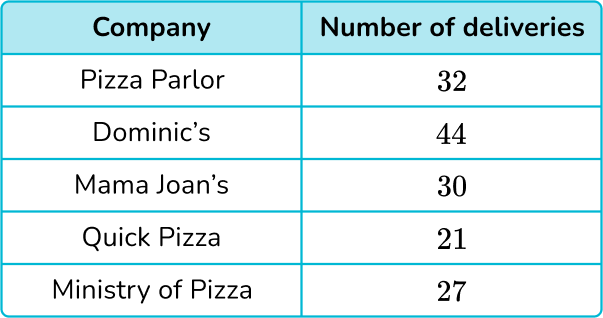
Use the information in the table below to draw a pictogram of this data with the key:  represents 8 deliveries.
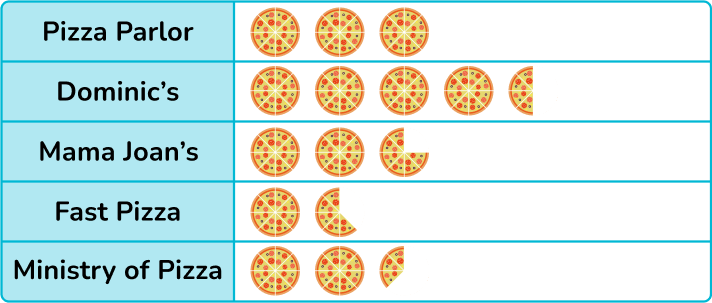
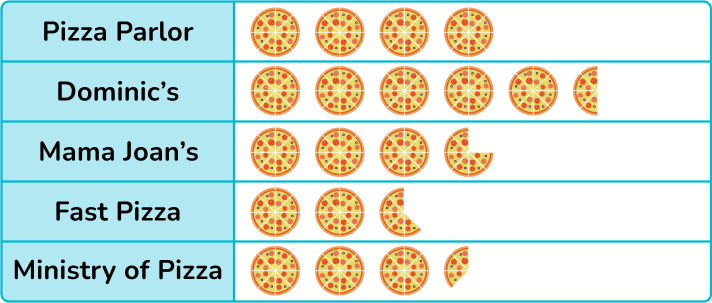
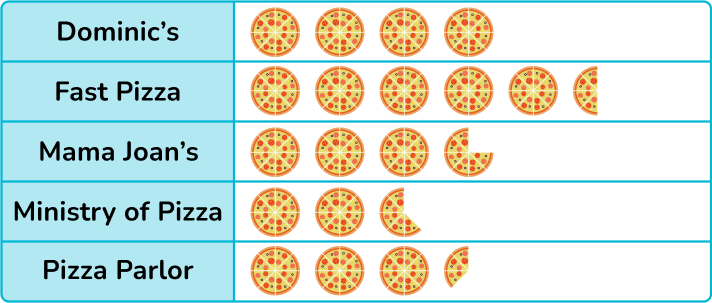
As each symbol represents 8 deliveries and since the symbol is divided into 8 small pie pieces, one section of the symbol can represent 1 delivery.
Dividing each frequency by 8, you get the number of full symbols and the remainder represents how many more pieces of the symbols are needed.
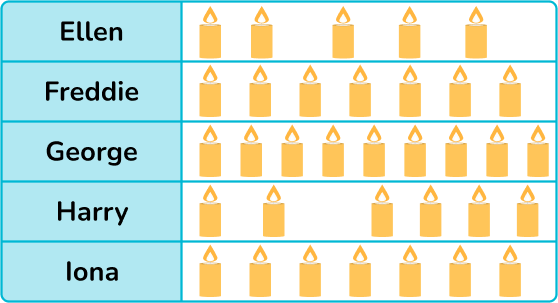
6. The pictogram below shows the number of days of sunshine over 5 weeks. State the error made within this pictogram.
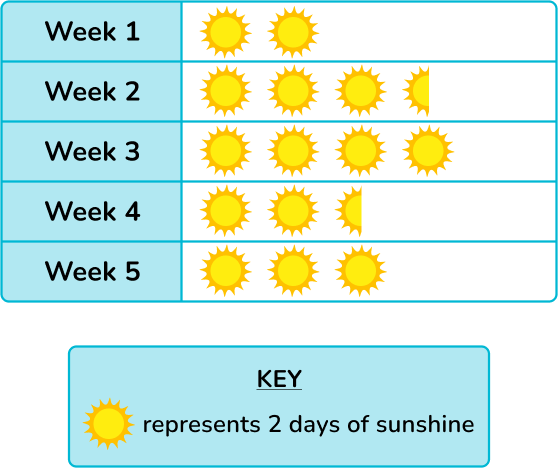
The symbols are not the same in weeks 2 and 4.
The frequencies are not in order from smallest to largest.
The symbols should be drawn on top of each other like a bar chart.
The number of days in week 3 is more than 7.
Week 3 has 4 suns. As each sun is worth 2 days, the number of days in week 3 is 4 \times 2=8 which is not possible.
Pictographs FAQs
A pictograph or a picture graph uses pictures to show data. It is a method of data visualization.
Data handling is the process of gathering, recording, and presenting statistical data in graphs or charts.
Pictography is a way of communicating through pictures and drawings. Pictographs are a form of pictography.
Hieroglyphics was a form of picture writing of the Ancient Egyptians. Hieroglyphics are also known as pictograms.
Yes, pictures or pictograms are used all the time to communicate such as the hazard symbol when something is flammable, bathroom symbols, and in international airports so travelers can find ground transportation.
The next lessons are
Still stuck?
At Third Space Learning, we specialize in helping teachers and school leaders to provide personalized math support for more of their students through high-quality, online one-on-one math tutoring delivered by subject experts.
Each week, our tutors support thousands of students who are at risk of not meeting their grade-level expectations, and help accelerate their progress and boost their confidence.

Find out how we can help your students achieve success with our math tutoring programs.
[FREE] Common Core Practice Tests (3rd to 8th Grade)
Prepare for math tests in your state with these 3rd Grade to 8th Grade practice assessments for Common Core and state equivalents.
Get your 6 multiple choice practice tests with detailed answers to support test prep, created by US math teachers for US math teachers!