High Impact Tutoring Built By Math Experts
Personalized standards-aligned one-on-one math tutoring for schools and districts
In order to access this I need to be confident with:
Integers Coordinate Plane Algebraic expressions Substitution One step equationsIndependent and dependent variables
Here you will learn about independent and dependent variables, including what they are, how to use them to represent real world problems and how to solve those problems.
Students will first learn about independent and dependent variables as part of expressions and equations in 6 th grade.
What are independent and dependent variables?
Independent and dependent variables are types of variables that change in relation to each other.
The independent variable change causes a measurable change in the dependent variable. In equations, it is typically represented by the variable x. When graphed, it is represented on the x -axis. It can also be called the input.
The dependent variable is determined by the independent variable. In equations, it is typically represented by the variable y. When graphed, it is represented on the y -axis. It can also be called the output.
For example,
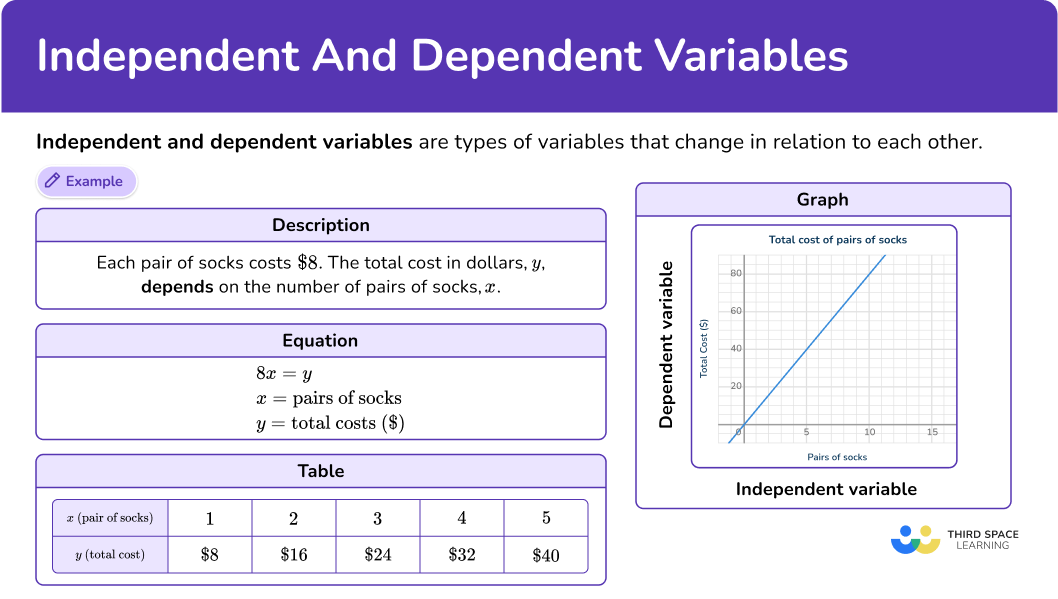
Each pair of socks costs \$ 8. The total cost in dollars, y, depends on the number of pairs of socks, x.
This can be shown with an equation, in a table or on a graph:
Table:

Each pair of socks adds \$ 8 to the total cost. Always define the units of each variable in a table.
Equation: 8x=y; \, x= pairs of socks; y= total cost (\$)
The total cost will always be 8 times the number of pairs of socks, since each pair of socks costs \$ 8. After writing an equation, always define the units of each variable.
Graph:
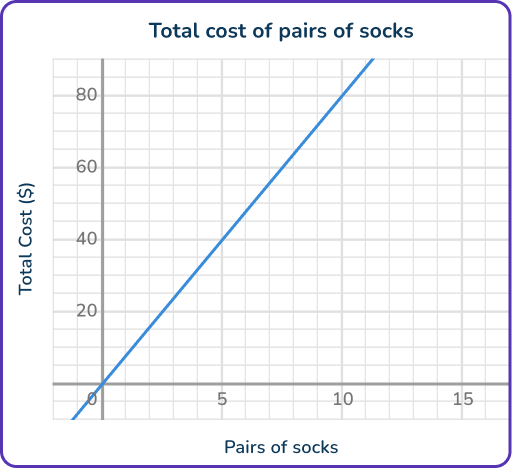
As the pairs of socks increase, so does the total cost, by \$ 8 for each pair. Always label the units of the axes and give the graph a title.
What are independent and dependent variables?
Common Core State Standards
- Grade 6 – Expressions and Equations (6.EE.C.9)
Use variables to represent two quantities in a real-world problem that change in relationship to one another; write an equation to express one quantity, thought of as the dependent variable, in terms of the other quantity, thought of as the independent variable. Analyze the relationship between the dependent and independent variables using graphs and tables, and relate these to the equation.
For example, in a problem involving motion at constant speed, list and graph ordered pairs of distances and times, and write the equation d=65t to represent the relationship between distance and time.
![[FREE] Algebra Worksheet (Grade 6 to 8)](https://thirdspacelearning.com/wp-content/uploads/2023/07/Algebra-check-for-understanding-quiz-listing-image-.png)
[FREE] Algebra Worksheet (Grade 6 to 8)
![[FREE] Algebra Worksheet (Grade 6 to 8)](https://thirdspacelearning.com/wp-content/uploads/2023/07/Algebra-check-for-understanding-quiz-listing-image-.png)
Teaching independent and dependent variables? Use this quiz to check your students’ understanding of algebra. 10+ questions with answers covering a range of 6th and 8th grade algebra topics to identify areas of strength and support!
DOWNLOAD FREE![[FREE] Algebra Worksheet (Grade 6 to 8)](https://thirdspacelearning.com/wp-content/uploads/2023/07/Algebra-check-for-understanding-quiz-listing-image-.png)
[FREE] Algebra Worksheet (Grade 6 to 8)
![[FREE] Algebra Worksheet (Grade 6 to 8)](https://thirdspacelearning.com/wp-content/uploads/2023/07/Algebra-check-for-understanding-quiz-listing-image-.png)
Teaching independent and dependent variables? Use this quiz to check your students’ understanding of algebra. 10+ questions with answers covering a range of 6th and 8th grade algebra topics to identify areas of strength and support!
DOWNLOAD FREEHow to represent a real world problem with independent and dependent variables:
In order to represent a real world problem with independent and dependent variables:
- Define the independent and dependent variable.
- Define the relationship between the variables.
- Create or use a representation to solve.
Independent and dependent variables examples
Example 1: find the value of the dependent variable
A train is travelling 55 miles per hour. How many miles will the train travel after 6 hours? Show the relationship in a table, then solve.
- Define the independent and dependent variable.
The time the train travels (in hours) and the distance it travels (in miles) are the two variables. Since the number of miles traveled depends on how many hours the train has been traveling, it is the dependent variable y. This makes the hours the train has been traveling the independent variable x.
2Define the relationship between the variables.
The rate given, 55 miles per hour, shows that for each hour, the train will travel a distance of 55 miles.
You can model this in a table:

Relationship:
The total miles are always 55 times the hours
OR
For every additional hour, 55 more miles are traveled.
3Create or use a representation to solve.
To solve, you can extend the table:

OR
The total miles are always 55 times the hours, so 55\times{6}=~\ldots
Either way you solve, you see that 6 hours is 330 miles.
Example 2: find the value of the independent variable
On his birthday, Michael’s grandmother always gives him money. She gives him \$ 10 more than his age. How old was he when she gave him \$ 25?
Show the relationship in a table, then solve.
Define the independent and dependent variable.
Michael’s age (years) and the money his grandmother gives him (dollars) are the two variables. Since the money his grandmother gives him depends on his age, it is the dependent variable y. This makes Michael’s age, the independent variable x.
Define the relationship between the variables.
Michael always gets \$ 10 more than his age.
You can model this in a table:

Relationship:
The birthday money is always 10 more than the age
OR
For every year added, \$ 1 more is given.
Create or use a representation to solve.
You can extend the table…

OR
The birthday money is always 10 more than the age, so x+10=25.
To find x, think about what number added to 10 is equal to 25.
Either way you solve, you see that Michael was 15 years old.
Example 3: creating the equation
Daniel practices the piano 5 hours each week. Write an equation to calculate Daniel’s total practice hours after some weeks.
Define the independent and dependent variable.
The total practice hours and the number of weeks Daniel has been practicing are the two variables. Since the total practice hours depends on how many weeks Daniel has been practicing, it is the dependent variable y. This makes the weeks Daniel has been practicing the independent variable x.
Define the relationship between the variables.
The rate given is 5 hours for every week.
You can model this in a table:

Relationship:
The total practice hours are always 5 times the weeks of practice.
Create or use a representation to solve.
To calculate the total practice hours, you multiply the weeks of practice by 5.
So,
5x=y, where x=~\text{number of weeks of practice} and y=~\text{total practice hours}
Example 4: creating the equation
A store is having a sale and all the clothes are half off the original price. Write an equation to calculate the sale price.
Define the independent and dependent variable.
The sale price (dollars) and the original price of the clothes (dollars) are the two variables. Since the sale price depends on the cost of the clothes, it is the dependent variable y. This makes the original cost of clothes the independent variable x.
Define the relationship between the variables.
The sale price is half the original price.
You can model this in a table:

Relationship:
The sale price is always 0.5 \, (or \cfrac{1}{2}) times the original price.
Create or use a representation to solve.
To calculate the sales price, you multiply the total price by 0.5 \, (or \cfrac{1}{2}).
So,
0.5x=y or \cfrac{1}{2} \, x=y, where x=~\text{original price} and y=~\text{sale price}
Example 5: comparing the equation and the graph
A marathon runner aims to run 20 miles. The equation and graph show the distance left to run after running some miles.
Equation: 20-x = y, where x=~\text{miles ran} and y=~\text{miles left to run}
Graph:
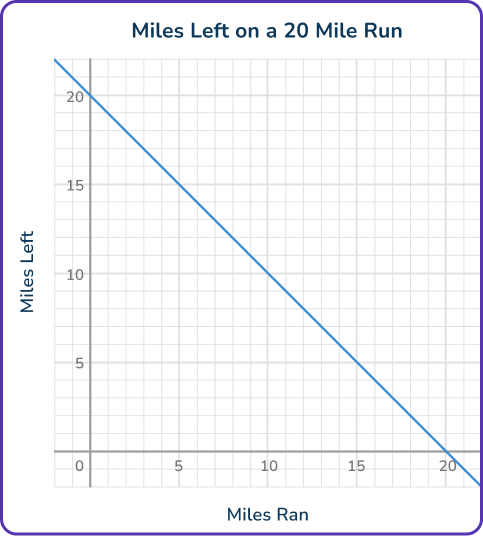
Explain why the graph and equation show the same relationship.
Define the independent and dependent variable.
The two variables are the miles ran and the miles left. Since the miles left depends on the miles ran, it is the dependent variable y. This makes the miles ran the independent variable x.
Define the relationship between the variables.
The equation shows that the total number of miles is always 20.
- When x=1, \, y=19 since 20-1=19.
- When x=2, \, y=18 since 20-2=18.
- When x=3, \, y=17 since 20-3=17.
If you look closely at the graph, you see this same relationship:
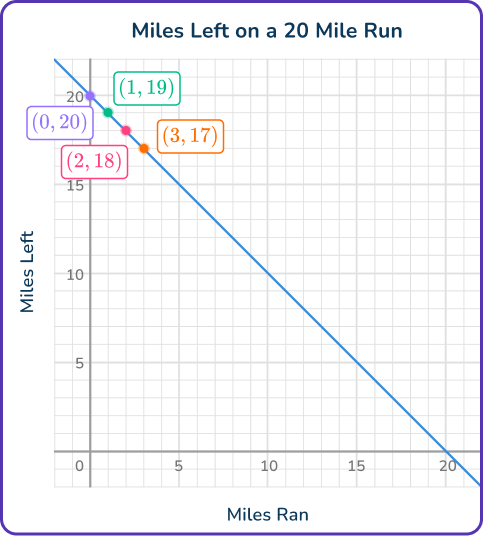
- The point (1, \, 19) shows that after 1 mile ran, 19 miles are left.
- The point (2, \, 18) shows that after 2 miles ran, 18 miles are left.
- The point (3, \, 17) shows that after 3 miles ran, 17 miles are left.
Create or use a representation to solve.
The equation and the graph both show that for every mile that ran, there is 1 less mile left to run. The points on the line of the graph are the same solutions to the equation, when x is subtracted from 20.
Example 6: comparing the table and the graph
A recipe book has two versions of the same recipe, including a “light recipe” for people that want to eat less salt. The equation and the table show the relationship between the salt in the two recipes.
Equation: \cfrac{1}{3} \, x=y, where x=~\text{regular recipe (grams)} and y=~\text{light recipe (grams)}
Table:

Explain why the table and equation show the same relationship.
Define the independent and dependent variable.
The salt in the light recipe (grams) and the salt in the regular recipe (grams) are the two variables. Since the salt in the light recipe depends on the salt in the regular recipe, it is the dependent variable y. This makes the grams of salt in the regular recipe the independent variable x.
Define the relationship between the variables.
The equation shows that the grams of salt in the light recipe are always \cfrac{1}{3} times the grams of salt in the regular recipe.
- When x=10, \, y=3\cfrac{1}{3} since \cfrac{1}{3}\times{10}=\cfrac{10}{3}=3\cfrac{1}{3}
- When x=20, \, y=6\cfrac{2}{3} since \cfrac{1}{3}\times{20}=\cfrac{20}{3}=6\cfrac{2}{3}
- When x=30, \, y=10 since \cfrac{1}{3}\times{30}=\cfrac{30}{3}=10
If you look closely at the table, you see this same relationship:

Create or use a representation to solve.
The equation and the graph both show that for every gram of salt in the regular recipe, the light recipe has \cfrac{1}{3} the amount. The inputs and outputs given in the table are the same solutions to the equation, when x is multiplied by \cfrac{1}{3}.
Teaching tips for independent and dependent variables
- Use a real word classroom example as an intro into this topic. For example, ask students to write down an item from the school cafeteria and the price. Then ask them to create a table of how many 1-5 items will cost. Use this as a jumping off point to introduce the variables and create tables, equations and graphs.
- Use the analogy of cause and effect to help students determine which variable is the independent and which is the dependent.
- Tie this into the grade level statistical analyses topics, helping students understand how independent and dependent variables connect to research design/research methods. This helps them better understand quantitative research and its connection to variables.
Easy mistakes to make
- Confusing the operation that connects the independent and dependent variable
Pay close attention to the real world context and the variable being described. Then describe it in your own words to make sense of it. Then try creating a table or graph with possible values. Use this to help you decide whether the relationship between the variables is addition, subtraction, multiplication or division.
- Confusing the independent vs dependent variable in real world situations
It can be tricky to immediately distinguish between independent and dependent variables. Consider the context: which variable affects the other? For some contexts, patterns will develop (such as price almost always being the independent variable). However, it can be hard to tell the difference for more subtle examples. Sometimes, either variable could be independent, depending on the specific context.
For example,
A recipe calls for 4 cups of blueberries for every 1 cup of cherries. This relationship could be written with either variable as independent.
Cherries: 4x=y, where x=~\text{cups of cherries} and y=~\text{cups of blueberries}
Blueberries: \cfrac{1}{4} \, x=y, where x=~\text{cups of blueberries} and y=~\text{cups of cherries}
Note: Even though the equations are different, they represent the same relationship and both could be used to solve.
- Confusing qualitative and quantitative data
Independent and dependent variables can only be defined for a relationship with quantitative data.
Related coordinate plane lessons
Practice independent and dependent variables questions
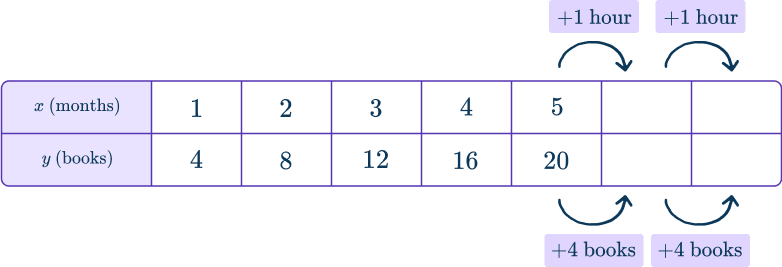
1. Ken reads 4 books each month. How many total books has Ken read after 7 months?


The rate given, 4 books per month, shows that for each month Ken will read 4 more books. The total books read, y, will depend on the months, x.
You can model this in a table:

Relationship:
The total books read are always 4 times the months
OR
For every additional month, 4 more books are read.
To solve, you can extend the table…
OR
The total books read are always 4 times the months, so 4 \times 7=~\ldots
Either way you solve, 28 books are read in 7 months.
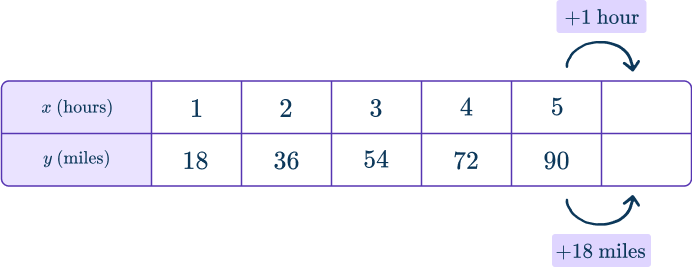
2. A drone is travelling 18 miles per hour. How many miles will the train travel after 6 hours?


The rate given, 18 miles per hour, shows that for each hour the drone will travel a distance of 18 miles. The miles traveled, y, will depend on the hours, x.
You can model this in a table:

Relationship:
The total miles are always 18 times the hours
OR
For every additional hour, 18 more miles are traveled.
To solve, you can extend the table…
OR
The total miles are always 18 times the hours, so 18 \times 6=~\ldots
Either way you solve, 108 miles are traveled in 6 hours.
3. Kai saves \$ 7.45 each week. Write an equation to calculate his total savings after some weeks. Define the variables.
7.45x=y;~x=~\text{weeks} and y=~\text{total savings (\$)}

7.45x=y;~x=~\text{total savings (\$)} and y=~\text{weeks}

x+7.45=y;~x=~\text{weeks} and y=~\text{total savings (\$)}

x+7.45=y;~x=~\text{total savings (\$)} and y=~\text{weeks}

The total savings and the number of weeks Kai has been saving are the two variables. Since the total savings hours depends on how many weeks Kai has been saving, it is the dependent variable y. This makes the weeks Kai has been saving the independent variable x.
The rate given is \$ 7.45 for every week.
You can model this in a table:

Relationship:
The total savings is always 7.45 times the weeks.
So,
7.45x=y, where x=~\text{weeks} and y=~\text{total savings (\$)}
4. Ibrahim has some pencils. He shares them equally between himself and his two brothers. Write an equation to calculate the number of pencils each person gets. Define the variables.
x\div{3}=y;~x=~\text{total pencils} and y=~\text{pencils each person gets}

x\div{3}=y;~x=~\text{pencils each person gets} and y=~\text{total pencils}

3x=y;~x=~\text{total pencils} and y=~\text{pencils each person gets}

3x=y;~x=~\text{pencils each person gets} and y=~\text{total pencils}

The total pencils and the number of pencils each person gets are the two variables. Since the number of pencils each person gets depends on the total pencils Ibrahim starts with, it is the dependent variable y. This makes the total pencils the independent variable x.
The pencils are always shared between 3 people.
You can model this in a table:

Note: For simplicity, we assume that there will be no left over pencils.
Relationship:
The total pencils are always divided by 3.
OR
The pencils each person gets is always \cfrac{1}{3} the total pencils.
So,
x\div{3}=y, where x=~\text{pencils each person gets} and y=~\text{total pencils}
5. A young plant starts at 5.8 centimeters tall. Which equation and the table show its total height after growing x centimeters?
Equation: 5.8+x=y, where x=~\text{centimeters grown} and y=~\text{total height (cm)}
Table:


Equation: 5.8x=y, where x=~\text{growth (cm)} and y=~\text{total height (cm)}
Table:


Equation: 5.8+x=y, where x=~\text{growth (cm)} and y=~\text{total height (cm)}
Table:


Equation: 5.8x=y, where x=~\text{growth (cm)} and y=~\text{total height (cm)}
Table:


As the young plant grows, its growth will be added to the original height, 5.8 centimeters, to show the total height.
This equation shows that the total height is always 5.8 \, cm more than the growth.
- When x=1, \, y=6.8 since 5.8+1=6.8
- When x=5, \, y=10.8 since 5.8+5=10.8
- When x=6, \, y=11.8 since 5.8+6=11.8
If you look at the table, you see this same relationship:

Create or use a representation to solve.
The equation and the table both show that the total height is always 5.8 more than the growth.
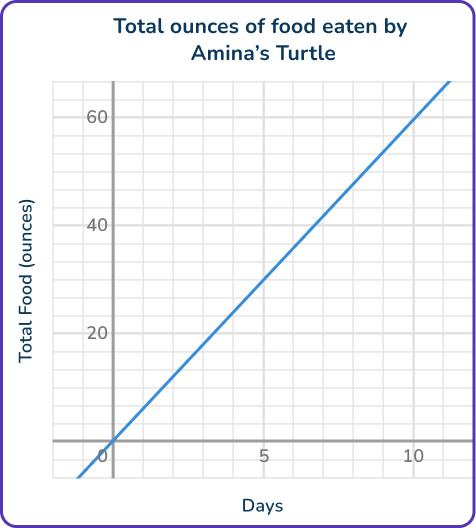
6. The graph and the equation show the total amount of food Amina’s turtle has eaten after x days.
Equation: 7x=y, where x=~\text{days} and y=~\text{total ounces of food eaten}
Graph:
Do the graph and the equation show the same relationship? Why?
Yes, the graph and equation show the turtle eating 6 ounces of food each day.

No, the graph shows the turtle eating more food each day.

Yes, the graph and equation show the turtle eating 7 ounces of food each day.

No, the equation shows the turtle eating more food each day.

The two variables are the days and the total food eaten (ounces). Since the total food eaten depends on the number of days, it is the dependent variable y. This makes the number of days the independent variable x.
The equation shows that the total food eaten is always 7 times the days.
- When x=1, \, y=7 since 7 \times 1=7
- When x=2, \, y=14 since 7 \times 2=14
- When x=3, \, y=21 since 7 \times 3=21
If you look closely at the graph, you see a different relationship…
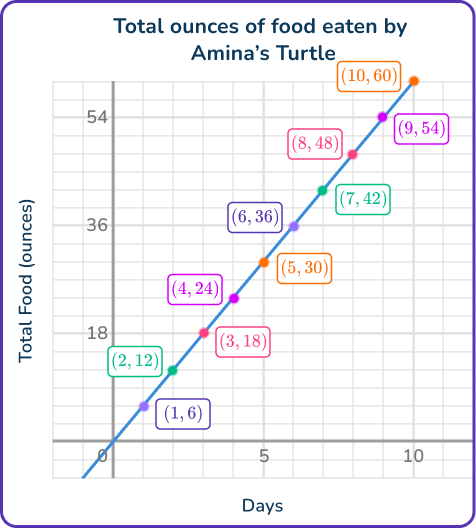
- The point (1, \, 6) shows that after 1 day, 6 ounces of food was eaten.
- The point (2, \, 12) shows that after 2 days, 12 ounces of food was eaten.
- The point (3, \, 81) shows that after 3 days, 18 ounces of food was eaten.
The equation and the graph both show that for every day that passes the turtle eats 6 more ounces of food. The points on the line of the graph are the same solutions to the equation, when x is multiplied by 6.
Independent and dependent variables FAQs
This is the same as a coordinate plane. This name refers to the French mathematician Rene Descartes who is credited with incorporating the use of the coordinate plane into mathematics.
Depending on the context of the real world situation or experimental design, it can be called a predictor variable, regressor, manipulated variable, explanatory variable or control variable.
Depending on the context of the real world situation, it can be called an outcome variable, predicted variable, response variable or responding variable.
They are an unmeasured variable that impacts the other known variables.
The next lessons are
Still stuck?
At Third Space Learning, we specialize in helping teachers and school leaders to provide personalized math support for more of their students through high-quality, online one-on-one math tutoring delivered by subject experts.
Each week, our tutors support thousands of students who are at risk of not meeting their grade-level expectations, and help accelerate their progress and boost their confidence.

Find out how we can help your students achieve success with our math tutoring programs.
[FREE] Common Core Practice Tests (3rd to 8th Grade)
Prepare for math tests in your state with these 3rd Grade to 8th Grade practice assessments for Common Core and state equivalents.
Get your 6 multiple choice practice tests with detailed answers to support test prep, created by US math teachers for US math teachers!