High Impact Tutoring Built By Math Experts
Personalized standards-aligned one-on-one math tutoring for schools and districts
In order to access this I need to be confident with:
Adding and subtracting Integers Multiplying and dividing Integers Integers Coordinate PlanePlot points on a graph
Here you will learn about plotting points on a graph, including how to identify the quadrant or axis the points are on. You will also learn how to find the distance between points on the coordinate plane.
Students first learn how to plot points in the 6th grade with their work in the number system and expand that knowledge through middle school and high school when graphing linear equations.
What is plot points on a graph?
To plot points on a graph means to graph points on the coordinate plane where the point, also called an ordered pair, is in the form of (x,y).
When plotting a point on a graph, always start from the center, which is called the origin and has coordinates (0, 0).
Then move horizontally the amount of units represented by the x -coordinate, and move vertically the amount of units represented by the y -coordinate. The x -coordinate and the y -coordinate are represented by rational numbers.

For example, let’s plot the points (0, 2) and (4, 0) on the coordinate plane.
(0, 2) → 0 represents the x -coordinate and 2 represents the y -coordinate.
This means you do not move left or right on the x -axis, you just move up 2 places on the y -axis. This point is on the y -axis.
(4, 0) → 4 represents the x -coordinate and 0 represents the y -coordinate.
This means that you move four units right on the x -axis and 0 units up on the y -axis. This point is on the x -axis.
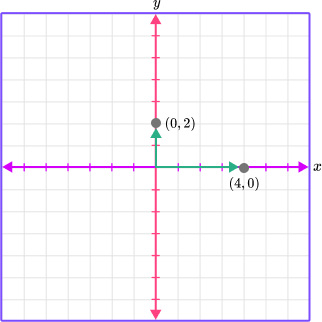
On this graph, each unit or tick mark represents 1 unit.
For example, the table represents coordinates. Let’s plot them on the coordinate plane.
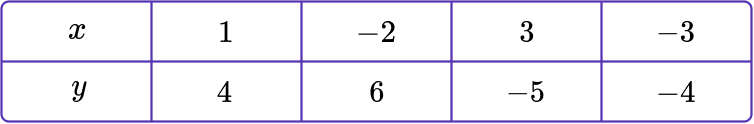

Notice how each of the points lands in one of the four quadrants on the coordinate plane. Each unit on this coordinate plane represents 1 unit.
- (1, 4) is in Quadrant I because both the x and y coordinates are positive.
- (-2, 6) is in Quadrant II because the x -coordinate is negative and the y -coordinate is positive.
- (-3, -4) is in Quadrant III because both the x and y coordinates are negative.
- (3, -5) is in Quadrant IV because the x -coordinate is positive and the y -coordinate is negative.
![[FREE] Plot Points on a Graph Worksheet (Grade 6)](https://thirdspacelearning.com/wp-content/uploads/2024/04/Plot-Points-on-a-Graph-Worksheet-listing-image.png)
[FREE] Plot Points on a Graph Worksheet (Grade 6)
Use this worksheet to check your 6th grade students’ understanding of plotting points on a graph. 15 questions with answers to identify areas of strength and support!
DOWNLOAD FREE [FREE] Plot Points on a Graph Worksheet (Grade 6)
Use this worksheet to check your 6th grade students’ understanding of plotting points on a graph. 15 questions with answers to identify areas of strength and support!
DOWNLOAD FREEDistance between points on a graph
We can find the distance between two points on a graph by counting the number of units between the points.
For example,
Plot the point A \, (-4, 4) and the point B \, (3, 4). Find the distance between the points.
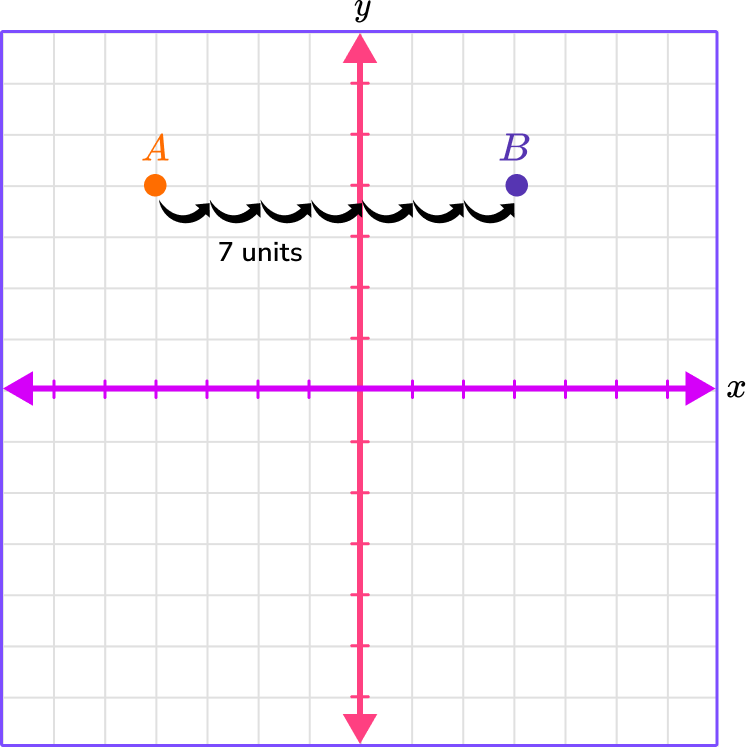
To find the distance from point A to point B , count the number of units. The distance from point A to point B is 7 units.
For example,
Let’s plot the polygon on the coordinate plane with vertices at A \, (4, 2), B \, (4,-3), C \, (-2, -3) , and D \, (-2, 2) .
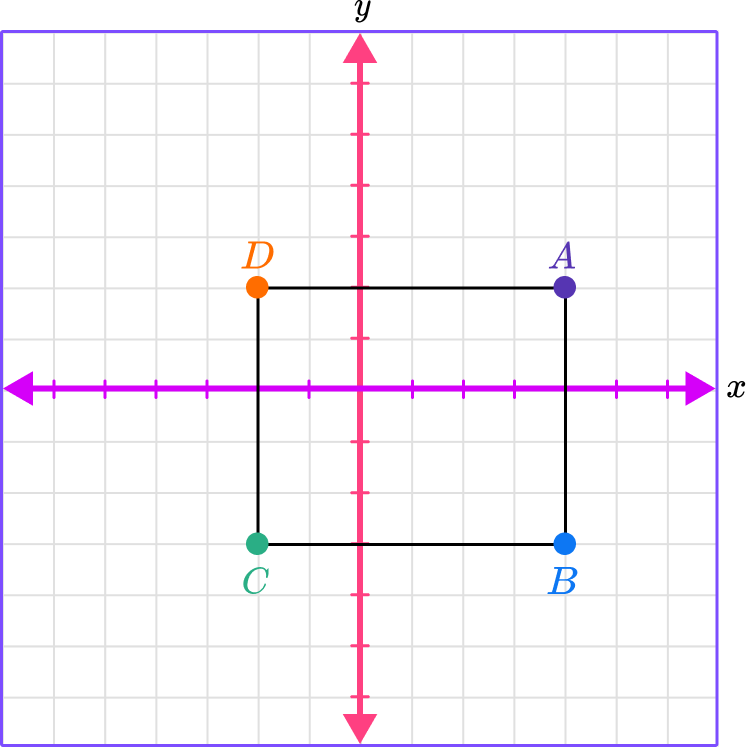
Let’s find the side lengths of the plotted rectangle. To do this, count the number of units from one point to the next.
The distance from point A to point B is 5 units.
The distance from point A to point D is 6 units.
The distance from point D to point C is 5 units.
The distance from point C to point B is 6 units.
The distance between points is always positive because distance is a positive measurement.
Now that you know the side lengths, you can find the perimeter of the rectangle ABCD.
To find the perimeter of a rectangle, add up each of the side lengths or use the formula, P=2l + 2w
The perimeter of rectangle ABCD is 5 + 5 + 6 + 6 = 22 units OR 2 \, (6) + 2 \, (5) = 22 units
What is plot points on a graph?

Common Core State Standards
How does this relate to 6th grade math?
- Grade 6 – Number System (6.NS.C.6.b)
Understand signs of numbers in ordered pairs as indicating locations in quadrants of the coordinate plane; recognize that when two ordered pairs differ only by signs, the locations of the points are related by reflections across one or both axes.
- Grade 6 – Expressions and Equations (6.EE.C.9)
Use variables to represent two quantities in a real-world problem that change in relationship to one another; write an equation to express one quantity, thought of as the dependent variable, in terms of the other quantity, thought of as the independent variable. Analyze the relationship between the dependent and independent variables using graphs and tables, and relate these to the equation.
- Grade 6 – Geometry (6.G.A.3)
Draw polygons in the coordinate plane given coordinates for the vertices; use coordinates to find the length of a side joining points with the same first coordinate or the same second coordinate. Apply these techniques in the context of solving real-world and mathematical problems.
How to plot points on a graph
In order to plot points on a graph:
- Identify the horizontal ( \textbf{x} -value) and vertical position ( \textbf{y} -value) of the ordered pair.
- Follow the gridlines until the two values meet and draw a point.
- Identify which axis or quadrant the point(s) is in.
In order to find the distance between points on a graph:
- Identify the horizontal ( \textbf{x} -value) and vertical position ( \textbf{y} -value) of the ordered pair.
- Follow the gridlines until the two values meet and draw a point.
- Connect the points.
- Count the units between the points.
Plot points on a graph examples
Example 1: plot a point on a graph that lands on the x -axis
Plot the point (6, 0) .
- Identify the horizontal ( \textbf{x} -value) and vertical position ( \textbf{y} -value) of the ordered pair.
The x -coordinate is 6 which means to move right 6 spaces.
The y -coordinate is 0 which means there is no movement up or down.
2Follow the gridlines until the two values meet and draw a point.
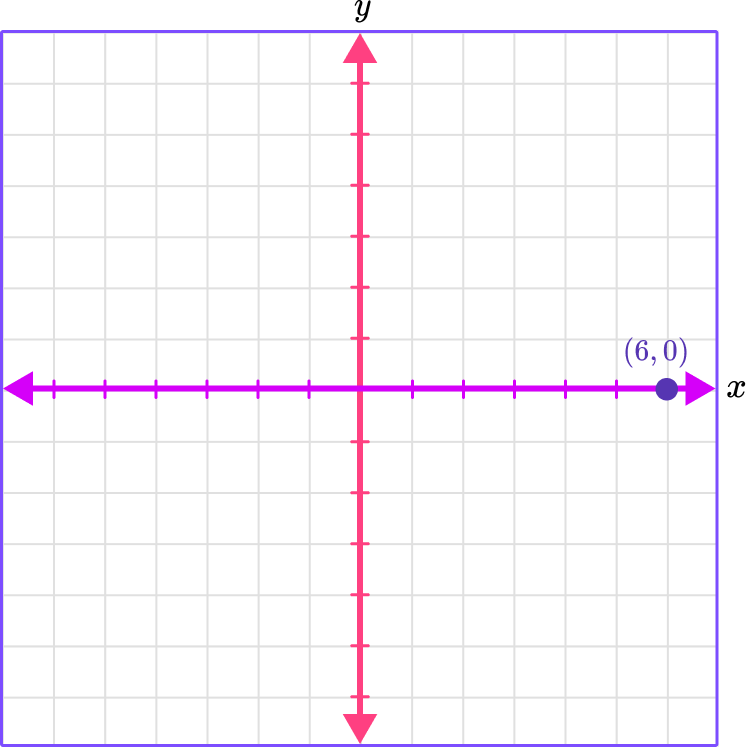
3Identify which axis or quadrant the point(s) is in.
(6, 0) is on the x -axis.
Example 2: plot a point on a graph that lands in a quadrant
Plot the point (-2, 5).
The x -coordinate is -2 which means to move 2 spaces left.
The y -coordinate is 5 which means to move 5 spaces up.
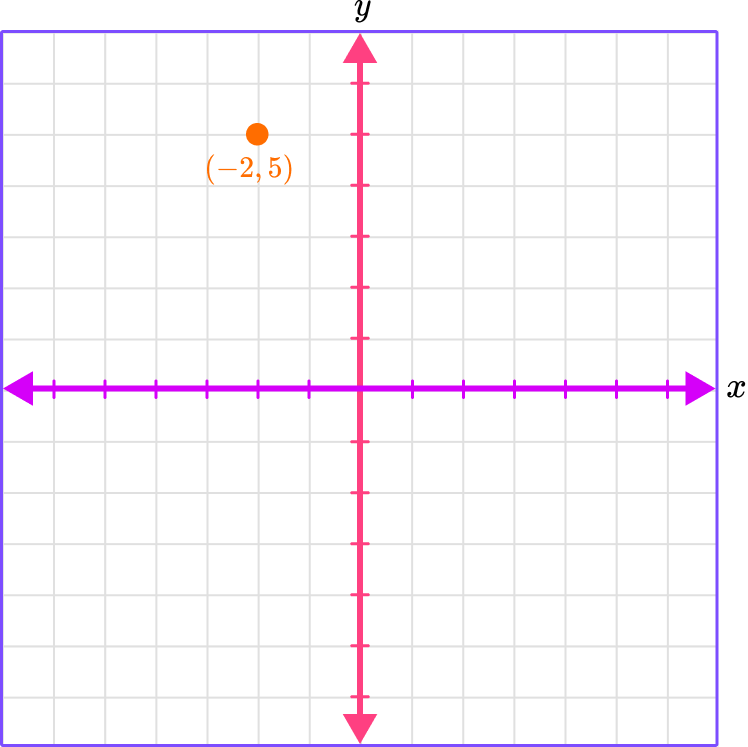
(-2, 5) is in Quadrant II.
Example 3: plot a point on a graph
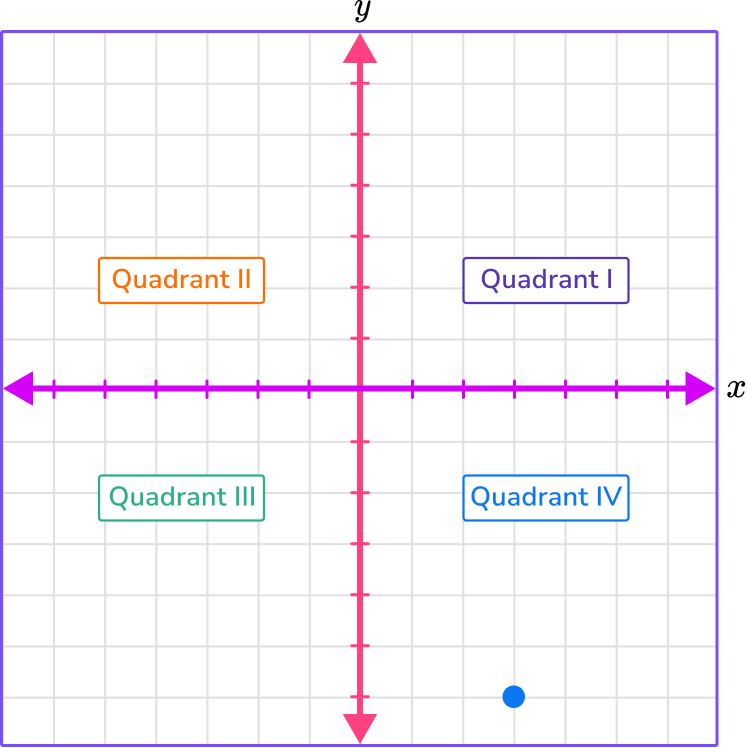
Plot the point (1, -2).
The x -coordinate is 1 which means to move one space right.
The y -coordinate is -2 which means to move two spaces down.
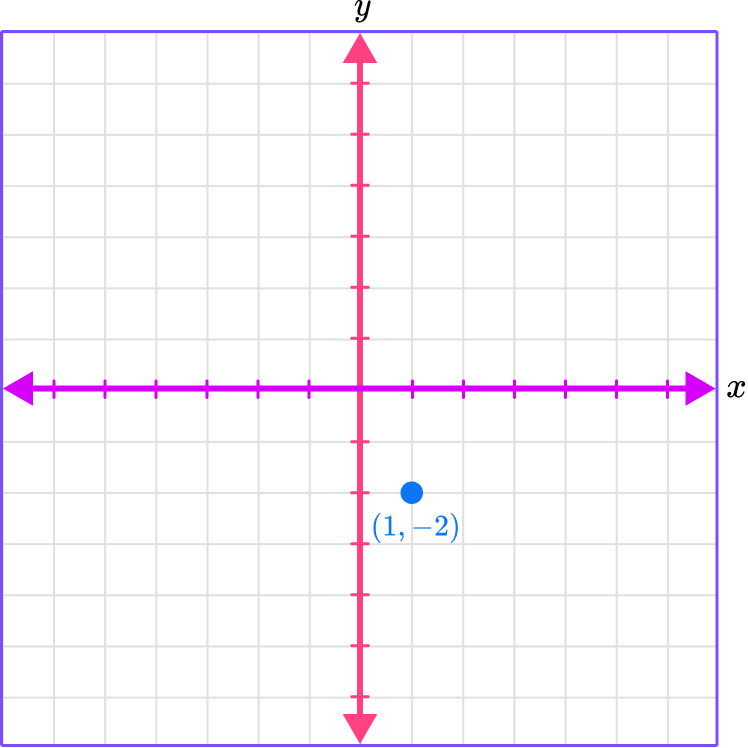
(1, -2) is in Quadrant IV.
Example 4: plot points and find the distance between them
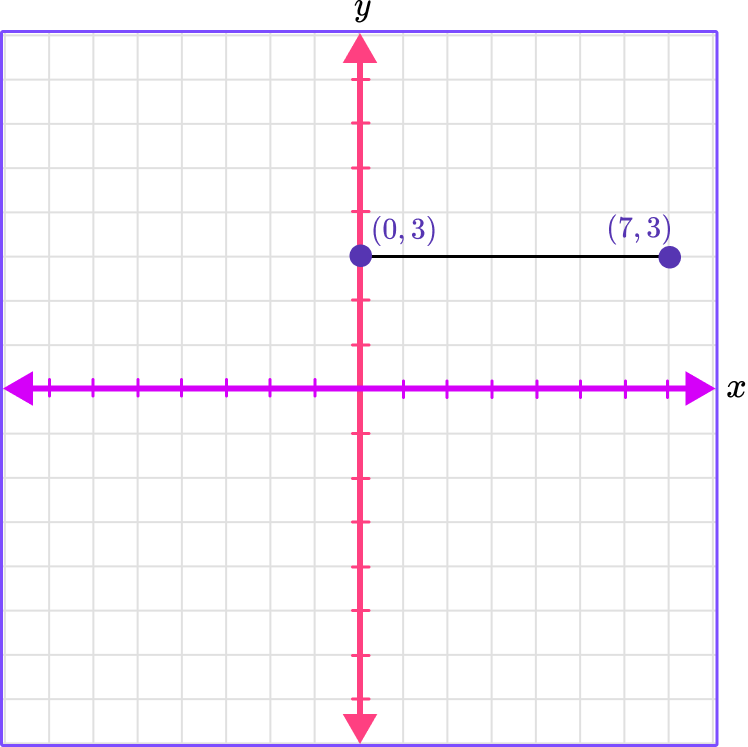
Plot the points (0, 3) and (7, 3) and find the distance between them.
(0, 3)
The x -coordinate is 0 which means there is no movement right or left.
The y -coordinate is 3 which means to move up 3 spaces.
(7, 3)
The x -coordinate is 7 which means to move right 7 spaces.
The y -coordinate is 3 which means to move up 3 spaces.
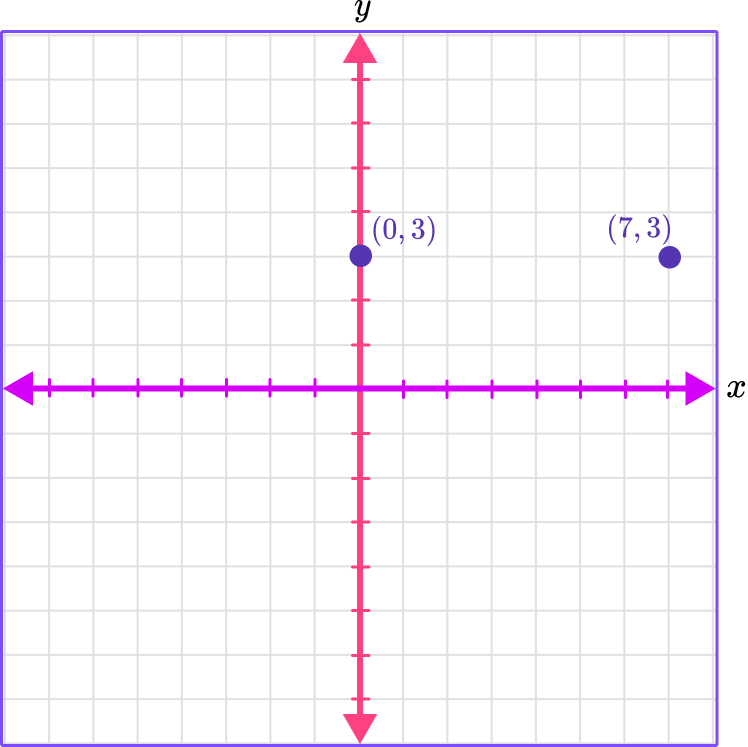
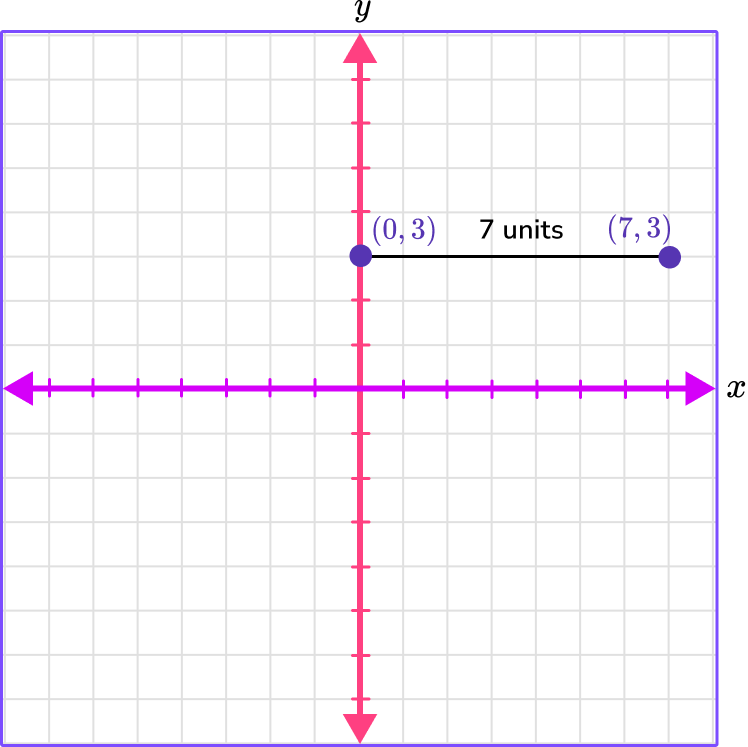
There are 7 spaces (units) between (0,3) and (7, 3) so the distance between them is 7 units.
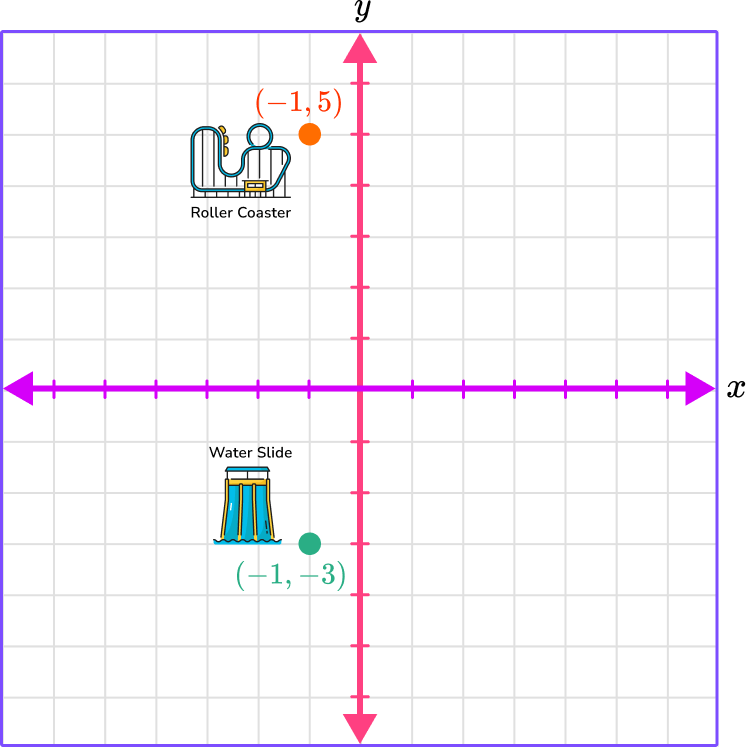
Example 5: plot points and find the distance between them
On a map of an amusement park, the roller coaster is at coordinate (-1, 5) and the water slide is at coordinate (-1, 3).
On the map, how many units is the roller coaster for the water slide?
(-1, 5)
The x -coordinate is -1 which means to move left 1 space.
The y -coordinate is 5 which means to move up 5 spaces.
(-1, -3)
The x -coordinate is -1 which means to move left 1 space.
The y -coordinate is -3 which means to move down 3 spaces.
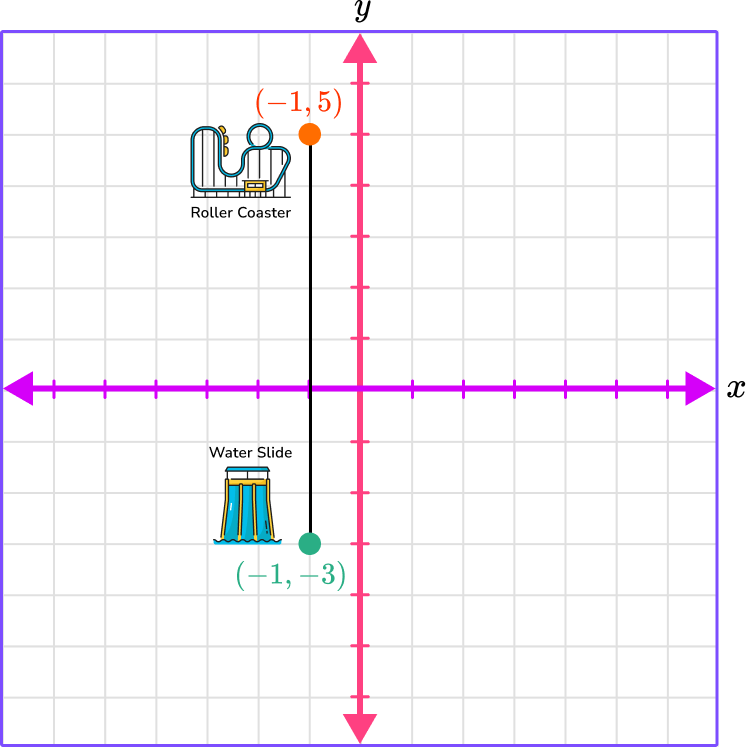
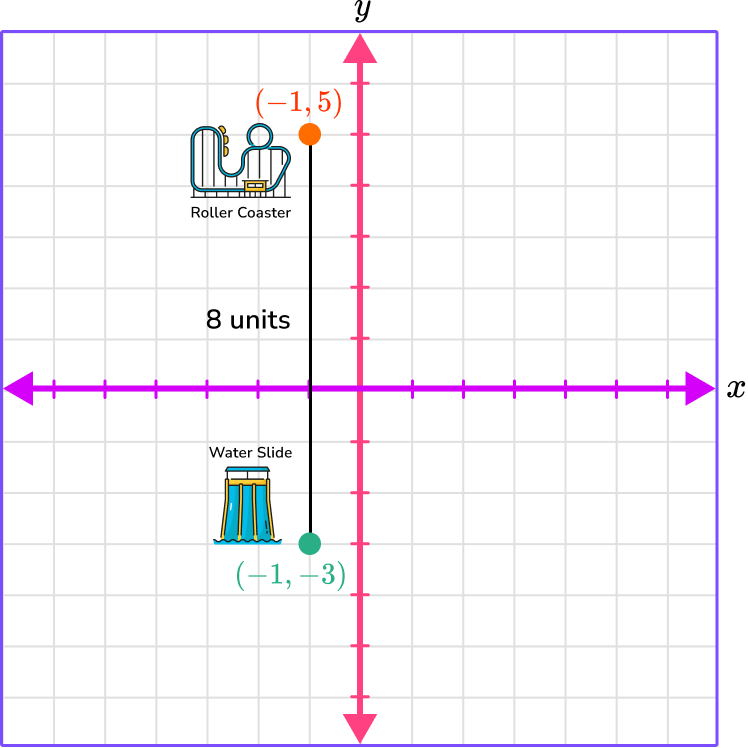
There are 8 spaces (units) between (-1, -3) and (-1, 5). The distance between the points is 8 units.
So the distance between the roller coaster and the water slide on the map is 8 units.
Example 6: plot points on the graph and find the perimeter of polygon
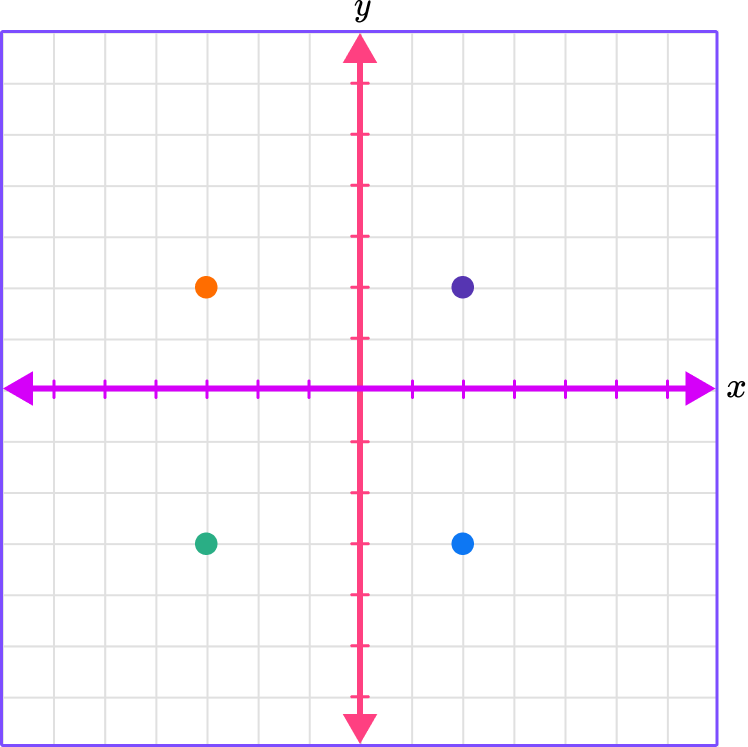
Plot the points A \, (-3, 2), B \, (2, 2), C \, (2, -3), D \, (-3, -3). Find the perimeter of the rectangle.
A \, (-3, 2)
The x -coordinate is -3 which means to move left 3 spaces.
The y -coordinate is 2 which means to move up 2 spaces.
B \, (2, 2)
The x -coordinate is 2 which means to move right 2 spaces.
The y -coordinate is 2 which means to move up 2 spaces.
C \, (2, -3)
The x -coordinate is 2 which means to move right 2 spaces.
The y -coordinate is -3 which means to move down 3 spaces.
D \, (-3, -3)
The x -coordinate is -3 which means to move left 3 spaces.
The y -coordinate is -3 which means to move down 3 spaces.
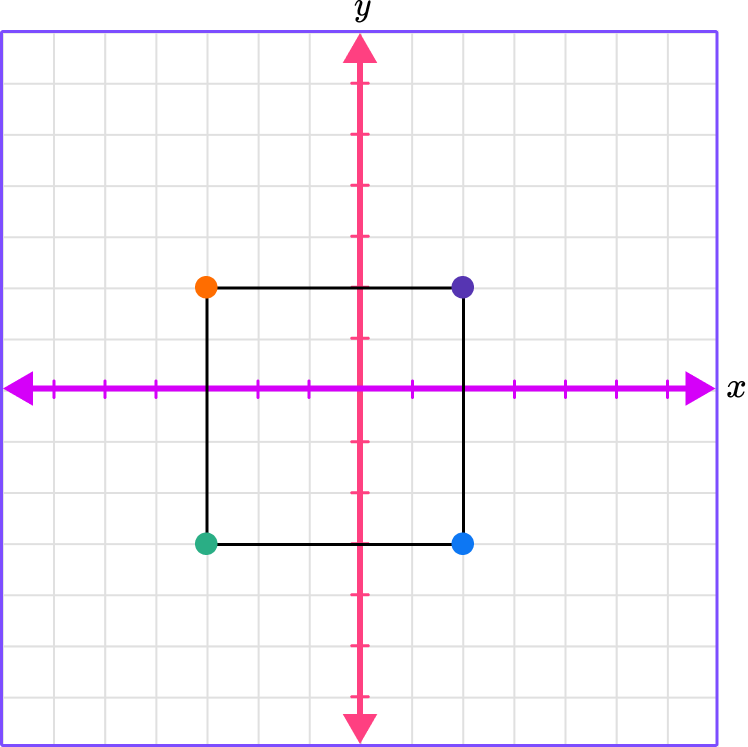
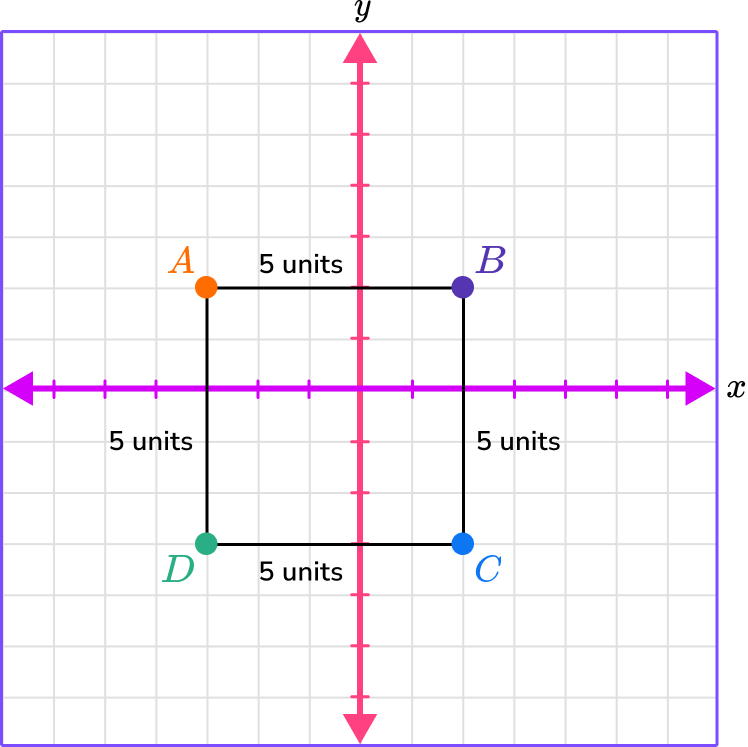
There are 5 spaces between each of the points which means the distance from point to point is 5 units.
To find the perimeter, add up the lengths.
5+5+5+5 = 20.
Teaching tips for plot points on the coordinate plane
- Worksheets play an important role when students are learning to plot on a coordinate plane, but they are not the only option. There are digital coordinate planes available where students can easily change the scale and explore grids with very small or very large scales that would be harder to represent on paper. You can also utilize a tiled floor or wall to create a physical version of the coordinate plane within the classroom.
- Coordinate planes have many practical uses in the real world as well as in the art world. Incorporating projects where students can be creative with plotting points on the coordinate plane helps them to see their usefulness.
- Expose students to digital resources which can enhance the learning experience, such as using the free Desmos graphing calculator to plot points and find the distance between the points instead of doing it by hand with graph paper.
Easy mistakes to make
- Mixing up the values of an ordered pair
For example, plotting the point (9, 2) as the point (2, 9).
- Numbering or counting the spaces between the gridlines incorrectly
For example, not using a consistent way of counting the gridlines. Each space should represent an equal amount. Starting from the origin, count with consistency to the right and left. If you count 1 unit to the right, then you must count 1 unit left.
- Forgetting to use parentheses and a comma
The parentheses and the comma are necessary when writing a coordinate. Coordinates can be incorrectly written as 4,2 without the parentheses, this is just a list of numbers; (4,2) is a coordinate.
Related coordinate plane lessons
Practice plot points on a graph questions
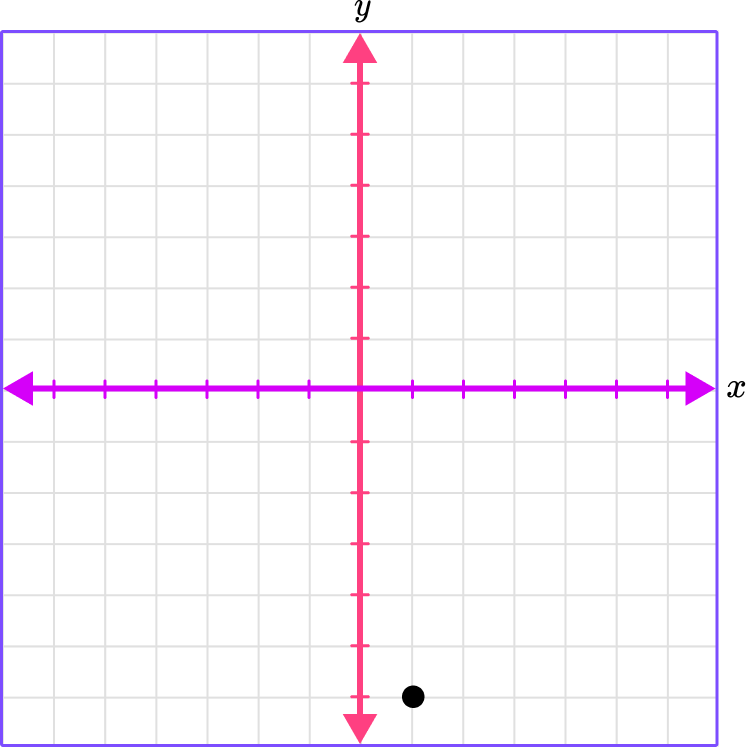
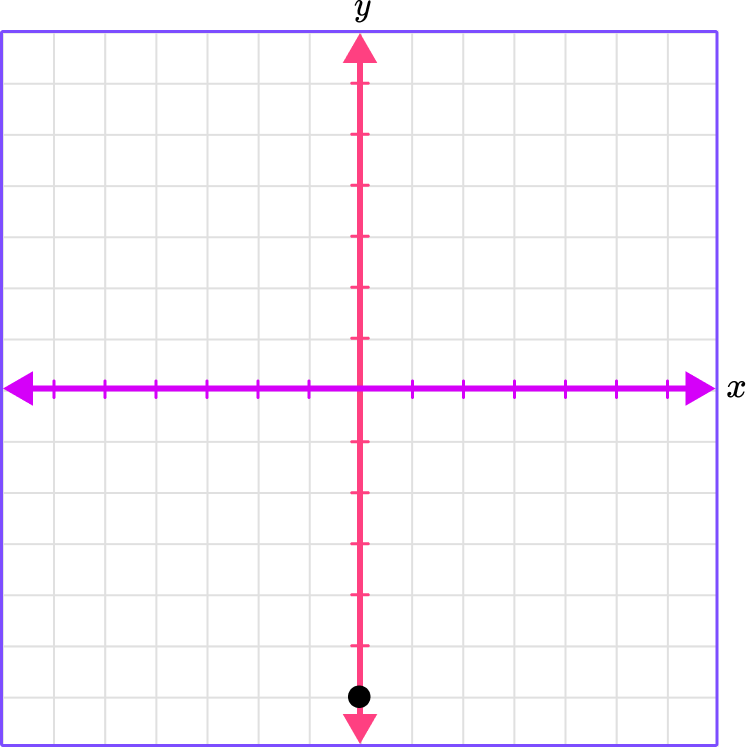
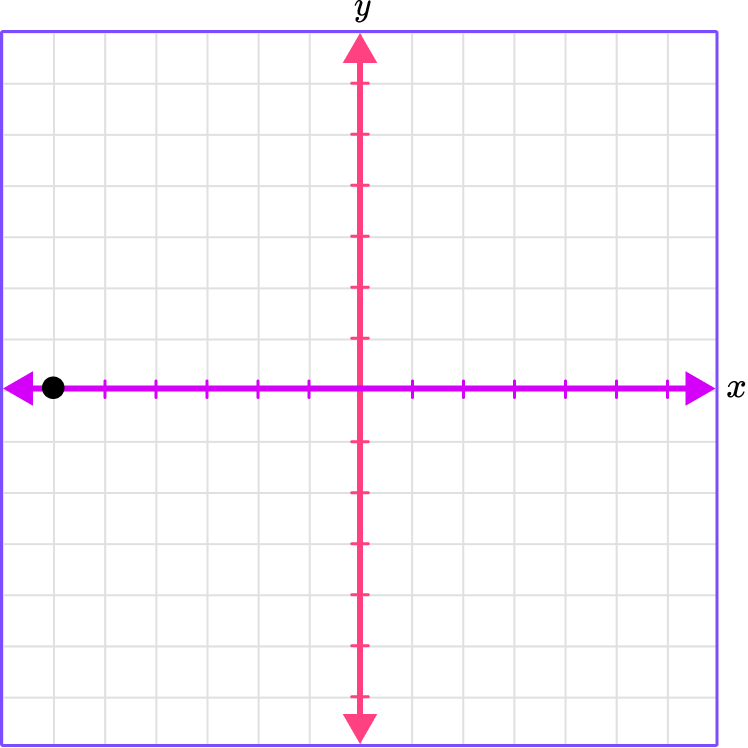
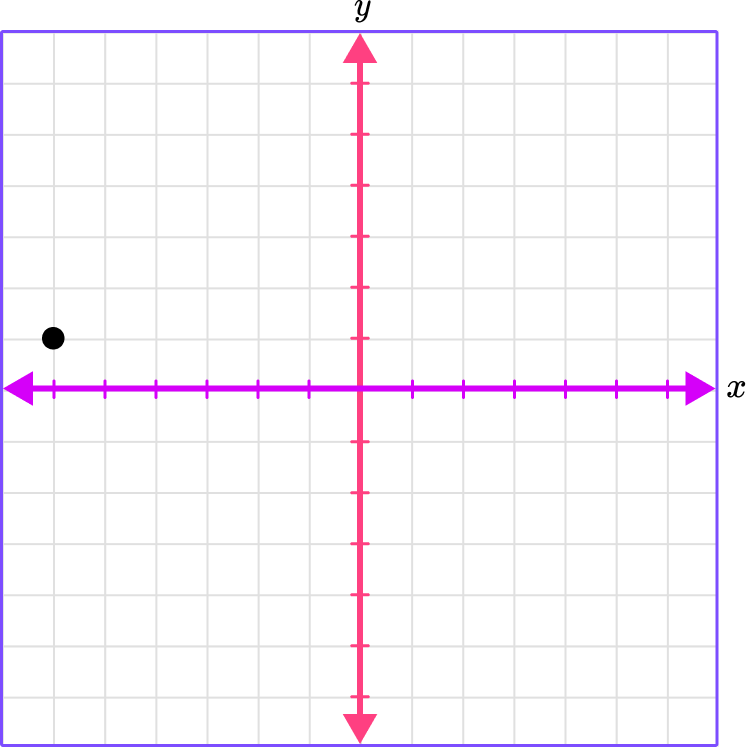
1. Which graph shows the plotted point (0, 4)?
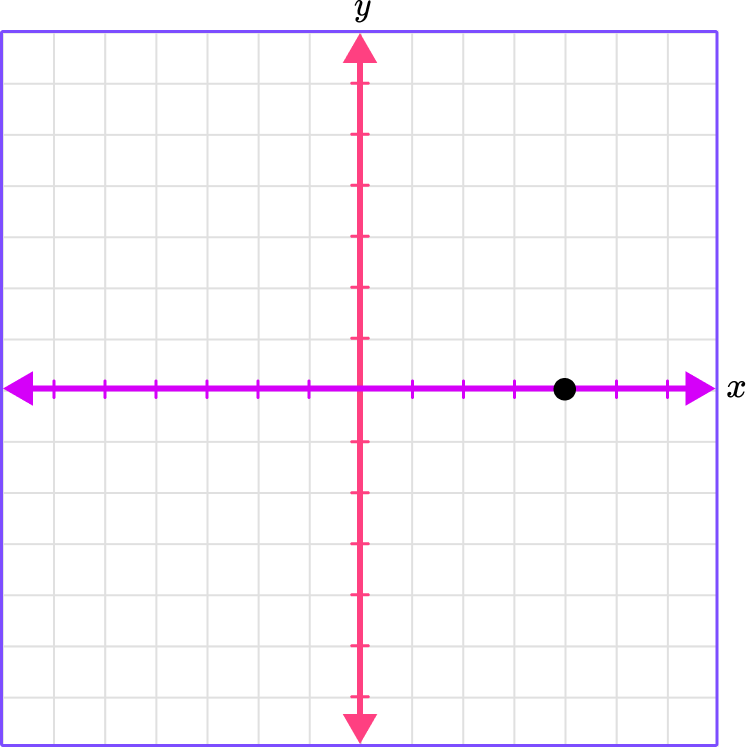

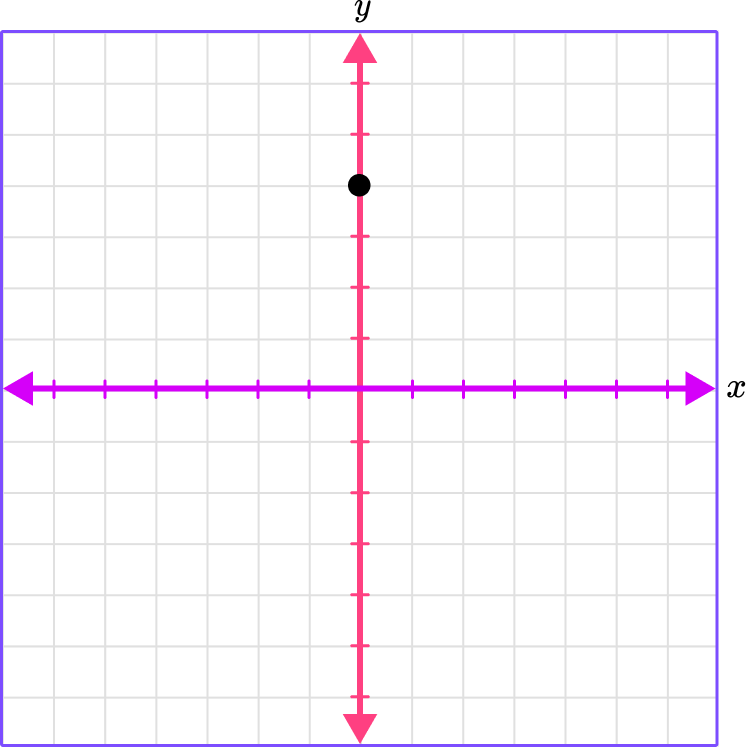

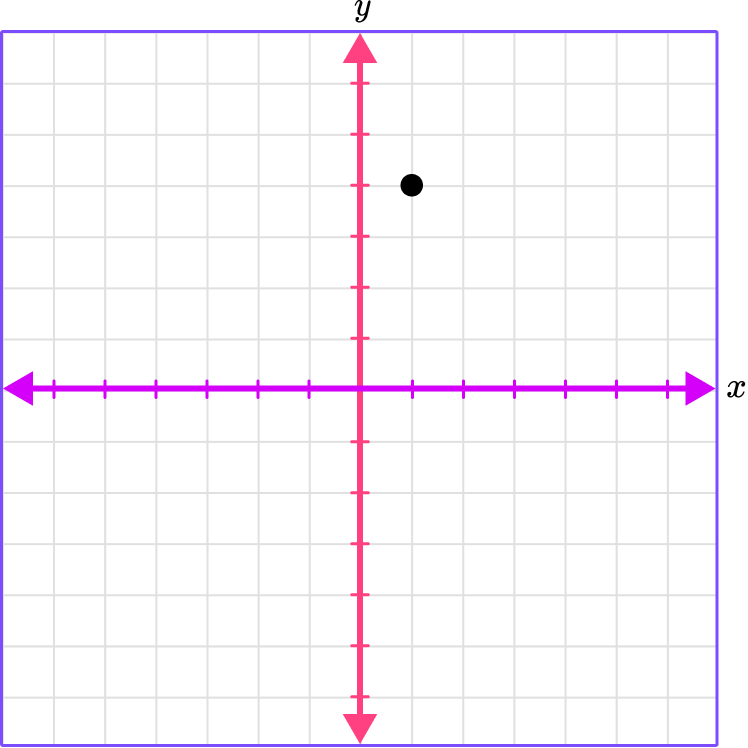
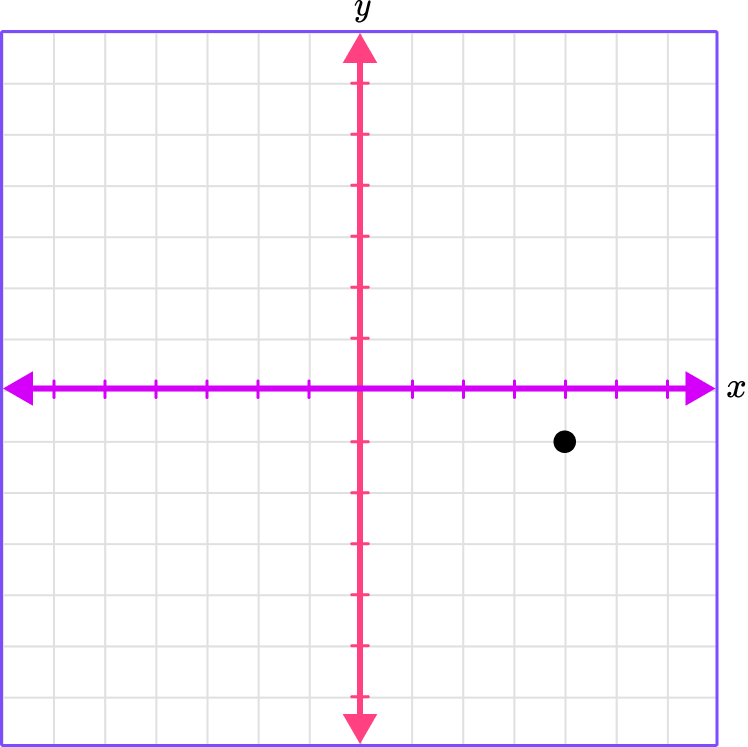
(0, 4)
The x -coordinate is 0 , which means there is no movement right or left.
The y -coordinate is 4 , which means move 4 spaces up.
Place a point where the gridlines meet.
2. Which graph shows the plotted point (-6, 1)?
(-6, 1)
The x -coordinate is -6 , which means to move 6 spaces left.
The y -coordinate is 1 , which means to move 1 space up.
Place a point where the gridlines meet.
3. Which quadrant is (3, -6) in?
Quadrant I
Quadrant II
Quadrant III
Quadrant IV
The x -coordinate is 3 , which means move 3 spaces right.
The y -coordinate is -6 , which means move 6 spaces down.
Where the gridlines meet, place the point.
The x -coordinate is positive and the y -coordinate is negative, which is in Quadrant IV.
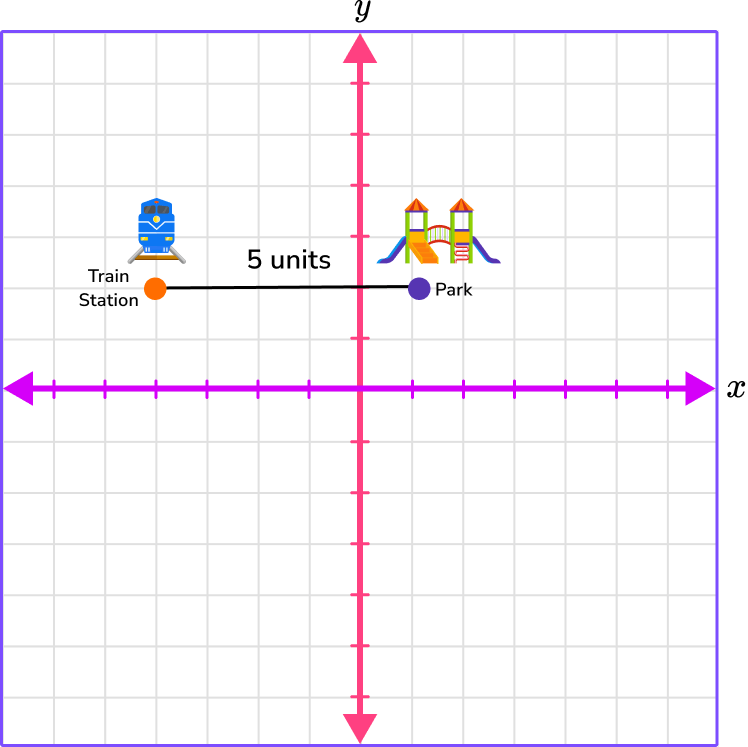
4. On map of city, the train station is at the coordinate (-4, 2) and the park is at the coordinate (1, 2) . If each unit on the map is a city block, how many city blocks are there between the train station and the park?
6 city blocks between the train station and the park
5 city blocks between the train station and the park
1 city block between the train station and the park
7 city blocks between the train station and the park
Plot the points, connect the points, and count the spaces between the points.
(-4, 2)
The x -coordinate is -4 , which is 4 spaces left.
The y -coordinate is 2 , which is 2 spaces up.
(1, 2)
The x -coordinate is 1 , which is 1 space right.
The y -coordinate is 2 , which is 2 spaces up.
Counting the spaces, there is 5 spaces between the two points, which means there is 5 units or 5 city blocks between the train station and the park.
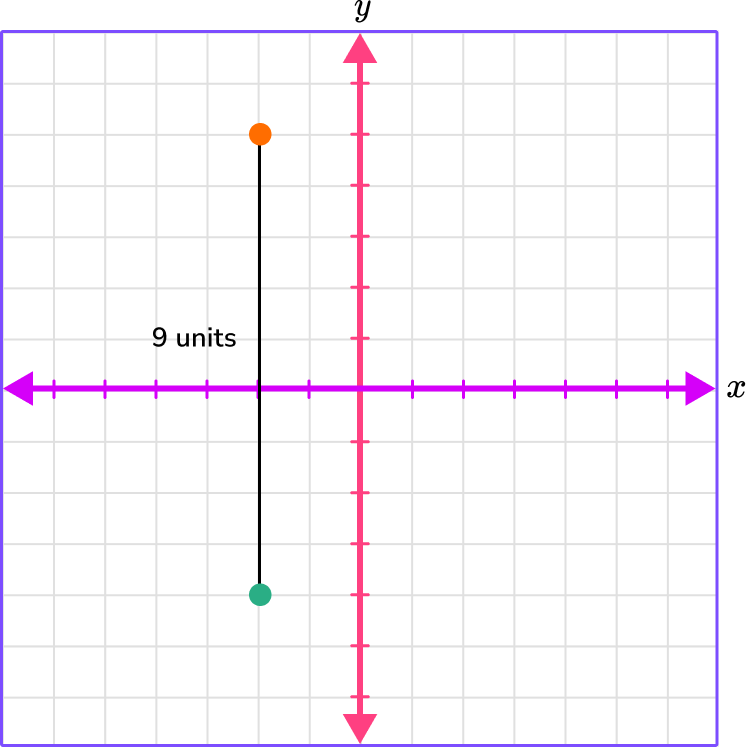
5. What is the distance between the points (-2, 5) and (-2, -4)?
9 units
8 units
6 units
7 units
Plot the points, connect the points, and count the spaces between the points.
(-2, 5)
The x -coordinate is -2 , which is 2 spaces left.
The y -coordinate is 5 , which is 5 spaces up.
(-2, -4)
The x -coordinate is -2 , which is 2 spaces left.
The y -coordinate is -4 , which is 4 spaces down.
Counting the spaces, there are 9 spaces or 9 units between the points.
6. What is the perimeter of the rectangle with the following points?
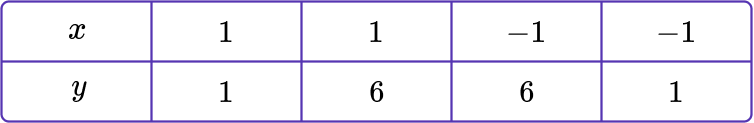
A \, (1, 1), B \, (1, 6), C \, (-1, 6), D \, (-1, 1)?
10 units
7 units
12 units
14 units
Plot the points.
A \, (1, 1)
The x -coordinate is 1 , which is 1 space right.
The y -coordinate is 1 , which is 1 space up.
B \, (1, 6)
The x -coordinate is 1 , which is 1 space right.
The y -coordinate is 6 , which is 6 spaces up.
C \, (-1, 6)
The x -coordinate is -1 , which is 1 space left.
The y -coordinate is 6 , which is 6 spaces up.
D \, (-1, 1)
The x -coordinate is -1 , which is 1 space left.
The y -coordinate is 1 , which is 1 space up.
Connect the points and count the spaces from point to point. Count the spaces or units between each of the points.
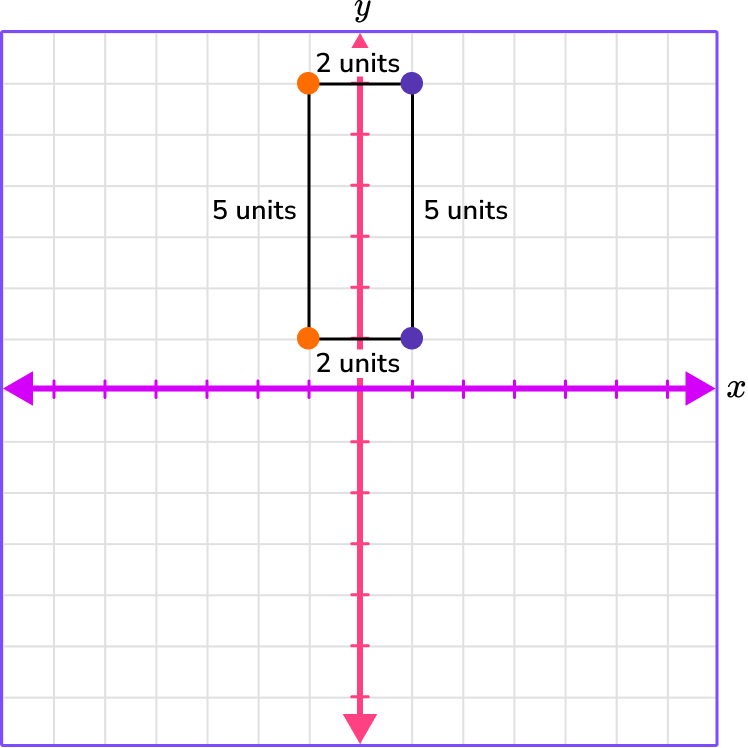
Add the units from point to point to find the perimeter.
2 + 2 + 5 + 5 = 14 units.
The perimeter is 14 units.
Plot points on a graph FAQs
This is the same as a coordinate plane. This name refers to the French mathematician Rene Descartes who is credited with incorporating the use of the coordinate plane into mathematics.
Coordinate planes have many uses in the real world and come up extensively in upper level math topics like coordinate geometry, algebra, trigonometry, and statistics.
Yes, an ordered pair can be any rational number.
Linear equations are equations that form straight lines on the coordinate plane, and quadratic equations form curves called parabolas on the coordinate plane. You will begin to graph linear equations in the 7th grade.
The coordinate grid is another name for the coordinate plane.
The next lessons are
Still stuck?
At Third Space Learning, we specialize in helping teachers and school leaders to provide personalized math support for more of their students through high-quality, online one-on-one math tutoring delivered by subject experts.
Each week, our tutors support thousands of students who are at risk of not meeting their grade-level expectations, and help accelerate their progress and boost their confidence.

Find out how we can help your students achieve success with our math tutoring programs.
[FREE] Common Core Practice Tests (3rd to 8th Grade)
Prepare for math tests in your state with these 3rd Grade to 8th Grade practice assessments for Common Core and state equivalents.
Get your 6 multiple choice practice tests with detailed answers to support test prep, created by US math teachers for US math teachers!