High Impact Tutoring Built By Math Experts
Personalized standards-aligned one-on-one math tutoring for schools and districts
Interpreting graphs
Here you will learn about interpreting graphs, including how to plot graphs, how to recognize different graphs, the key features of a graph, as well as sketching and transforming graphs.
Students first learn about graphing on the coordinate plane in 6th grade with their work with expressions and equations. They expand this knowledge to graphing linear and non-linear functions in middle school and high school.
What is interpreting graphs?
Interpreting graphs covers the skills of plotting and sketching graphs and identifying the key features of graphs.
Different types of graphs have specific shapes, and we can recognize the type of graph based on its shape.
Linear graphs
Linear graphs produce a straight line, let’s look at some examples:
| Linear Graph |
|---|
 Select values for x and substitute into the equation to find y. 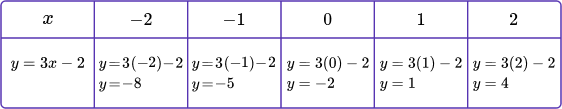 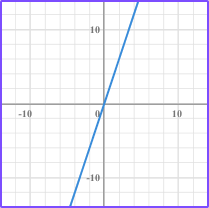 variation which is a proportional relationship. The constant of variation, k, is positive 3. The line also passes through the origin. |
 Select values for x and substitute into the equation to find y. 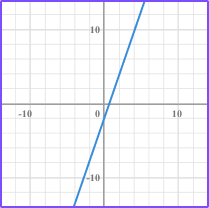 variation which is a proportional relationship. The constant of variation, k, is positive 3. The line also passes through the origin. |
 Select values for x and substitute into the equation to find y. it does not represent a proportional relationship. The line does not pass through the origin. |
Special cases of linear graphs \hspace{1.7cm}
| Vertical line: x=1 The x value is the same for any y value. 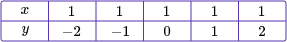 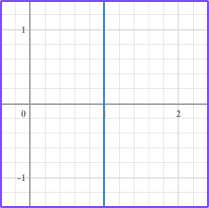 is always a vertical line. | Horizontal line: y=1 The y value is the same for any x value. 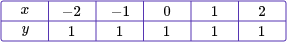 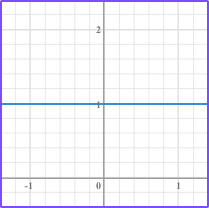 is always a horizontal line. |
You can make a table of values to sketch any type of graph.
![[FREE] Algebra Check for Understanding Quiz (Grade 6 to 8)](https://thirdspacelearning.com/wp-content/uploads/2023/07/Algebra-check-for-understanding-quiz-listing-image-.png)
[FREE] Algebra Check for Understanding Quiz (Grade 6 to 8)
Use this quiz to check your grade 6 – grade 8 students’ understanding of algebra. 10+ questions with answers covering a range of 6th to 8th grade algebra topics to identify areas of strength and support!
DOWNLOAD FREE [FREE] Algebra Check for Understanding Quiz (Grade 6 to 8)
Use this quiz to check your grade 6 – grade 8 students’ understanding of algebra. 10+ questions with answers covering a range of 6th to 8th grade algebra topics to identify areas of strength and support!
DOWNLOAD FREENonlinear graphs
Nonlinear graphs produce graphs in a variety of different shapes, let’s look at some examples:
Nonlinear Graphs \hspace{1.2cm}
Absolute value:
| 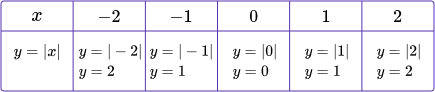 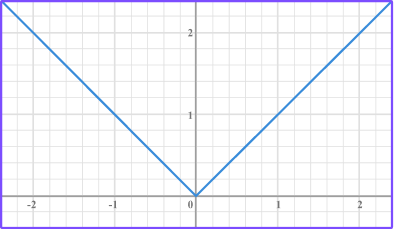 Absolute value graphs are V-shaped
|
Quadratic:
| 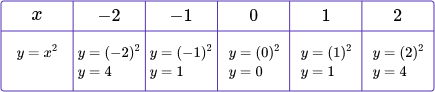 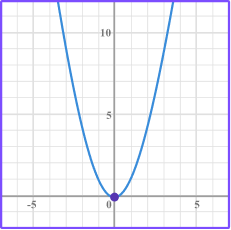 Quadratic graphs are U-shaped.
|
Exponential:
| 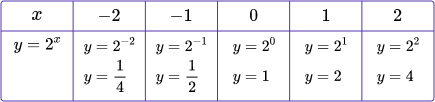 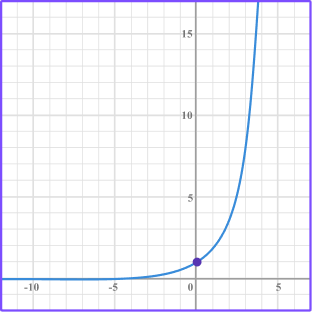 Exponential graphs are curves.
|
Cubic:
| 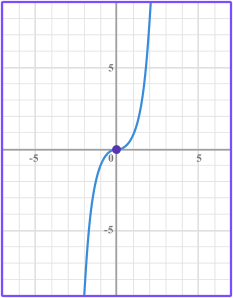 Cubic graphs are curves that look like this.
|
Key features of graphs
- \textbf{y} intercept
The y intercept is the point where the graph crosses the y -axis (vertical axis).
For example, the equation y=2x has a y -intercept of 0 because the line passes through the origin, (0, 0).
Another way to find the y intercept is to substitute 0 in for x into the equation and solve for y. The y value is the y intercept.
The line y=x + 4 has a y intercept of 4, meaning it crosses the y axis at 4.
Substitute 0 for x into the equation and solve it for y.
\begin{aligned} & y=x+4 \\\\ & y=0+4 \\\\ & y=4 \end{aligned}
The y -intercept is 4.
- Slope, gradient or rate of change
The slope (also called gradient) is the ratio of the vertical change and horizontal change between two points on a line. It determines how steep the line is.
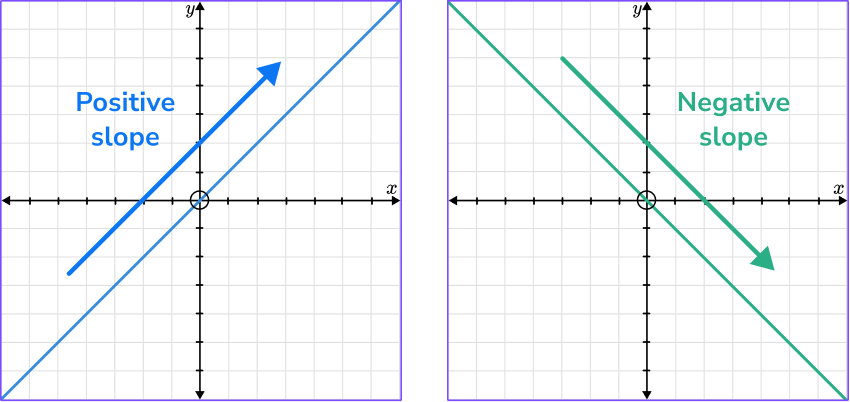
When the line rises to the right it has a positive slope and when the line rises to the left it has a negative slope.
You can find the gradient of a linear graph by counting the vertical change and the horizontal change from one point to another point on a line and write it as a ratio.
\text { Slope }=\cfrac{\text { Change in } y}{\text { Change in } x}
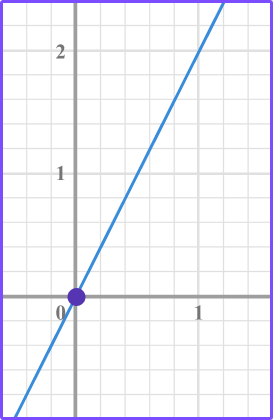
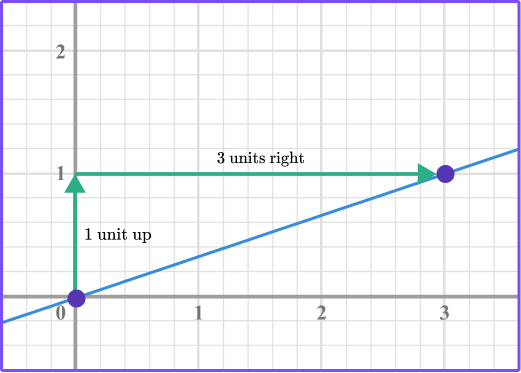
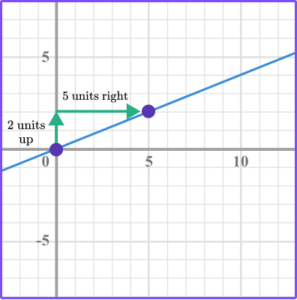
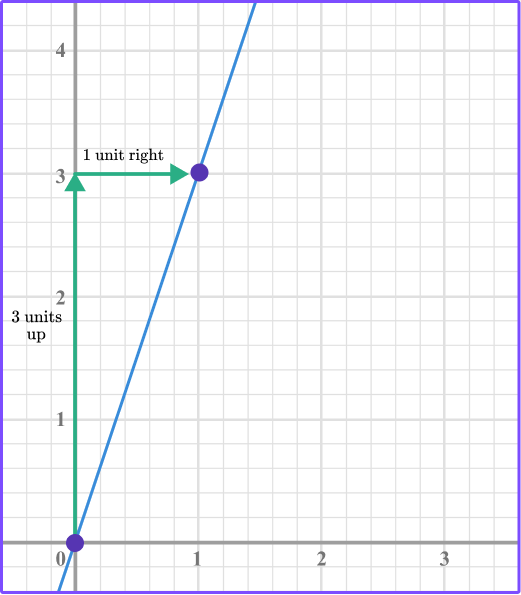
For example, for the equation y=\cfrac{1}{3} \, x , start at the origin (0, 0) and count up and to the right until you get to the point (3, 1).
You can see that it is 1 unit up and 3 units right. The slope is the ratio of the vertical change over the horizontal change,
*Up is a positive direction.
*Down is a negative direction.
*Right is a positive direction.
*Left is a negative direction.
- \textbf{x} intercepts or roots
The x intercepts or roots of a linear graph is the point where the graph crosses the x axis (horizontal axis).
We can find these points by setting y equal to 0 and then solving the equation.
For example, to find the x intercepts or roots of the graph y=x-5, we substitute 0 for y into the equation to find x.
\begin{aligned} & y=x-5 \\\\ & 0=x-5 \\\\ & 0+5=x-5+5 \\\\ & 5=x \text { or } x=5 \end{aligned}
The x intercept is 5.
- Linear equations can be written in the form \textbf{y = mx} or \textbf{y = mx + b}
m = slope
b= y intercept
y=mx → y intercept of 0 because it represents a proportional linear relationship.
y=mx+b → the value of b is the y intercept.
What is interpreting graphs?

Common Core State Standards
How does this relate to 6th grade math, 7th grade math, and 8th grade math?
- Grade 6 Number System (6.NS.C.6.c)
Find and position integers and other rational numbers on a horizontal or vertical number line diagram; find and position pairs of integers and other rational numbers on a coordinate plane.
- Grade 7 – Ratios and Proportional Relationships (7.RP.A.2.b)
Identify the constant of proportionality (unit rate) in tables, graphs, equations, diagrams, and verbal descriptions of proportional relationships.
- Grade 8 – Expressions and Equations (8.EE.B.5)
Graph proportional relationships, interpreting the unit rate as the slope of the graph.
How to interpret graphs
In order to find and interpret the slope of a linear graph:
- Identify two points on the graph.
- Count the vertical movement and horizontal movement from one point to the second point.
- Write the slope.
- Interpret the slope.
In order to find the y intercept of a graph:
- Look for the point where the line crosses the \textbf{y} axis.
- Write the \textbf{y} intercept.
In order to find the y intercept of an equation:
- Substitute a \bf{0} for \textbf{x} into the equation and solve it for \textbf{y} .
- Write the \textbf{y} intercept.
In order to find the x intercept from a linear graph:
- Look for the point where the line crosses the \textbf{x} axis.
- Write the \textbf{x} intercept.
In order to find the x intercept from a linear equation:
- Substitute a \bf{0} for \textbf{y} into the equation and solve it for \textbf{x} .
- Write the \textbf{x} intercept.
- Interpret the \textbf{x} intercept.
Interpreting graphs examples
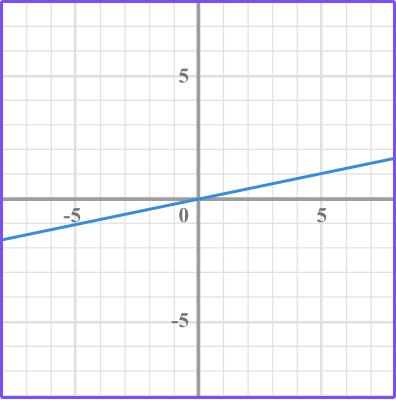
Example 1: find the slope (rate of change)
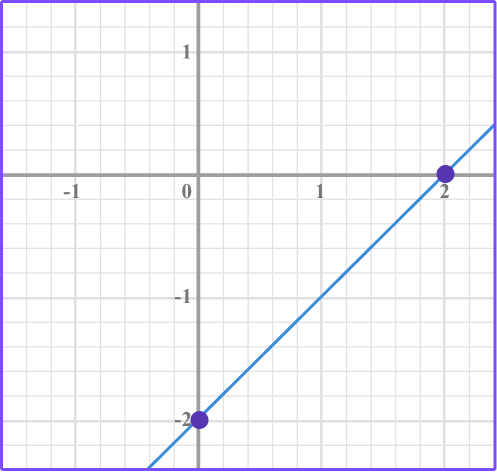
Use the graph to find the rate of change.
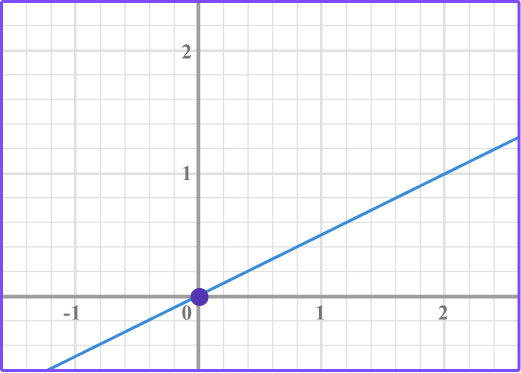
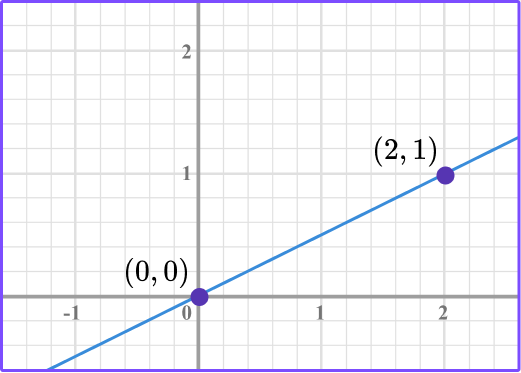
- Identify two points on the graph.
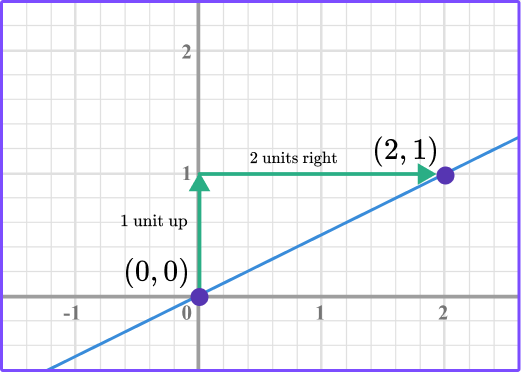
2Count the vertical movement and horizontal movement from one point to the second point.
3Write the slope.
The slope is the ratio, \text { slope }=\cfrac{\text { change in } y}{\text { change in } x} \, .
So in this case, \text { slope }=\cfrac{1}{2}.
4Interpret the slope.
The slope is a ratio of the vertical change over the horizontal change.
So the slope of \cfrac{1}{2} is the vertical change from the point (0, 0) to (2, 1) , which is 1 unit up, and the horizontal change is 2 units right.
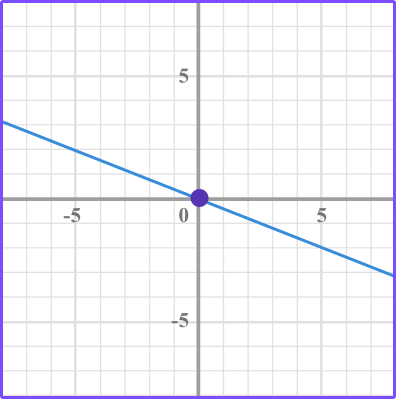
Example 2: find the slope (rate of change)
Use the graph to find the rate of change.
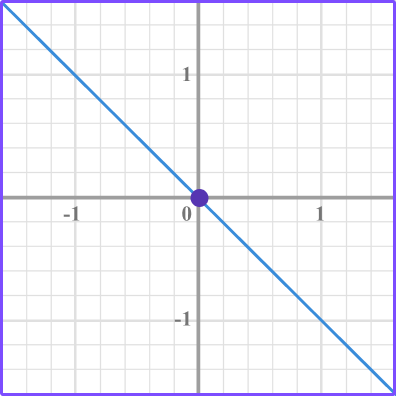
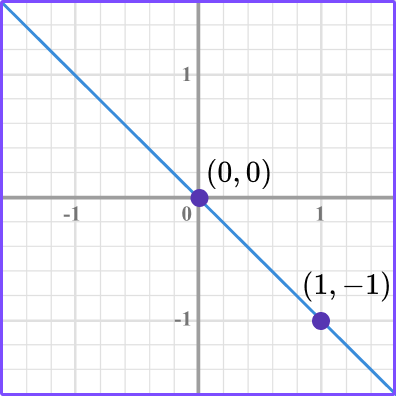
The slope is the ratio, \text { slope }=\cfrac{\text { change in } y}{\text { change in } x} \, .
So in this case, \text { slope }=\cfrac{-1}{1} \, .
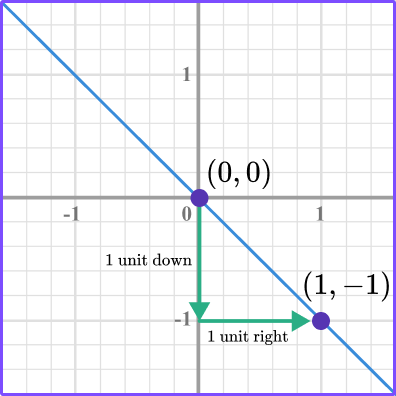
The slope is a ratio of the vertical change over the horizontal change.
So the slope of \, \cfrac{-1}{1} \, is the vertical change from the point (0, 0) to (1, -1) , which is 1 unit down, and the horizontal change is 1 unit right.
Example 3: find the y intercept from a graph
The graph crosses the y axis at 1.
The y intercept is 1.
Example 4: find and interpret the y intercept from an equation
What is the y intercept of y=\cfrac{2}{3} x+2 ?
\begin{aligned} & y=\cfrac{2}{3} \, x+2 \\\\ & y=\cfrac{2}{3} \, (0)+2 \\\\ & y=0+2 \\\\ & y=2 \end{aligned}
The y intercept is 2.
The graph crosses the y axis at positive 2.
Example 5: find the x intercept from a graph
Use the graph to find the x intercept.
The line crosses the x axis at 2.
The x intercept is 2.
Example 6: find the x intercept from an equation
What is the x intercept of y=2x-6 ?
\begin{aligned} & y=2 x-6 \\\\ & 0=2 x-6 \\\\ & 0+6=2 x-6+6 \\\\ & 6=2 x \\\\ & \cfrac{6}{2}=\cfrac{2 x}{2} \\\\ & 3=x \text { or } x=3 \end{aligned}
The x intercept is 3.
The x intercept is where the graph crosses the x axis and is also the root or solution to the equation.
Teaching tips for interpreting graphs
- Use online interactive graphing tools, graphing apps, or a graphing calculator to help students make connections.
- Although worksheets are good for practicing skills, use real world scenarios to help your learners make connections between the key features of a graph and how they relate to the world around them.
- Reinforce that the slope is a ratio of the vertical change over the horizontal change in two points. It’s essential for long term understanding that the slope is a ratio.
Easy mistakes to make
- Confusing when to substitute \bf{0}
For example, substituting 0 in for y when finding the y intercept is incorrect and substituting 0 for x when finding the x intercept is incorrect.
- Mixing up the ratio for slope
For example, writing the ratio for slope as: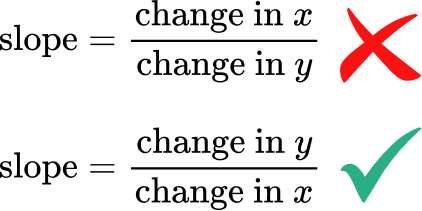
- Confusing the positive or negative slope
Remember that a positive slope rises to the right and a negative slope rises to the left.
Related coordinate plane lessons
Practice interpreting graphs questions
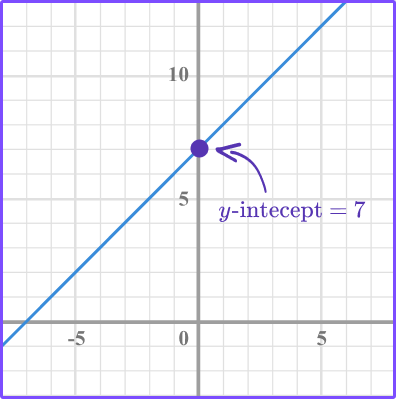
1. Which graph has a y intercept at 7?
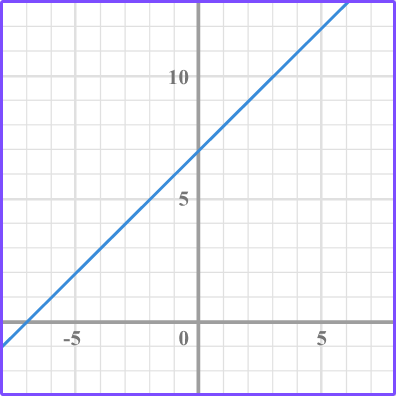


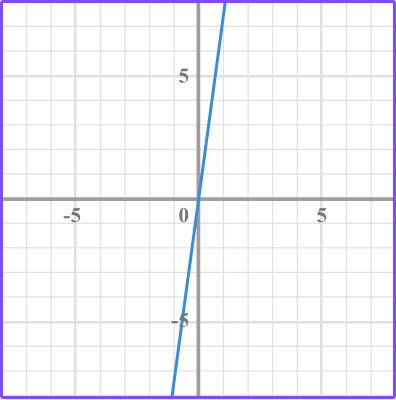
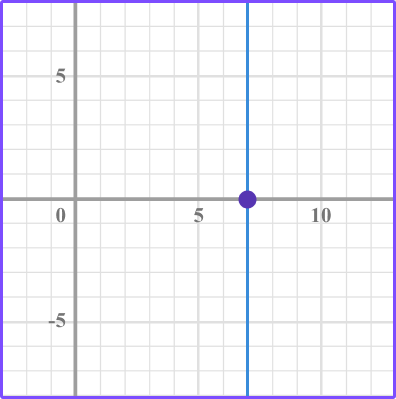
Look to see which of the lines cross the y axis at positive 7.
Where the graph (in this case line) crosses the y axis is the y intercept.
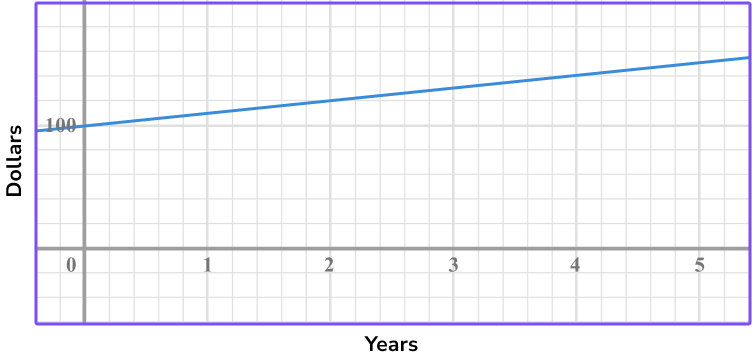
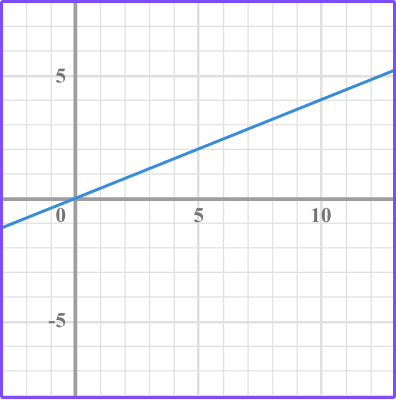
2. Maddie deposits \$100 in a savings account. The graph shows how much money she makes over 5 years. What does the y intercept represent?
The total amount of money she has after 5 years.
The rate of the amount of money she makes each year.
The initial amount of money she deposited into the account.
The amount of money she made in 5 years.
From the graph you can see that the y intercept is 100.
\$100 is the initial amount of money Maddie deposited into the savings account, so the y intercept represents the initial amount of money.
3. Which graph has a slope of \, \cfrac{2}{5} \, ?
The slope is the ratio of the vertical change over the horizontal change between two points.
Identify two points and count the vertical movement and horizontal movement from one point to the next point.
In this case, the \text{slope } = \cfrac{2}{5}
4. What is the x intercept of y = 3x – 9?
Substitute 0 in for y into the equation and solve for x.
\begin{aligned} & y=3 x-9 \\\\ & 0=3 x-9 \\\\ & 0+9=3 x-9+9 \\\\ & 9=3 x \\\\ & \cfrac{9}{3}=\cfrac{3 x}{3} \\\\ & 3=x \end{aligned}
The x intercept is 3.
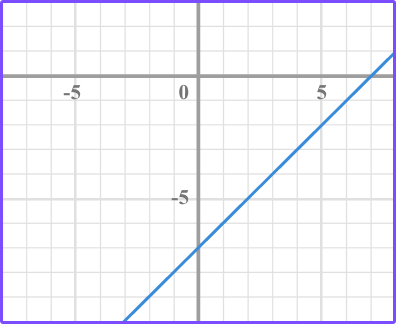
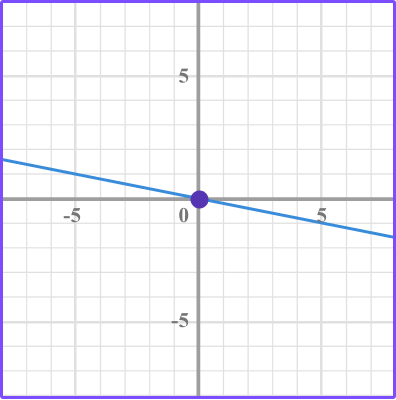
5. What is the slope of this linear graph?
The slope is the ratio of the vertical change over the horizontal change between two points.
Identify two points and count the vertical movement and horizontal movement from one point to the next point.
6. What is the y intercept of y=3x-4?
Substitute 0 in for x and solve for y.
\begin{aligned} & y=3 x-4 \\\\ & y=3(0)-4 \\\\ & y=-4 \end{aligned}
The y intercept is -4.
You can also compare the equation to y=mx+b to determine the value of b.
In this case, b=-4 so the y intercept is -4.
Interpreting graphs FAQs
Yes, think about a vertical line. It has an x -intercept but not a y -intercept.
Function notation is represented by f(x) which can be substituted for y. Equations can be rewritten in function notation. You will learn more about function notation and graphs of functions in algebra.
The slope of a line is a ratio. Ratios are typically written as a fraction but it can also be represented by a decimal number.
The next lessons are
Still stuck?
At Third Space Learning, we specialize in helping teachers and school leaders to provide personalized math support for more of their students through high-quality, online one-on-one math tutoring delivered by subject experts.
Each week, our tutors support thousands of students who are at risk of not meeting their grade-level expectations, and help accelerate their progress and boost their confidence.

Find out how we can help your students achieve success with our math tutoring programs.
[FREE] Common Core Practice Tests (3rd to 8th Grade)
Prepare for math tests in your state with these 3rd Grade to 8th Grade practice assessments for Common Core and state equivalents.
Get your 6 multiple choice practice tests with detailed answers to support test prep, created by US math teachers for US math teachers!