High Impact Tutoring Built By Math Experts
Personalized standards-aligned one-on-one math tutoring for schools and districts
Types of data
Here you will learn about types of data, including, qualitative data, quantitative data, discrete data, and continuous data.
Students first learn to work with data in first grade and expand their knowledge and use of data as they progress through the grades.
What are types of data?
Types of data are collections of information to be sorted and used to understand things.
Data is used in many different ways that are useful.
We need to understand the different types of data that can be collected and the different statistical ways it can be analyzed or interpreted.
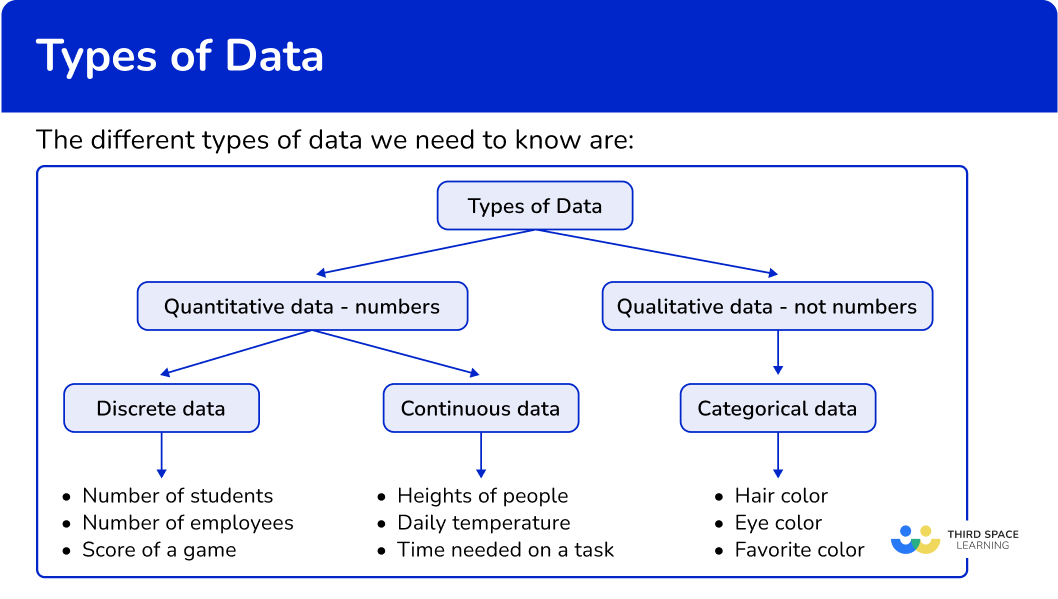
| Quantitative Data: | Qualitative Data: |
|---|---|
This is numerical information that can be counted | This is non-numerical information that describes |
| Types of Quantitative Data: | Types of Qualitative Data: |
|---|---|
● Discrete data – data that is represented by a | ● Categorical data – data that can be grouped |
Step-by-step guide: Qualitative data
Step-by-step guide: Quantitative data
Step-by-step guide: Discrete data
What are types of data?
Common Core State Standards
How does this apply to 6th grade math?
- Grade 6 – Statistics and Probability (6.SP.A.1)
Recognize a statistical question as one that anticipates variability in the data related to the question and accounts for it in the answers. For example, “How old am I?” is not a statistical question, but “How old are the students in my school?” is a statistical question because one anticipates variability in students’ ages.
- Grade 6 – Statistics and Probability (6.SP.B.5)
Summarize numerical data sets in relation to their context, such as by: a. Reporting the number of observations.
![[FREE] Types of Data Check for Understanding (Grade 6 to 7)](https://thirdspacelearning.com/wp-content/uploads/2023/11/Types-of-Data-listing-image.png)
[FREE] Types of Data Check for Understanding (Grade 6 to 7)
Use this quiz to check your grade 6 to grade 7 students’ understanding of types of data. 15+ questions with answers covering a range of 6th and 7th grade types of data topics to identify areas of strength and support!
DOWNLOAD FREE [FREE] Types of Data Check for Understanding (Grade 6 to 7)
Use this quiz to check your grade 6 to grade 7 students’ understanding of types of data. 15+ questions with answers covering a range of 6th and 7th grade types of data topics to identify areas of strength and support!
DOWNLOAD FREEHow to recognize types of data
There are several ways to classify data. For more specific step-by-step guides, check out the pages linked in the “What are types of data?” section above or read through the examples below.
In order to recognize types of data:
- Recall the definition.
- State and explain the type of data.
Types of data examples
Example 1: recognizing types of data
Jill wants to survey her classmates on the types of pets they have. Is this data qualitative or quantitative?
- Recall the definition.
Qualitative data is non-numerical data.
Quantitative data is numerical data.
2State and explain the type of data.
Collecting data on types of pets is not numerical data. It’s data that represents the types of animals her classmates have as pets, so it is qualitative data.
Example 2: recognizing types of data from a frequency graph
Mrs. Summerer’s class is going to do a data project on skittles. The students will gather data to figure out which color skittle is most represented in the bags of skittles that are sold. The bar graph by one student is shown below. Does the bar graph represent categorical data or continuous data?
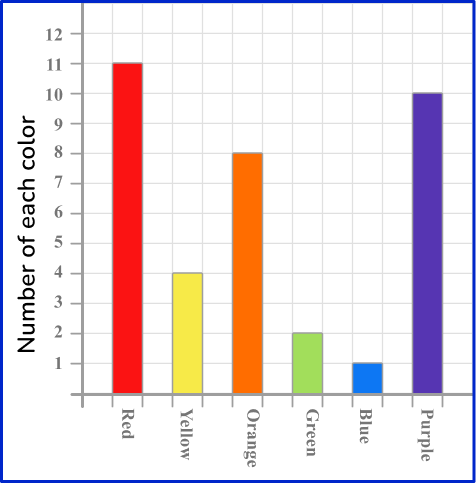
Categorical data is data that can be grouped into categories.
Continuous data is data that can be measured.
The bar graph categorizes skittles based on color. So, the data in this project is categorical.
Example 3: recognizing types of data
Charlee does a survey in her class on favorite soda drinks. What type of data is Charlee collecting?
Qualitative data is non-numerical data.
Quantitative data is numerical data.
Favorite types of soda drinks are qualitative data because it’s information that is non-numerical.
Example 4: recognizing types of data from a frequency graph
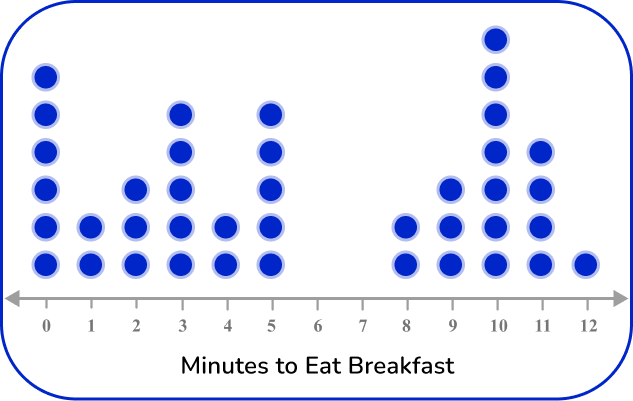
The dot plot below represents the time it takes 40 students to eat breakfast. Use two words that describe the data in this dot plot.
Quantitative data is numerical data.
Qualitative data is non-numerical data.
Discrete data is data represented by a specific set of numbers that are typically whole numbers.
Continuous data is data that can be measured.
Categorical data is data that can be grouped into categories instead of measured numerically.
The dot plot represents the number of minutes that it took 40 students to eat breakfast. This is numerical data, so it’s quantitative data.
The data also represents time in minutes, so it’s also continuous data.
Two words that can describe the data are quantitative and continuous.
Example 5: recognizing types of data from a frequency graph
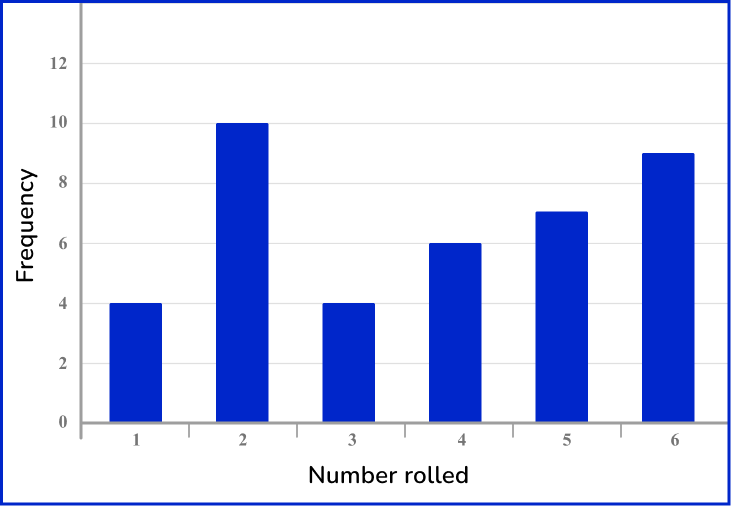
Mr. Shockely’s statistics class was conducting an experiment on rolling a die. The bar chart represents the data from a student rolling a die 40 times. What are two ways to describe the data?
Quantitative data is numerical data.
Qualitative data is non-numerical data.
Discrete data is data represented by a specific set of numbers that are typically whole numbers.
Continuous data is data that can be measured.
Categorical data is data that can be grouped into categories instead of measured numerically.
The bar chart represents 40 rolls of a die. This is numerical data so it’s quantitative data. The outcomes from rolling a die are only the numbers 1, 2, 3, 4, 5, 6.
This represents discrete data. So, the two ways to describe this data is quantitative discrete data.
Example 6: recognizing types of data from a histogram
The histogram represents the heights of trees on a farm. Does the data in the histogram represent quantitative discrete data or quantitative continuous data?
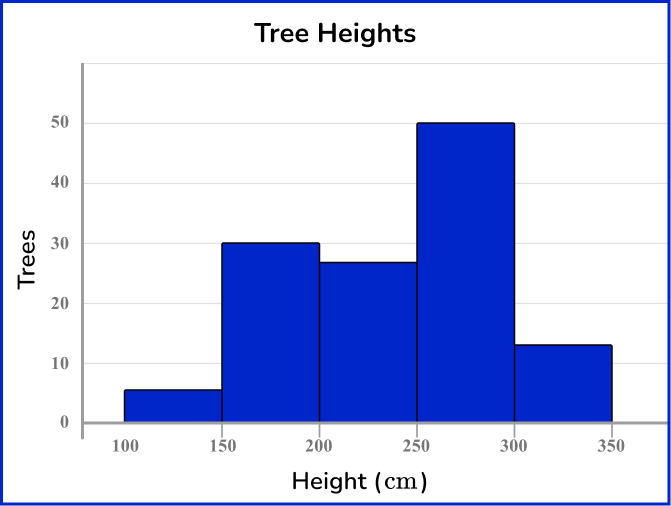
Quantitative data is numerical data.
Discrete data is data represented by a specific set of numbers that are typically whole numbers.
Continuous data is data that can be measured.
The data in the histogram represents the height of trees in centimeters, which is a measurement. So, the data in the histogram is quantitative continuous data.
Teaching tips for types of data
- Incorporate project based data science learning activities where students have opportunity to collect their own data as well as do data analysis/statistical analysis on the collected data.
- Show students how to create data visualizations using Excel or Google Sheets.
Easy mistakes to make
- Mixing up data types
It is very easy for students to mix up the different types of data. Using diagrams such as flow charts helps students recall the different types of data.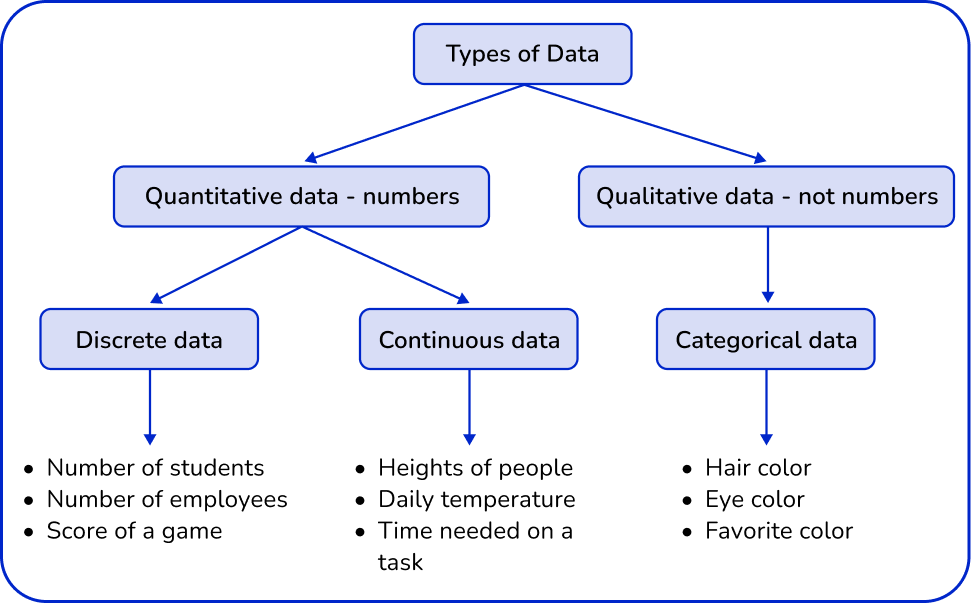
- Confusing continuous and discrete data
Understanding the difference between continuous and discrete data can be confusing for students. For example, shoe size is considered discrete data, not continuous data.
Even though a person’s shoe size is based on the length of their foot, the shoe size for a person can only be a certain set of values, such as an 8 or 8.5 in US sizing. Therefore, shoe size is an exact value, which makes it discrete data.
Practice types of data questions
1. Farah was doing research on rainfall. The data she found was the amount of rainfall in millimeters that fell in Australia over the last 30 years.
Which option best describes the type of data she found?
Qualitative

Discrete
Continuous

Categorical
The data she collected is numerical and based on measurement in millimeters. So, the data is continuous since continuous data is data that is measured.
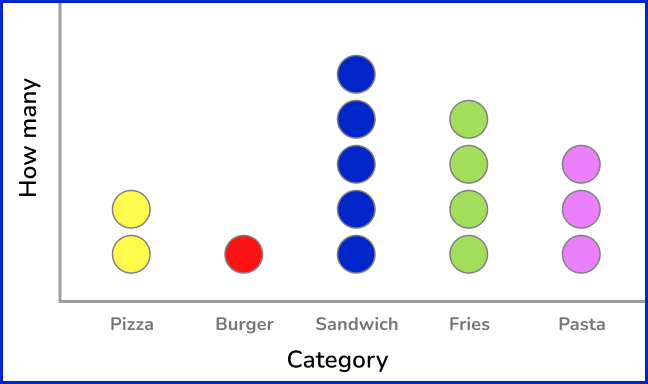
2. The dot plot below represents Mrs. Smith’s students favorite type of lunch. Which of the following best describes the data?
Quantitative discrete data
Qualitative discrete data
Quantitative continuous data
Qualitative categorical data
The data in the dot plot is not numerical and is grouped into categories of the types of food the students prefer for lunch. So, the data is qualitative categorical data.
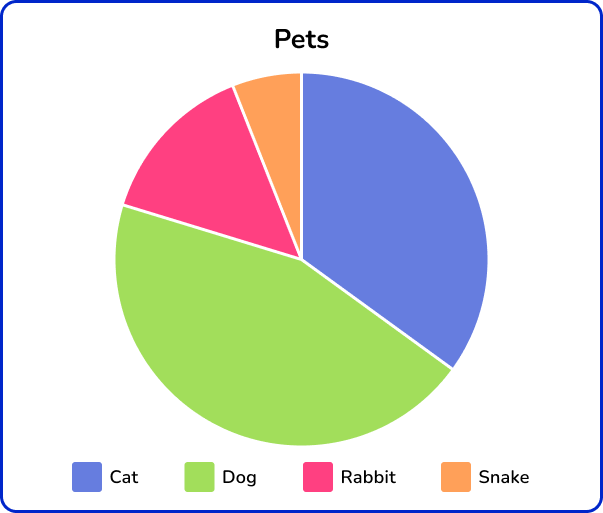
3. The pie chart below shows the types of pets a group of 6th grade students have. Which of the following best describes the data?
Qualitative
Discrete
Continuous
Quantitative
The pie chart represents non-numerical data based on categories of types of pets. So, the data is qualitative.
4. Simon did an experiment measuring the length of a spring based on the force applied to stretch it.
Which option best describes the type of data he collected?
Qualitative and categorical
Quantitative and categorical
Quantitative and continuous
Quantitative and discrete
The data he collected is numerical and a measurement so it’s quantitative and continuous.
5. What type of data does the graph below represent?
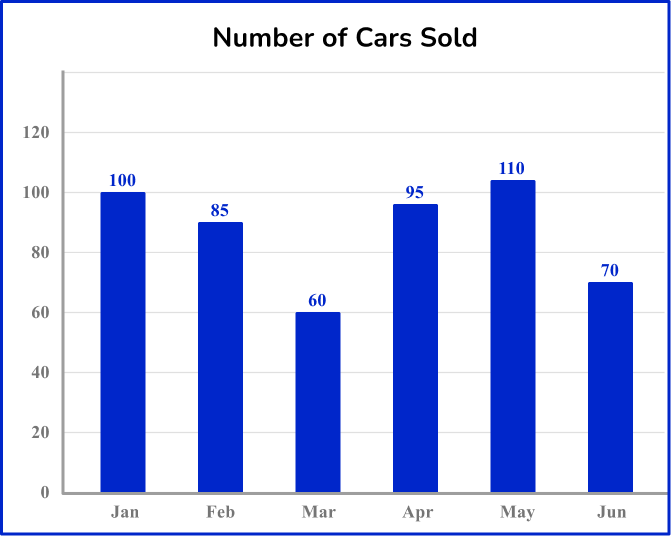
Quantitative and discrete
Quantitative and continuous
Quantitative and categorical
Qualitative and categorical
The data in the bar chart represent numerical data. The data is also represented as exact values and is not a measurement. So, the data is quantitative and discrete.
6. Which option best describes the data shown on the frequency table.
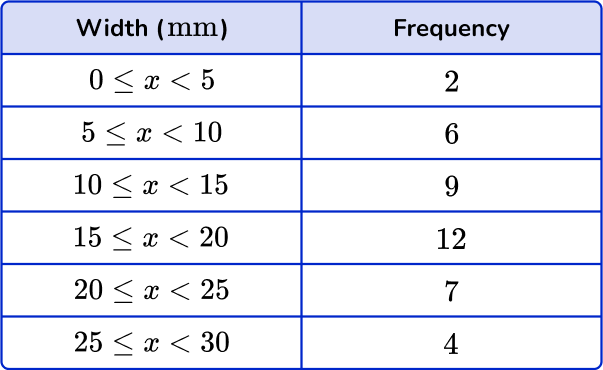
Qualitative
Quantitative and continuous
Quantitative and discrete
Categorical
The data are numerical values and measurements.
Types of data FAQs
Primary data is data collected by the person conducting the actual research.
Step-by-step guide: Primary data
Secondary data is collected by another person who is not conducting the actual research.
Step-by-step guide: Secondary data
Nominal data is a type of qualitative data. It cannot be ordered or measured. Examples of nominal data are zip code, blood type, and political party.
Ordinal data is a type of qualitative data. It groups data into ordered categorical variables. Examples of ordinal data are socioeconomic status such as (low income, middle income, high income) or educational level (high school graduate, bachelor’s degree, master’s degree, doctorate).
Data scientists need to know how to use programming languages; they do data management; they do exploratory data analysis; and use decision-making based on their data analysis.
You will learn abaut descriptive statistics in high school. Descriptive statistics focuses on describing the visual characteristics of a particular data set.
Big data is larger, more complex data. Artificial intelligence and machine learning is used to do big data analytics.
Statistical analysis/data analysis permeates many different career paths such as market research and customer satisfaction.
Interval data is also known as an integer which means each data point is placed at equal distance from one another.
You will learn about ratio data in a statistics class. It is a type of quantitative data.
You will learn about standard deviation in high school. It is the amount of variation of a data set.
The next lessons are
Still stuck?
At Third Space Learning, we specialize in helping teachers and school leaders to provide personalized math support for more of their students through high-quality, online one-on-one math tutoring delivered by subject experts.
Each week, our tutors support thousands of students who are at risk of not meeting their grade-level expectations, and help accelerate their progress and boost their confidence.

Find out how we can help your students achieve success with our math tutoring programs.
[FREE] Common Core Practice Tests (3rd to 8th Grade)
Prepare for math tests in your state with these 3rd Grade to 8th Grade practice assessments for Common Core and state equivalents.
Get your 6 multiple choice practice tests with detailed answers to support test prep, created by US math teachers for US math teachers!