High Impact Tutoring Built By Math Experts
Personalized standards-aligned one-on-one math tutoring for schools and districts
In order to access this I need to be confident with:
Addition and subtraction Multiplication and divisionQualitative data
Here you will learn about qualitative data, including what it is and how to use it in the statistical process.
Students first learn to work with qualitative data in the statistical process in 6 th grade.
What is qualitative data?
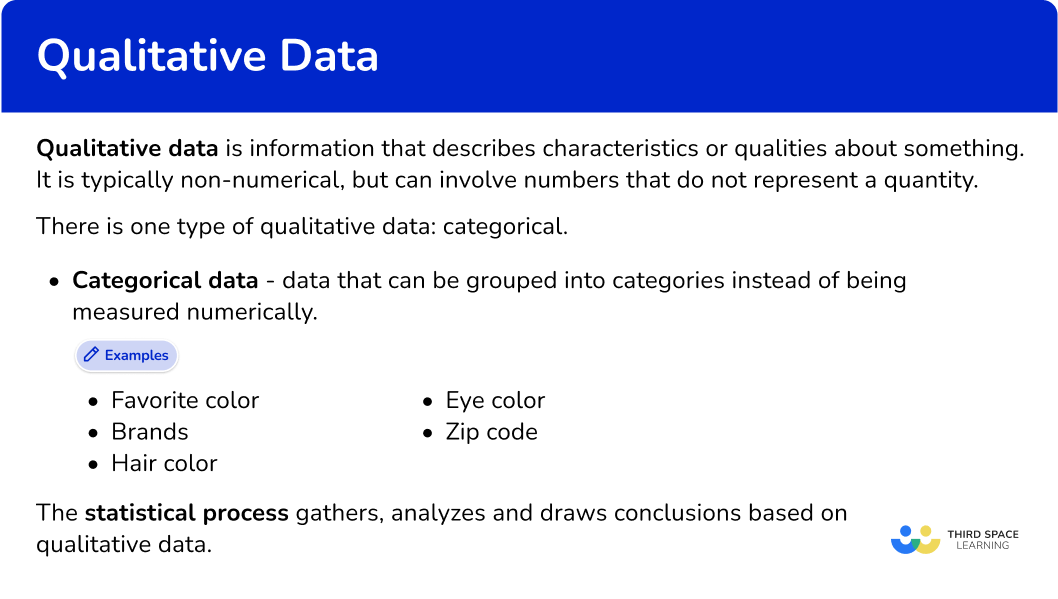
Qualitative data is information that describes characteristics or qualities about something. It is typically non-numerical, but can involve numbers that do not represent a quantity.
There is one type of qualitative data: categorical.
- Categorical data – data that can be grouped into categories instead of being measured numerically.
Some examples of qualitative data are…
– \; Favorite color
– \; Brands
– \; Hair color
– \; Eye color
– \; Zip code
The statistical process gathers, analyzes and draws conclusions based on qualitative data.
You can begin the statistical process by writing a statistical research question. A statistical question always allows for variability.
For example,
| What is my favorite color? | What is the most popular color among 6th graders at my school? |
| This is NOT a statistical question, because there is one answer. | This is a statistical question that allows for variability. |
Many researchers also create hypotheses to go with the question, but this is not required.
The next part of the process is planning and completing data collection. Some qualitative data collection methods are focus groups, surveys, experiments, case studies, interviews, or questionnaires. The method chosen depends on many things, some of which include…
- How much time do you have for data collection?
- What resources (including money) can you use to collect data?
- Will the data be collected from the entire population or a sample?
For example,
What is the most popular color among 6 th graders at my school?
One way this data can be collected is by emailing a survey to every student in the school – which would be a quick and free way to collect data on the entire population.
Once you have collected all observations (the final number of respondents or data points), it is time to begin the statistical analysis.
The analysis process begins with deciding which graphs or methods you will use to analyze the data. Analyzing qualitative data includes using dot plots, bar graphs, pie charts and more.
Finally, qualitative data analysis is used to draw conclusions and answer the original question asked based on the collected data.
The answer to a statistical question should always take into account all parts of the process and anticipate ways in which the data may be a flawed representation.
What is qualitative data?
Common Core State Standards
How does this apply to 6 th grade math?
- Grade 6 – Statistics and Probability (6.SP.B.5a and 6.SP.B.5b)
Recognize a statistical question as one that anticipates variability in the data related to the question and accounts for it in the answers. For example, “How old am I?” is not a statistical question, but “How old are the students in my school?” is a statistical question because one anticipates variability in students’ ages.
- Grade 6 – Statistics and Probability (6.SP.B.5a and 6.SP.B.5b)
Summarize numerical data sets in relation to their context, such as by:- Reporting the number of observations.
- Describing the nature of the attribute under investigation, including how it was measured and its units of measurement.
![[FREE] Types of Data Check for Understanding (Grade 6 to 7)](https://thirdspacelearning.com/wp-content/uploads/2023/11/Types-of-Data-listing-image.png)
[FREE] Types of Data Check for Understanding (Grade 6 to 7)
Use this quiz to check your grade 6 to grade 7 students’ understanding of types of data. 15+ questions with answers covering a range of 6th and 7th grade types of data topics to identify areas of strength and support!
DOWNLOAD FREE [FREE] Types of Data Check for Understanding (Grade 6 to 7)
Use this quiz to check your grade 6 to grade 7 students’ understanding of types of data. 15+ questions with answers covering a range of 6th and 7th grade types of data topics to identify areas of strength and support!
DOWNLOAD FREEHow to write a qualitative statistical question
In order to write a qualitative statistical question:
- Think of a question that would be answered with a category.
- Write the question to allow for variability.
Qualitative data examples
Example 1: writing a qualitative statistical question
Create a qualitative statistical question.
- Think of a question that would be answered with a category.
What is your favorite genre of music?
This could be answered with rock, pop, hip hop, electronic, country, etc…
2Write the question to allow for variability.
Since each person has one favorite genre, asking just one person will not provide a variety. Instead, you need to choose a group of people to be the population for the question.
For example,
Which music genre is the favorite of my family members?
Now the question will have a variety of answers, because the data population is every member in your family.
Example 2: writing a qualitative statistical question
Create a qualitative statistical question.
What month were you born?
This could be answered with January, February, March, etc…
Since each person has one birth month, asking just one person will not provide a variety. Instead, you need to choose a group of people to be the population for the question.
For example,
What is the most common birth month at my school?
Now the question will have a variety of answers, because the data population is every student at your school.
Example 3: writing a qualitative statistical question
Create a qualitative statistical question.
What color is the car?
This could be answered with white, blue, red, green, etc…
Since a car has one color, collecting data on one car will not provide a variety. Instead, you need to choose a group to be the population for the question.
For example,
What colors are the cars in the grocery store parking lot?
Now the question will have a variety of answers, because the data population is every car in the grocery store parking lot.
How to use the statistical process with qualitative data
In order to use the statistical process with qualitative data:
- Ask a question that allows for variability and categorical data.
- Decide on data collection methods and perform data collection.
- Analyze the categorical data.
- Draw conclusions to connect the data collected to the original question.
Example 4: going through the statistical process
Scenario: A school is choosing a new animal mascot.
Describe how this could be used in the statistical process.
The school could ask “What do the students at our school think our new animal mascot should be?”
This is a statistical question that allows for variability – since multiple students will respond.
To collect from the entire school population…
The school could print out a survey paper and give it to each teacher to give to their students.
To collect from samples…
The school could randomly ask 5 students in every class to answer the question.
Once the data is collected, the school must decide which analysis methods to use.
Since they are looking for the most popular answer, they can create a frequency table, which shows the total numbers of each animal.
The school should return to the original question “What do the students at our school think our new animal mascot should be?” and use the data analysis to draw a conclusion.
The school should also reflect on the data collection and analysis process to decide if any mistakes or biases were present.
Example 5: going through the statistical process
Scenario: There is an upcoming city election and a news channel is trying to predict the outcome.
Describe how this could be used in the statistical process.
The news channel could ask “Who are most people going to vote for in the upcoming city election?”
This is a statistical question that allows for variability – since multiple people will respond.
To collect from the entire city population…
The news channel could go door to door asking all registered voters in each home.
*Note: In this example, it would be nearly impossible to collect data from the entire population for many reasons: this would be time consuming, not all voters will be at home at the time, some voters may not want to answer the question, etc.
To collect from samples…
The news channel could randomly call 500 registered voters to ask the question.
Once the data is collected, the news channel must decide which analysis methods to use.
Since they are looking to compare between categories, they can create a pie chart with percentages, which is a visualization of the data, showing categories as areas.
The news channel should return to the original question “Who are most people going to vote for in the upcoming city election?” and use the data analysis to draw a conclusion.
The news channel should also reflect on the data collection and analysis process to decide if any mistakes or biases were present.
Example 6: going through the statistical process
Scenario: A healthcare provider is doing a follow-up survey for patients who have recently visited the doctor’s office.
Describe how this could be used in the statistical process.
The healthcare provider could ask “What is the most common rating patients give after their recent visit?” (with the ratings options being not satisfactory, satisfactory or extremely satisfactory).
This is a statistical question that allows for variability – since multiple patients will respond.
To collect from the entire patient population…
The healthcare provider could include the question as a part of the check out process at the doctor’s office.
To collect from samples…
The healthcare provider could randomly call 10 patients each day and ask the question.
Once the data is collected, the healthcare provider must decide which analysis methods to use.
Since they are looking to compare between categories, they can create a bar graph, which is a visualization of the data by the height of each bar.
The healthcare provider should return to the original question “What is the most common rating patients give after their recent visit?” and use the data analysis to draw a conclusion.
The healthcare provider should also reflect on the data collection and analysis process to decide if any mistakes or biases were present.
Teaching tips for qualitative data
- Incorporate project based learning activities where students have the opportunity to collect their own data by doing experiments, creating surveys, or conducting interviews. This will help students develop a deeper understanding of the statistical process.
- In the classroom, use real world examples of qualitative data. These can be things like bar graphs or pie charts from newspaper articles or data collected in the school setting (such as the types of shoes students wear on a certain day or comparing the favorite sport of students in different grade levels).
- Consider doing a long, in-depth class project throughout the entire unit. As a class, students can decide on a topic, and then within smaller groups, students can explore different statistical research questions (both quantitative and qualitative). Then students can share their group analysis with the class and come to a conclusion together – considering all the research that was completed.
Easy mistakes to make
- Thinking that categorical data never has numbers
While categorical data should not involve quantities, it can involve categories with numbers. For example, the categories 1 st, 2 nd, 3 rd, 4 th and so on can be used. As well as representing the months of the year by their order number 1 – January, 2 – February, etc.
- Not choosing reliable data sources
If you are using data that you did not collect yourself, always make sure it comes from a reliable source. This can include (but is not limited to) official government websites, official team websites (for sports data), or directly from a book or cited study.
Related types of data lessons
Practice qualitative data questions
1. Which of the following is a qualitative statistical question?
What color are the president’s eyes?

What is the most common eye color in 6 th grade?

How many presidents have had blue eyes?
How many students in 6 th grade wear glasses?
What is the most common eye color in 6 th grade?
This question has categorical values as answers. Such as blue, green, hazel, brown, etc.
The question also allows for variability since it considers the eye colors of multiple students.
2. Which of the following is a qualitative statistical question?
What is Mr. Gonzalez’s favorite ice cream flavor?
How many teachers like chocolate ice cream?
Which ice cream flavor is most popular among teachers?
Do you like vanilla ice cream or chocolate better?
Which ice cream flavor is most popular among teachers?
This question has categorical values as answers. Such as vanilla, cookies and cream, birthday cake, chocolate, etc.
The question also allows for variability since it considers what many teachers like.
3. Which of the following is a qualitative statistical question?
What is the most popular shoe brand among students at River Valley Middle School?
How many 6 th grade students go to River Valley Middle School?
What shoe brand is Tyra wearing today?
How many students are wearing Skechers today at River Valley Middle School?
What is the most popular shoe brand among students at River Valley Middle School?
This question has categorical values as answers. Such as Reebok, Nike, Crocs, Addias, Vans, etc.
The question also allows for variability since it considers multiple students.
4. Miguel is doing a research project on middle school students’ favorite school subject at his school.
What should Miguel do to begin the statistical process?
Collect qualitative data
Write a statistical question
Analyze qualitative data
Draw a conclusion
Miguel knows the research topic, so the first step is to write a statistical question. Once a question is written, Miguel can collect data, then analyze it to finally draw a conclusion.
5. Jennifer is using data she collected to decide on what type of chips the cafeteria should serve.
Which part of the statistical process is Jennifer completing?
Write a statistical question
Collect data
Analyze data
Draw a conclusion
Jennifer has already written a question and collected data. She has also already analyzed the data – though it does not say how.
However, we know that Jennifer has used the analysis to identify which chips are most popular and is using that to draw a conclusion.
6. Which correctly shows the order of the statistical process?
Collect data, write a statistical question, analyze data, draw a conclusion
Collect data, analyze data, draw a conclusion, write a statistical question
Write a statistical question, collect data, draw a conclusion, analyze data
Write a statistical question, collect data, analyze data, draw a conclusion
In order to start the statistical process, a question must be written. The statistical question indicates the purpose of the research and shows what data needs to be collected.
Once a question is created, the data needs to be collected. The collected data can then be analyzed.
Lastly, use the analysis to draw a conclusion based on the question and the data collected.
Qualitative data FAQs
Both – research data can be collected with open-ended questions in both non-numerical data and numerical values form.
A qualitative approach to this question style may involve a short response (such as yes or no) or a longer response (such as a story or a detailed explanation).
A quantitative approach will always involve giving some sort of quantity as an answer.
Qualitative research methods and quantitative research methods have very similar methodologies. They differ most during the analysis portion of the process.
There are endless uses for qualitative data in real world jobs. One includes a market researcher, whose job it is to complete the statistical process for companies and businesses.
It is their job to ask statistical questions, perform data collection and analysis on the data set. It is important to note that both types of data (quantitative and qualitative) are integral parts of the data analysis process in the real world.
Yes, particularly for qualitative research studies involving people and complex topics (such as psychology).
The research design typically allows for a small sample size of people (since this type of research is time consuming). The interview can range from a set list of questions to very unstructured (letting the participant guide the discussion).
In-depth interviews can be administered by a researcher, a non-bias moderator, or by the use of technology. Then, the audio recordings from the interviews are then turned into interview transcripts, which can be used for analysis and conclusion purposes.
The next lessons are
Still stuck?
At Third Space Learning, we specialize in helping teachers and school leaders to provide personalized math support for more of their students through high-quality, online one-on-one math tutoring delivered by subject experts.
Each week, our tutors support thousands of students who are at risk of not meeting their grade-level expectations, and help accelerate their progress and boost their confidence.

Find out how we can help your students achieve success with our math tutoring programs.
[FREE] Common Core Practice Tests (3rd to 8th Grade)
Prepare for math tests in your state with these 3rd Grade to 8th Grade practice assessments for Common Core and state equivalents.
Get your 6 multiple choice practice tests with detailed answers to support test prep, created by US math teachers for US math teachers!