High Impact Tutoring Built By Math Experts
Personalized standards-aligned one-on-one math tutoring for schools and districts
In order to access this I need to be confident with:
Addition and subtraction Multiplication and divisionQuantitative data
Here you will learn about quantitative data, including what it is and how to use it in the statistical process.
Students first learn to work with quantitative data in the statistical process in 6 th grade.
What is quantitative data?
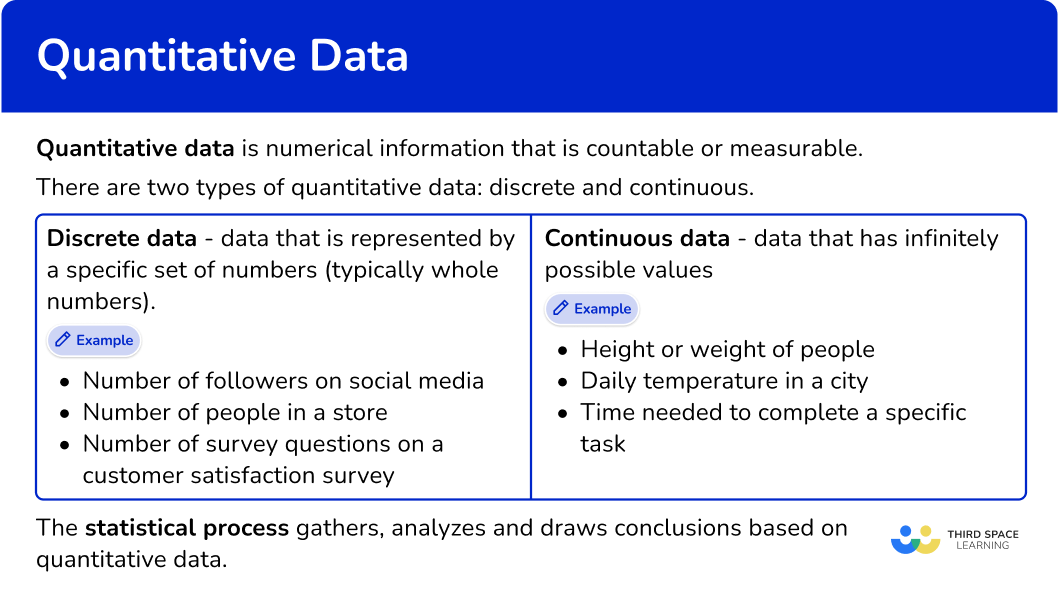
Quantitative data is numerical information that is countable or measurable.
There are two types of quantitative data: discrete and continuous.
- Discrete data – data that is represented by a specific set of numbers (typically whole numbers).
For example,
– Number of followers on social media
– Number of people in a store
– Number of survey questions on a customer satisfaction survey
- Continuous data – data that has infinitely possible values.
For example,
– Height or weight of people (which can be measured in meters, centimeters, millimeters, and so on…)
– Daily temperature in a city (which can be measured in degrees to the nearest whole, tenth, hundredth, thousandth, and so on…)
– Time needed to complete a specific task (which can be measured in hours, minutes, seconds, milliseconds, and so on…)
The statistical process gathers, analyzes and draws conclusions based on quantitative data.
The first part of the statistical process is creating a statistical research question. A statistical question should always allow for variability.
For example,
| How many pets do I have? | On average, how many pets do the students at my school have? |
| This is NOT a statistical question, because there is one direct answer. | This is a statistical question that allows for variability. |
Many researchers also create hypotheses to go with the question, but this is not required.
The next part of the process is deciding on data collection methods (research methods) and then collecting it. Quantitative data collection may be collected with experiments, polls, interviews, focus groups, surveys, or questionnaires.
The method chosen depends on many things, some of which include…
- How much time is allowed for data collection.
- How much money can be spent on data collection.
- Whether data will be collected on the entire population or a sample.
For example,
On average, how many pets do the students at my school have?
One way this data can be collected is by emailing a survey to every student in the school – which would be a quick and free way to collect data on the entire population.
Once you have collected all observations (the final number of respondents or data points), it is time to begin the statistical analysis.
The analysis process begins with deciding which graphs or methods you will use to analyze the data. Analyzing quantitative data includes using box plots, histograms, dot plots and more.
Quantitative data analysis methods include calculating the mean, median, mode, range and other points that describe the center and variability of the data set.
Finally, quantitative data analysis is used to draw conclusions and answer the original question asked based on the collected data.
The answer to a statistical question should always take into account all parts of the process and anticipate ways in which the data may be a flawed representation.
What is quantitative data?
Common Core State Standards
How does this apply to 6 th grade math?
- Grade 6 – Statistics and Probability (6.SP.B.5a and 6.SP.B.5b)
Recognize a statistical question as one that anticipates variability in the data related to the question and accounts for it in the answers. For example, “How old am I?” is not a statistical question, but “How old are the students in my school?” is a statistical question because one anticipates variability in students’ ages.
- Grade 6 – Statistics and Probability (6.SP.B.5a and 6.SP.B.5b)
Summarize numerical data sets in relation to their context, such as by:- Reporting the number of observations.
- Describing the nature of the attribute under investigation, including how it was measured and its units of measurement.
![[FREE] Types of Data Worksheet (Grade 6 to 7)](https://thirdspacelearning.com/wp-content/uploads/2023/11/Types-of-Data-listing-image.png)
[FREE] Types of Data Worksheet (Grade 6 to 7)
Use this quiz to check your grade 6 to grade 7 students’ understanding of types of data. 15+ questions with answers covering a range of 6th and 7th grade types of data topics to identify areas of strength and support!
DOWNLOAD FREE [FREE] Types of Data Worksheet (Grade 6 to 7)
Use this quiz to check your grade 6 to grade 7 students’ understanding of types of data. 15+ questions with answers covering a range of 6th and 7th grade types of data topics to identify areas of strength and support!
DOWNLOAD FREEHow to write a quantitative statistical question
In order to write a quantitative statistical question:
- Think of a question that would be answered with a quantity.
- Write the question to allow for variability.
Quantitative data examples
Example 1: writing a quantitative statistical question
Create a quantitative statistical question.
- Think of a question that would be answered with a quantity.
How many siblings do you have?
This could be answered with 1, \, 2, \, 3, \, 4, etc. This is discrete, quantitative data.
2Write the question to allow for variability.
Since each person has a specific number of siblings, asking just one person will not provide a variety. Instead, you need to choose a group of people to be the population for the question.
For example,
On average, how many siblings do the kids in my neighborhood have?
Now the question will have a variety of answers, because the data population is all the kids in the neighborhood.
Example 2: writing a quantitative statistical question
Create a quantitative statistical question.
How many inches did it rain today?
This could be answered with 0.2, \, 0.5, \, 0.75, \, 1, etc. This is continuous, quantitative data.
A question about 1 day and 1 location will not provide a variety. Instead, you need to choose a group of days or a group of locations to be the population for the question.
For example,
How much did it rain today in each city in Florida?
Now the question will have a variety of answers, because the data population is all the cities in Florida.
Example 3: writing a quantitative statistical question
Create a quantitative statistical question.
What is Lebron James’ height?
The answer to this question is 81.1 inches. This is continuous, quantitative data.
As you can tell by the one answer, this question does not provide a variety. Instead, you need to choose a group of people to be the population for the question.
For example,
What is the average height of NBA basketball players?
Now the question will have a variety of answers, because the data population is all NBA basketball players.
How to use the statistical process with quantitative data
In order to use the statistical process with quantitative data:
- Ask a question that allows for variability and numerical data.
- Decide on data collection methods and perform data collection.
- Analyze the numerical data.
- Draw conclusions to connect the data collected to the original question.
Example 4: going through the statistical process
Scenario: A school cafeteria has a rating scale, where students can rate the main dish on a scale from 1-5.
Describe how this could be used in the statistical process.
The school cafeteria could ask “ On average, how often do students rate the main dish as a 4 or 5?”
This is a statistical question that allows for variability – since multiple students will respond over multiple days.
To collect from the entire school population…
The school’s cafeteria workers could have the students place a check mark on a poster that shows the scale as they leave the cafeteria each day.
To collect from samples…
The school’s cafeteria workers could randomly ask 10 students in every class to rate the main dish.
Once the data is collected, the cafeteria workers must decide how to analyze it. They decide to use the data to find the percentage of students who chose each rating and they show this on a pie chart.
The school cafeteria workers should return to the original question “ On average, how often do students rate the main dish as a 4 or 5?” and use the data analysis to draw a conclusion.
The school cafeteria workers should also reflect on the data collection and analysis process to decide if any mistakes or biases were present.
Example 5: going through the statistical process
Scenario: Julie is doing a research project. She wants to know how fast 6 th graders at her school can run a mile.
Describe how she can use the statistical process.
Julie could ask “On average, how fast can the 6 th graders at my school run a mile?”
This is a statistical question that allows for variability – since it deals with a group of students.
To collect from the entire 6 th grade population…
Julie could ask the PE teacher for an anonymous list of mile times from all the 6 th graders in PE class.
To collect from samples…
Julie could randomly choose 30 students from the 6 th grade and ask them to share their mile time from PE class.
Once the data is collected, Julie must decide how to analyze it. She can find the mean of the times and plot the times on a histogram, to analyze both the center and spread.
Julie should return to the original question “On average, how fast can the 6 th graders at my school run a mile?” and use the data analysis to draw a conclusion.
Julie should also reflect on the data collection and analysis process to decide if any mistakes or biases were present.
Example 6: going through the statistical process
Scenario: A coach records how many free throws each player makes during each game.
Describe how the coach can use the statistical process.
The coach could ask “On average, how many free throws does each player make during a game?”
This is a statistical question that allows for variability – since it deals with multiple players who will (most likely) make multiple free throw shots over multiple games.
To collect from the entire team population…
The coach could use all the data from every player that is collected at each game.
In this case, since the population is small and the coach has collected data for all players, it does not make sense to do a sample.
Once the data is collected, the coach must decide how to analyze it. She can find the mean and median of the free throws made per game and plot the free throws on a box plot, to analyze both the center and spread.
The coach should return to the original question “On average, how many free throws does each player make during a game?” and use the data analysis to draw a conclusion.
The coach should also reflect on the data collection and analysis process to decide if any mistakes or biases were present.
Teaching tips for quantitative data
- Give opportunities for students to write a question and collect data for their own quantitative research project. Going through the entire statistical process helps students remember and understand the methodology.
- Use real world examples of quantitative data in the classroom. These can be things like graphs or percentages from newspaper articles or data collected in the school setting (such as classroom surveys, fundraiser data or school garden measurements).
Easy mistakes to make
- Confusing a regular question with a statistical question
A statistical question must account for variability. Even if a question has a number as an answer, if the answers can’t vary, it is not a statistical question.
For example,
How long does it take you to get home from school?
This is NOT statistical if only one person is asked.
On average, how long does it take 7 th graders to get home from school?
This is statistical because it allows for variability.
- Making mistakes when analyzing data
Analyzing data can be a complex and tedious process – even with data analysis tools. Always double check your work in any calculations and graphs.
- Making too broad of conclusions
The conclusion should always reflect the question AND the data collected and nothing more.
For example,
On average, how long does it take 7 th graders to get home from school?
The data from this question can only be applied to conclusions about 7 th graders and only 7 th graders at the school(s) that were included in the data collection. Including other grade levels or schools in the conclusions is extrapolation and NOT a valid conclusion.
- Confusing continuous and discrete data
Both of these types of data are numerical, but they are not the same.
Examples of discrete data are shoe sizes – there are a certain set of values.
Examples of continuous data are the temperatures inside a refrigerator – degrees can be measured to any decimal point, so there is no specific set of values.
Related types of data lessons
Practice quantitative data questions
1) Which of the following is a quantitative statistical question?
What was the high temperature in Thomasville today?

Which grade has the most students at Thomasville Elementary?
How many people live in Thomasville?
What is the average height of a student at Thomasville Middle School?

What is the average height of a student at Thomasville Middle School?
This question has numerical values as answers. Such as 3.5{~ft}, \, 3.9{~ft}, \, 4.1{~ft}, etc. This is continuous, quantitative data.
The question also allows for variability since it considers the height of multiple students.
2) Which of the following is a quantitative statistical question?
How much does this green apple weigh?
On average, how much do red apples weigh?
How many different colors of apples are there?
How many more apples are red than green?
On average, how much do red apples weigh?
This question has numerical values as answers. Such as 5.5 ounces, 6.9 ounces, 6.1 ounces, etc. This is continuous, quantitative data.
The question also allows for variability since it considers the weight of multiple apples.
3) Which of the following is a quantitative statistical question?
What is the average number of books 6 th graders read last summer?
How many total books did the 6 th graders read last summer?
How many 6 th graders read at least 10 books last summer?
What was the most popular book for the average 6 th grader last summer?
What is the average number of books 6 th graders read last summer?
This question has numerical values as answers. Such as 8 books, 16 books, 34 books, etc. This is discrete, quantitative data.
The question also allows for variability since it considers multiple students.
4) Zander is doing a research project on plant growth in the school garden. What should Zander do to begin the statistical process?
Collect qualitative data
Write a statistical question
Analyze quantitative data
Draw a conclusion
Zander knows the research topic, so the first step is to write a statistical question. Once a question is written, Zander can collect data, then analyze it to finally draw a conclusion.
5) Tracy is calculating percentages and creating a pie chart from the data she collected. Which part of the statistical process is Tracy completing?
Write a statistical question
Collect data
Analyze data
Draw a conclusion
Tracy has already written a statistical question and collected data. Creating graphs and calculating measures of centers and spread are a part of the analyzing data step.
Once Tracy has calculated the percentages and created the pie chart, Tracy can then use the analysis to draw a conclusion.
6) Which correctly shows the order of the statistical process?
Write a statistical question, collect data, draw a conclusion, analyze data
Collect data, write a statistical question, analyze data, draw a conclusion
Collect data, analyze data, draw a conclusion, write a statistical question
Write a statistical question, collect data, analyze data, draw a conclusion
In order to start the process, a question must be written. The statistical question indicates the purpose of the process and shows what data needs to be collected.
Once a question is created, the data needs to be collected. The collected data can then be analyzed.
Lastly, the analysis is used to draw a conclusion based on the question and the data collected.
Quantitative data FAQs
Qualitative is non-numerical data or ordinal data (which involves numbers, but not quantities). Examples of qualitative data are favorite colors, birth month or the finishing order in a race.
Quantitative data is numeric data and can be things like time, temperature or length. Qualitative research methods are similar to quantitative research methods, but when analyzing they often use different types of graphs.
Tools like Excel, Google sheets and many other digital tools can be used as data analysis tools.
Yes, while students are typically introduced to descriptive statistics first, the same data collected can also be used inferentially.
It is important to note that inferential statistics is the more advanced statistical method and involves complex mathematical equations, so it is not introduced until later grades.
There are endless uses for quantitative data in real world jobs. One includes a market researcher, whose job it is to complete the statistical process for companies.
It is their job to ask statistical questions, decide on a sample size, choose metrics, perform data collection and analysis (typically on a large data set). Then the market researcher uses the analysis to bring conclusions to the company.
The next lessons are
Still stuck?
At Third Space Learning, we specialize in helping teachers and school leaders to provide personalized math support for more of their students through high-quality, online one-on-one math tutoring delivered by subject experts.
Each week, our tutors support thousands of students who are at risk of not meeting their grade-level expectations, and help accelerate their progress and boost their confidence.

Find out how we can help your students achieve success with our math tutoring programs.
[FREE] Common Core Practice Tests (3rd to 8th Grade)
Prepare for math tests in your state with these 3rd Grade to 8th Grade practice assessments for Common Core and state equivalents.
Get your 6 multiple choice practice tests with detailed answers to support test prep, created by US math teachers for US math teachers!