High Impact Tutoring Built By Math Experts
Personalized standards-aligned one-on-one math tutoring for schools and districts
In order to access this I need to be confident with:
Calculator skills Fractions Fractions of numbers Percent of a number Quantitative dataStratified random sampling
Here you will learn about stratified random sampling, including what stratified random sampling is, how to take a stratified sample, and the advantages and disadvantages of stratified random sampling.
Students will first learn about stratified random sampling as part of statistics and probability in 7 th grade and expand upon their knowledge in high school.
What is stratified random sampling?
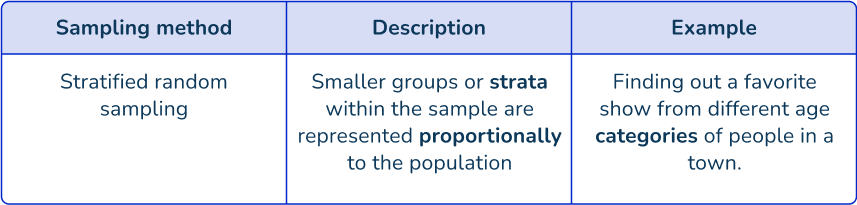
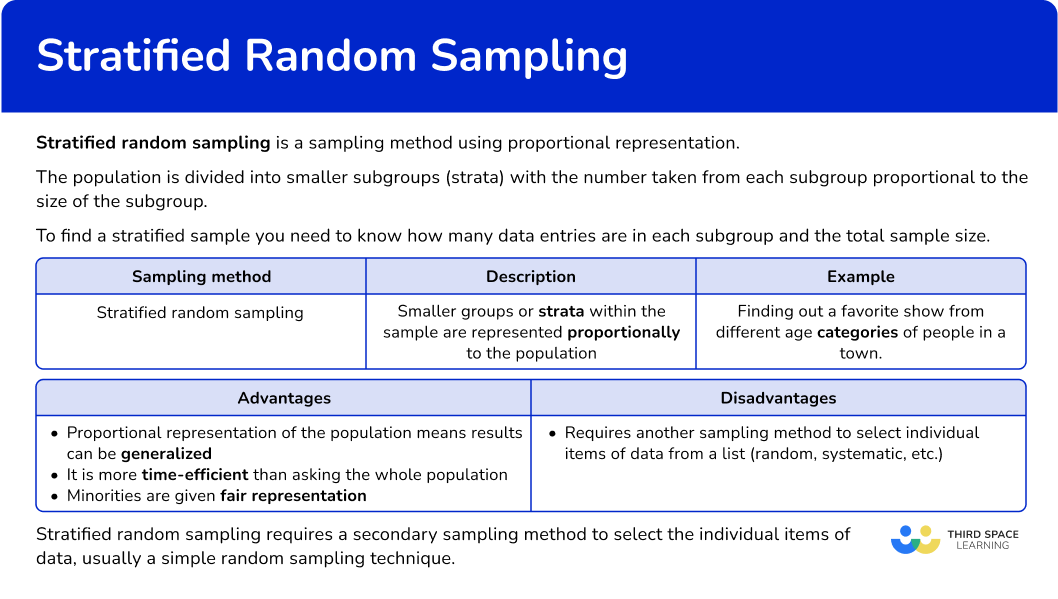
Stratified random sampling is a sampling method using proportional representation. The population is divided into smaller subgroups (strata) with the number taken from each subgroup proportional to the size of the subgroup.
The term stratification means to arrange something into groups. The larger the group, the more data entries will exist in the sample for that group.
To find a stratified sample, you need to know how many data entries are in each subgroup and the total sample size.
Stratified random sampling determines the number of items of data in each subgroup, so it requires a secondary method of sampling to select the individual items of data. This is usually done using a simple random sampling technique (using a random number generator).
![[FREE] Probability Check for Understanding Quiz (Grade 7 to 12)](https://thirdspacelearning.com/wp-content/uploads/2023/07/Probability-check-for-understanding-quiz-listing-image.png)
[FREE] Probability Check for Understanding Quiz (Grade 7 to 12)
Teaching stratified random sampling? Use this quiz to check your grade 7 to 12 students’ understanding of probability. 15+ questions with answers covering a range of probability topics to identify areas of strength and support!
DOWNLOAD FREE [FREE] Probability Check for Understanding Quiz (Grade 7 to 12)
Teaching stratified random sampling? Use this quiz to check your grade 7 to 12 students’ understanding of probability. 15+ questions with answers covering a range of probability topics to identify areas of strength and support!
DOWNLOAD FREEAdvantages and disadvantages of stratified random sampling
Following a stratified random sampling methodology has advantages and disadvantages:
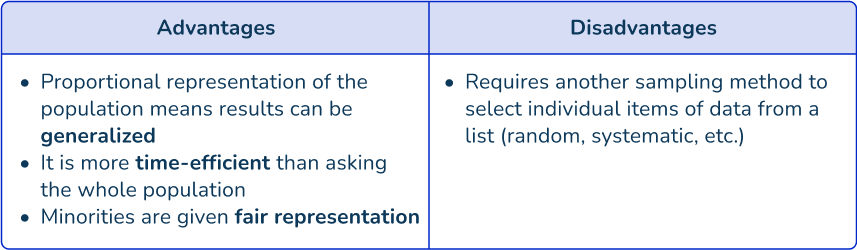
Stratified random sampling is used more frequently than other sampling techniques including cluster sampling and systematic sampling (on its own) because the dataset of the sample is proportional to the population size.
This stratifying allocation means that minority groups can be represented whereas they may not be with other probability sampling methods.
Sampling error
If every member of the population is in the sample, there is no sampling error.
As the sample gets smaller, or the methodology has introduced a selection bias, the sampling error becomes more significant as this means that the sample may not be representative of the total population.
The more random a sample is, the smaller the sampling error.
Data collection
Once a stratified random sample is chosen, the next step is data collection where respondents offer data to fulfill the requirements of the questionnaire or survey (for example). The collected values within the sample then go through data analysis to find generalized results for the overall population.
For example, you may want to calculate the average reading age of books in a library. Rather than picking up 100 random books from any shelf (this would be random sampling), you find out how the books are categorized (fiction, non-fiction, autobiography, children’s, reference, etc.)
Then, to get a representative sample, you would calculate the number of books from each sub-category that will be needed for the sample, and then use a random sample or systematic sample to select the books from each subgroup.
As the reference for each book in a library is usually electronically stored, the sample can be generated quickly.
What is stratified random sampling?
Common Core State Standards
How does this relate to 7 th grade math and high school math?
- Grade 7 – Statistics & Probability (7.SP.A.1)
Understand that statistics can be used to gain information about a population by examining a sample of the population; generalizations about a population from a sample are valid only if the sample is representative of that population. Understand that random sampling tends to produce representative samples and support valid inferences.
- High School – Statistics & Probability – Making Inferences & Justifying Conclusions (HS.S.IC.B.3)
Recognize the purposes of and differences among sample surveys, experiments, and observational studies; explain how randomization relates to each.
- High School – Statistics & Probability – Making Inferences & Justifying Conclusions (HS.S.IC.B.4)
Use data from a sample survey to estimate a population mean or proportion; develop a margin of error through the use of simulation models for random sampling.
How to take a stratified sample
In order to take a stratified sample:
- Calculate how many items of data will be selected for the sample.
- Calculate how many items of data will be selected in each subcategory.
- Check that the number of items of data matches the sample size.
- Select each individual data items using a random / systematic sampling technique.
Stratified random sampling examples
Example 1: stratified sample
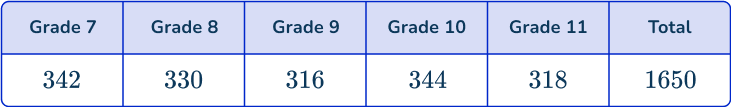
The student council is carrying out a survey. They want to collect a stratified sample of 10\% of students in grades 7-11. Calculate the number of students in each grade level that will take part in the survey.
- Calculate how many items of data will be selected for the sample.
As you know that there are 1,650 students in the school and the question asks for a sample size of 10\%, you need to calculate 10\% of 1,650\text{:}
\cfrac{1650}{100}\times{10}=165As this number is a decimal, you will round the value to the nearest integer, so you need a sample size of 165 students.
2Calculate how many items of data will be selected in each subcategory.
You will now calculate 10\% of each grade level and round each value to the nearest integer, and write the values in the table:
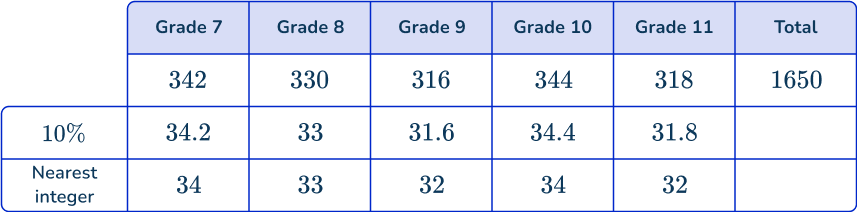
3Check that the number of items of data matches the sample size.
Adding the number of students in each grade level, you get:
34+33+32+34+32=165 which matches the sample size.
Example 2: stratified sample
Georgia wants to select some pick ‘n’ mix from the sweet shop to share with her friends. The sweets are sold from boxes with the following weights:
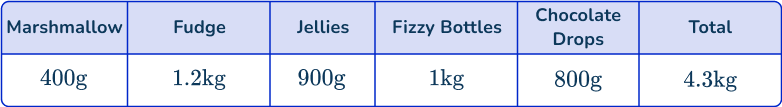
Georgia wants to take 15\% of sweets, proportional to their weight. Calculate how many grams of each sweet she will choose. Assume that each sweet is whole.
As you know that the total weight is 4.3\mathrm{~kg} ( or 4,300\mathrm{~g}), you need to calculate 15\% of this total number:
\cfrac{4300}{100}\times{15}=645\text{g}
So in total, Georgia wants 645\mathrm{~g} of sweets.
You now need to calculate 15\% of each type of sweet.
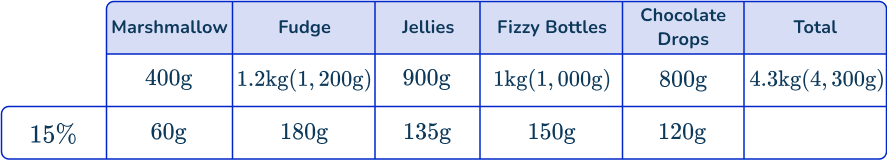
Adding the weight of each type of sweet in the sample size, you get:
60+180+135+150+120=645\mathrm{~g} which matches the sample size.
Example 3: stratified sample
An insurance company is completing some market research. They want to ask 60\% of their staff about their current working hours. Below is a table of the number of staff in each department across the business:
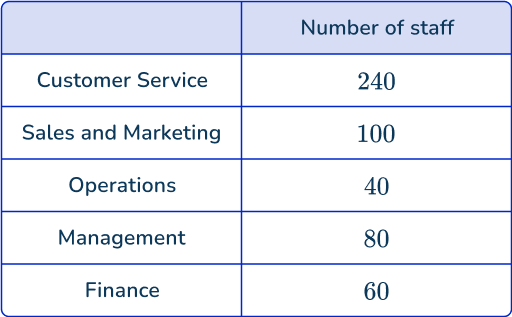
Use a stratified random sampling technique to find the number of staff in each category for the sample.
A quick sum of the number of staff in each department, you get:
240+100+40+80+60=520
As you need to collect a sample size of 60\%, you need to calculate 60\% of 520\text{:}
\cfrac{520}{100}\times{60}=312
You need a sample size of 312 staff.
You now need to calculate the number of staff in each department for the sample:
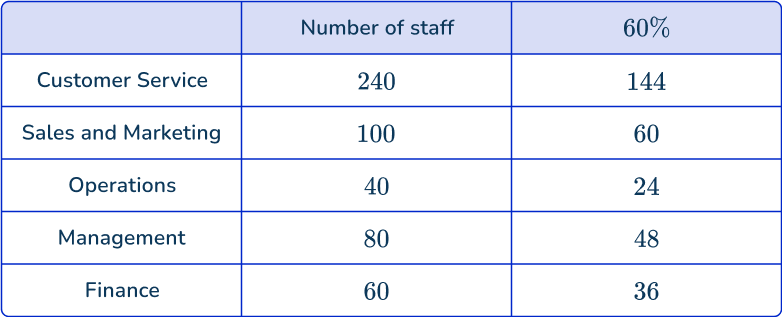
Adding the number of staff in each department, you get the sample size:
144+60+24+48+36=312
Example 4: stratified sample
Julie is a lexicographer. She is curious about the average length of words in a book. The book has 4 chapters. Below is a table showing the number of words in each chapter:
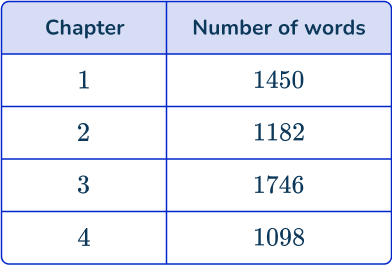
Julie would like to take a stratified sample of 20\% of the number of words in the book, proportional to the number of words in each chapter. Determine how many words she should collect in each chapter.
Let’s calculate how many words there are in the book:
1,450+1,182+1,746+1,098=5,476
As you need a sample size of 20\%, the number of words in the sample should be:
\cfrac{5476}{100}\times{20}=1095.2
As you cannot have 0.2 of a word, you round the number to the nearest integer, which in this case is 1,095.
You will now calculate 20\% of each chapter and round each value to the nearest integer, and write the values below the table:
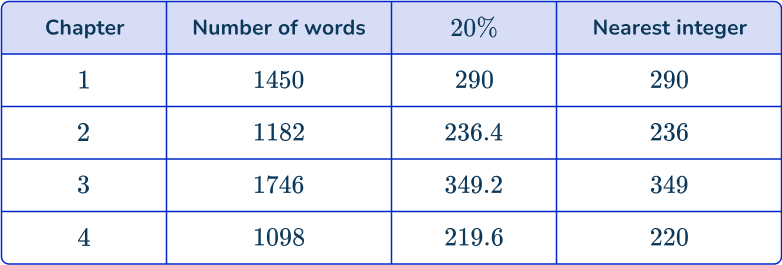
Adding the number of words in the sample, you get
290+236+349+220=1,095 which matches the sample size.
Example 5: stratified sample
Craig would like to survey 100 people from the population. He has grouped the population into a two way table:
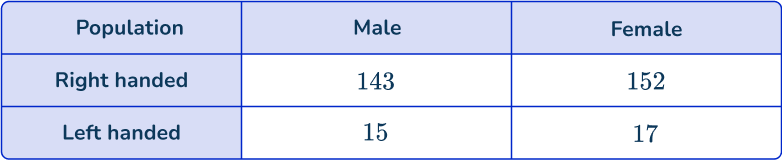
Calculate how many people should be chosen from each group.
As stated in the question, you want 100 people in the sample.
As you need 100 people, you need to determine what proportion from each category you are selecting. This is found by dividing the number of people in the sample by the number of people in the population.
The number of people in the population is equal to 143+152+15+17=327, so you can now calculate the proportion of each category:
\cfrac{\text{Sample size}}{\text{Population size}}=\cfrac{100}{327}
By multiplying each value in the two way table by the fraction \cfrac{100}{327}, you will calculate the number of people in the sample proportional to the target population:
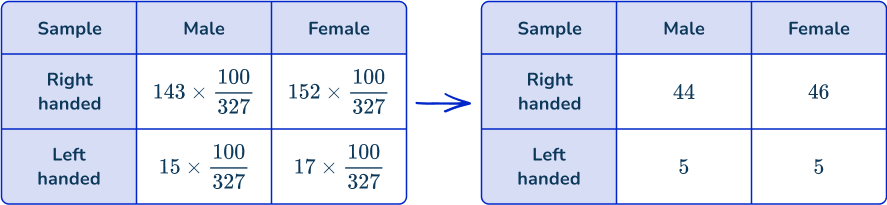
Adding the total values in each subcategory, you get:
44+46+5+5=100 which matches the sample size.
Teaching tips for stratified random sampling
- Use diagrams or charts to represent a population divided into different strata (subgroups or subpopulations). Show how random samples are taken from each group. Visual aids make it easier for students to understand how the method works.
- Highlight the difference between stratified and simple random sampling. In simple random sampling, every individual has an equal chance of being selected, but this can lead to some groups being over- or under-represented (disproportionate sampling). Explain how stratified random sampling helps ensure representation from all parts of the entire population.
- Explain that stratified sampling ensures all subgroups are represented. This is especially important when a population’s characteristics are diverse, like income levels, regions, or age groups.
- If available, introduce statistical software or online tools that automate the stratified sampling process, so students can explore real-life data more effectively.
Easy mistakes to make
- Mixing up a sampling method
Using the incorrect sampling method to select data (such as using systematic sampling or non random sampling).
- Incorrect percentages / fraction of an amount
When finding a sample of 60\% of the population, you need to find 60\% of each category, and not 60\% of the population and divide it equally between the number of categories. The larger the frequency in the category, the larger the sample taken. This is proportional representation.
- Incorrect number of items in the sample
Remember to check that the sample size matches the total sum of the samples from each category in the population.
- Assuming it’s the best method to use
Some students may assume that stratified sampling is always superior to simple random sampling or other sampling methods. While it’s helpful in many cases, it’s not always the best choice if the population consists of homogeneous groups or the strata don’t significantly differ.
Related sampling methods lessons
Practice stratified random sampling questions
1. A football league is completing research on their players. They want a stratified sample, proportional to their ages. Determine how many players will be asked in the missing category, x.
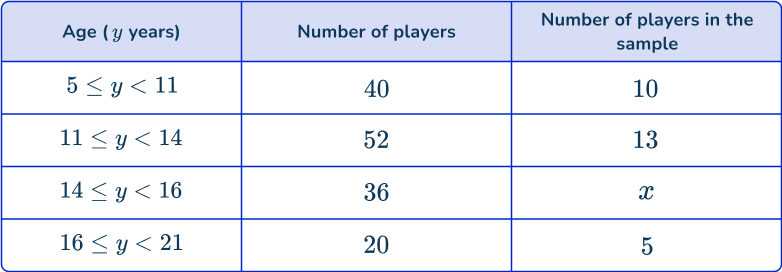


25\%\text{ of }36=\cfrac{36}{100}\times{25}=9
2. A university is hosting a film night and want to find out what genre of films the students like. They decide to take a stratified sample of students based on the distance their accommodation is from the student union. Determine how many students live in the category 3 \leq D < 5{~km}.
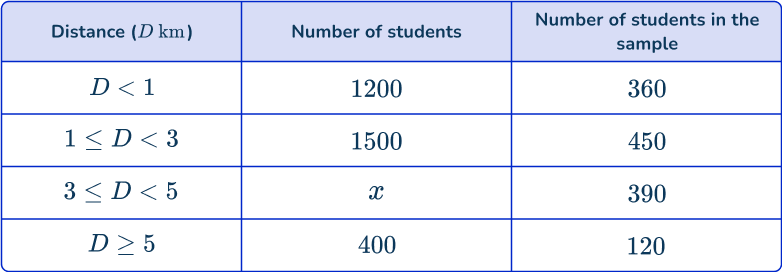
\cfrac{390}{30}\times{100}=1300 students
3. A café is investigating the popularity of hot drinks. During one week, they sell 1,400 hot drinks. A stratified sample of 60\% of the hot drink sales is taken and the results are shown in the table below. Determine an estimate for the number of cups of tea sold during that week.
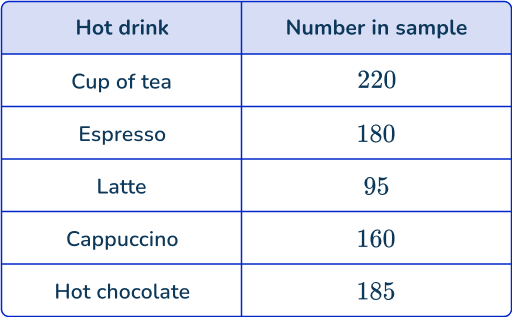
366.66 \ldots = 367 (nearest whole number)
4. A company is analyzing their stock sales from a recent launch. They have a list of all their stock in order of the number of items sold. Their stock can be divided into categories: Menswear, Womenswear, Childrenswear, and Footwear. Describe how they should take a stratified sample of 20\% to find how much of each category of clothing was sold.
Find 20\% of the total amount of stock, use a random number generator to select the first item then select every 5 th item in the list.
Split the stock list into the four categories. Calculate 20\% of each category for the sample. Use a random number generator to select the items of data.
Assign each item of data a unique reference number. Use a random number generator to select the items of data that total 20\% of the total amount.
Divide the total number of items into 4, find 20\% of each category.
- Find 20\% of the total amount of stock, use a random number generator to select the first item then select every 5 th item in the list.
Random sampling technique
- Correct answer: Split the stock list into the four categories. Calculate 20\% of each category for the sample. Use a random number generator to select the items of data.
Stratified Sampling Technique
- Assign each item of data a unique reference number. Use a random number generator to select the items of data that total 20\% of the total amount.
Systematic sampling technique
- Divide the total number of items into 4, find 20\% of each category.
Not proportional to the population
5. The table below shows the number of students in each grade level at a school.
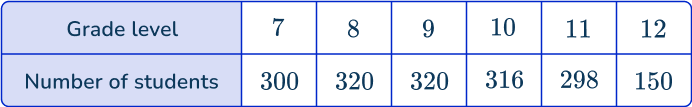
Rowan is completing a study for the school newspaper. He uses a stratified sample of 80 students according to their grade level. How many students should feature in his research from grade 9?
Find the total population:
300 + 320 + 320 + 316 + 298 + 150 =1,704
Proportion of grade 9 students = \cfrac{320}{1704}
Multiply the proportion by the sample size (80 students ):
\cfrac{320}{1704} \times 80=15.023 \ldots
So there should be 15 students featured from grade 9.
Stratified random sampling FAQs
Stratified random sampling is a method of sampling that divides a larger population into different subgroups (strata) based on specific characteristics, such as demographics (for example, age, gender, income).
A random sample is then taken from each subgroup to ensure that the final sample is representative of the population as a whole. This ensures a proportionate sampling.
Use stratified random sampling when the population of interest has distinct subgroups that might affect the outcome, you want to ensure that all groups are represented in the sample, or you need higher precision in estimating outcomes for each subgroup.
Proportional stratified sampling: The number of samples taken from each stratum is proportional to the size of the stratum in the population.
Equal stratified sampling: An equal number of samples are taken from each stratum, regardless of the size of each stratum.
A quota sample also divides the population based on shared characteristics, but unlike stratified random sampling, it doesn’t involve random selection. Instead, researchers select individuals based on pre-determined quotas for each subgroup, which can introduce bias.
In contrast, stratified random sampling ensures a more objective selection by using random sampling within each group.
The next lessons are
Still stuck?
At Third Space Learning, we specialize in helping teachers and school leaders to provide personalized math support for more of their students through high-quality, online one-on-one math tutoring delivered by subject experts.
Each week, our tutors support thousands of students who are at risk of not meeting their grade-level expectations, and help accelerate their progress and boost their confidence.

Find out how we can help your students achieve success with our math tutoring programs.
[FREE] Common Core Practice Tests (3rd to 8th Grade)
Prepare for math tests in your state with these 3rd Grade to 8th Grade practice assessments for Common Core and state equivalents.
Get your 6 multiple choice practice tests with detailed answers to support test prep, created by US math teachers for US math teachers!