High Impact Tutoring Built By Math Experts
Personalized standards-aligned one-on-one math tutoring for schools and districts
In order to access this I need to be confident with:
Calculator skills Fractions Fractions of numbers Percent of a number Quantitative dataSampling methods
Here you will learn about sampling methods, including what different sampling methods are and how to use different sampling methods.
Students will first learn about sampling methods as part of statistics and probability in 7 th grade and expand upon their knowledge in high school.
What are sampling methods?
Sampling is a statistical process where researchers select a specific number of observations from a larger population to analyze and create statistical inferences about the target population.
The sampling method is the way in which the observations are chosen and collected.
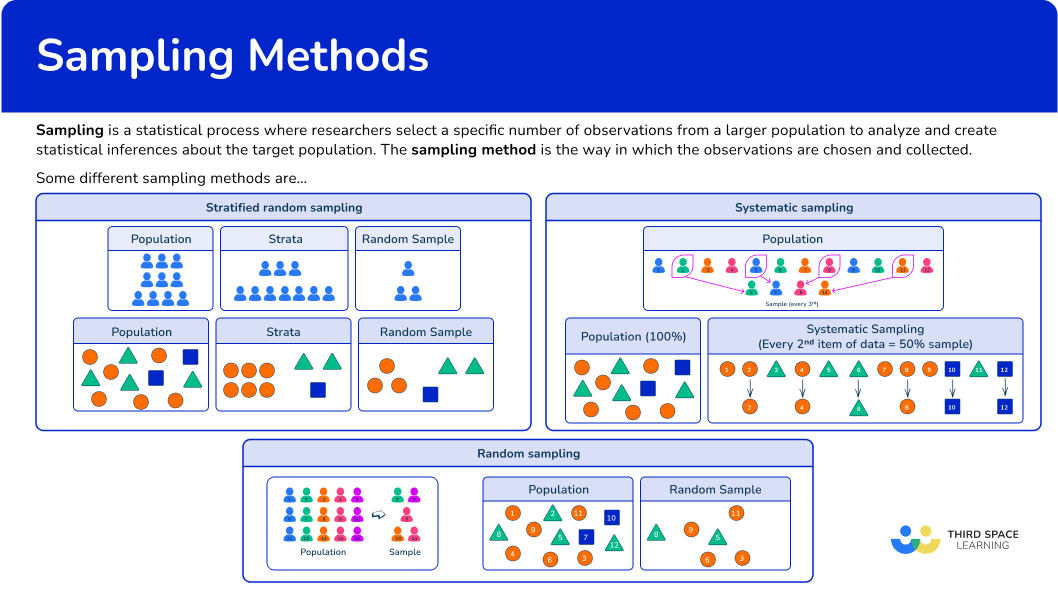
Some different types of probability sampling techniques are stratified random sampling, systematic sampling and random sampling.
Below is an overview of each methodology.
Stratified random sampling is a method that divides the population into specific groups that are smaller subgroups, or strata.
A sample is then taken from each subgroup, with the size of the sample proportionate to the subgroup’s size within the overall population.
Stratified random sampling determines the number of data items in each subgroup, but a secondary sampling method is needed to select the individual items. Typically, this is done using simple random sampling.
Advantage: This method is less time-consuming than asking the whole population
Disadvantage: Another sampling method is needed to select individual items of data from a list
Step-by-step guide: Stratified random sampling
Systematic sampling is a way to pick data items at regular intervals from a population.
To make sure everything has an equal chance of being picked, the data needs to be listed in order, called a sampling frame.
First, you use a random number generator to pick a starting item. Then, you choose the rest by counting at regular intervals.
For example,
If the population size is 1,200 and you want a sample of 300 data items, you divide 1,200 by 300 to get an interval of 4.
This means you select every 4 th item from the ordered list to include in the sample.
Advantage: This method is more time-efficient than asking the whole population
Disadvantage: Every member of the entire population must be listed
Step-by-step guide: Systematic sampling
Random sampling, also called simple random sampling, is a method used to choose items from a population via random selection.
To take a random sample, you first make a list of every person or item in the population. Then, you give each one a unique number.
Next, you use a random number generator or a random number table to pick the number of items you need for your sample.
This method ensures that every member has an equal chance of being chosen, which helps reduce bias and errors in the sample.
Advantage: This method is more time-efficient than asking the whole population
Disadvantage: Large sample sizes are usually needed to ensure the desired levels of precision and accuracy
Step-by-step guide: Random sampling
What are sampling methods?
Common Core State Standards
How does this relate to 7 th grade math and high school math?
- Grade 7 – Statistic & Probability (7.SP.A.1)
Understand that statistics can be used to gain information about a population by examining a sample of the population; generalizations about a population from a sample are valid only if the sample is representative of that population. Understand that random sampling tends to produce representative samples and support valid inferences.
- Statistics & Probability – Making Inferences & Justifying Conclusions (HS.S.IC.B.3)
Recognize the purposes of and differences among sample surveys, experiments, and observational studies; explain how randomization relates to each.
- Statistics & Probability – Making Inferences & Justifying Conclusions (HS.S.IC.B.4)
Use data from a sample survey to estimate a population mean or proportion; develop a margin of error through the use of simulation models for random sampling.
![[FREE] Probability Worksheet (Grade 7 to 12)](https://thirdspacelearning.com/wp-content/uploads/2023/07/Probability-check-for-understanding-quiz-listing-image.png)
[FREE] Probability Worksheet (Grade 7 to 12)
Use this quiz to check your grade 7 to 12 students’ understanding of probability. 15+ questions with answers covering a range of 7th to 12th grade probability topics to identify areas of strength and support!
DOWNLOAD FREE [FREE] Probability Worksheet (Grade 7 to 12)
Use this quiz to check your grade 7 to 12 students’ understanding of probability. 15+ questions with answers covering a range of 7th to 12th grade probability topics to identify areas of strength and support!
DOWNLOAD FREEHow to use sampling methods
There are a lot of ways to use sampling methods. For more specific step-by-step guides, check out the sampling methods pages linked in the “What are sampling methods?” section above or read through the examples below.
Sampling methods examples
Example 1: stratified sample
A gym created a questionnaire for its members. They want to collect a stratified sample of 20 \% of the members at the gym.
Calculate the number of members in each age group that will take part in the survey.
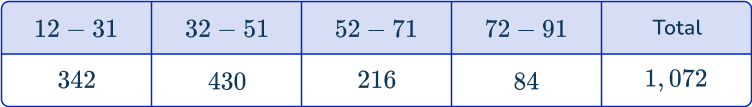
- Calculate how many items of data will be selected for the sample.
As you know that there are 1,072 members at the gym and the question asks for a sample size of 20 \%, you need to calculate 20 \% of 1,072\text{:}
1,072 \times 0.2=214.4
The number of people (members) selected cannot be a decimal. Round it to the nearest whole number, resulting in a required sample size of 214 members.
2Calculate how many items of data will be selected in each subcategory.
Now calculate 20 \% of each age group, round each value to the nearest integer, and write the values in the table:
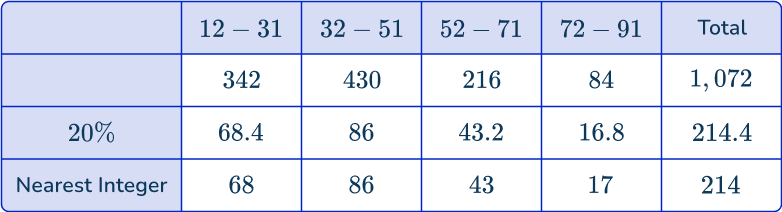
3Check that the number of items of data matches the sample size.
Adding the number of students in each grade level, you get 68+86+43+17=214 which matches the sample size.
Example 2: stratified sample
Julissa, a market researcher, is studying consumer preferences for a new product. She wants to understand the responses received from a survey.
The surveys were distributed across four regions. Below is a table showing the number of responses collected from each region:
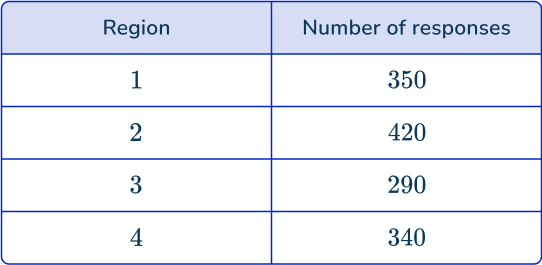
Julissa would like to take a stratified sample of 40 \% of the responses, proportional to the number of responses in each region. Determine how many responses she should collect in each region.
Let’s calculate the total responses from the survey:
350+420+290+340=1,400
As you need a sample size of 40 \%, the number of words in the sample should be:
1,400 \times 0.4=560
Now calculate 40 \% of each region and write the values below the table:
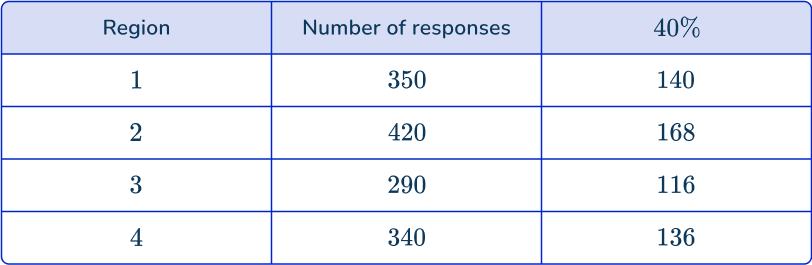
Adding the number of responses in the sample, you get 140+168+116+136=560 which matches the sample size.
Example 3: systematic sampling – production line
A factory produces 200 bottles of juice per minute. A quality control machine inspects the seal of 5 \% of the bottles.
The bottles pass through the machine one at a time on a conveyor belt. Use systematic random sampling to select the bottles for inspection over a period of 4 minutes.
Since each bottle passes through the machine one at a time, you can assume that the first bottle is number 1, the second is bottle number 2, and so on.
In 4 minutes, there will be 4 \times 200=800 bottles. As the company checks 5 \% of the bottles, you need a sample of:
800 \times 0.05=40 bottles.
Since you need 40 bottles, and you are using a systematic sample, you need to choose the bottles using a sequence.
You determine the interval in the sequence by dividing the population size (number of members of a population) by the sample size:
\text { Interval }=\cfrac{\text { Population size }}{\text { Sample size }}=\cfrac{800}{40}=20
So you need to pick every 20 th item in the ordered data set.
Since you need to pick every 20 th item, the first number in the sample (starting point of the sequence) must be randomly chosen from the first 20 terms.
Using a random number generator, you get the number 5, so you choose the first item of data in the sample to be the 5 th bottle.
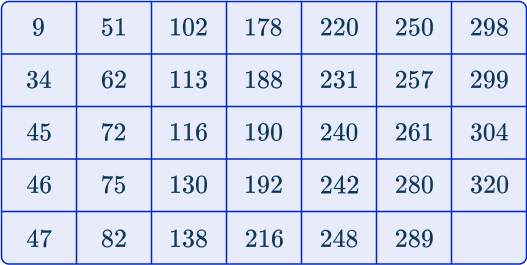
Below is a table used to show how the sequence develops*:
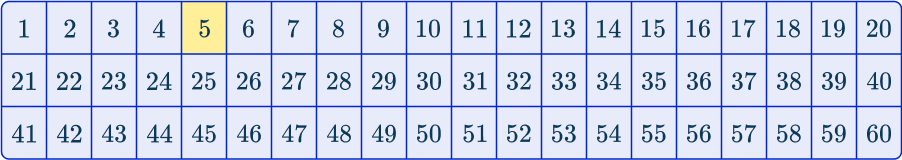
*This table only contains the first 60 bottles of the 800 in the population.
Since you are selecting every 20 th item, you can select the following bottles from the data:
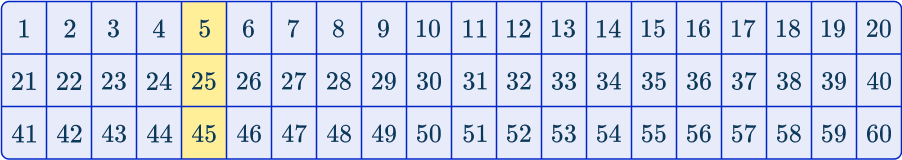
The sample will therefore contain 40 bottles with the following numbers:
5, \, 25, \, 45, \, 65, \, 85, \, 105, \, 125, \, 145, \, 165,
185, \, 205, \, 225, \, 245, \, 265, \, 285, \, 305, 325,
345, \, 365, \, 385, \, 405, \, 425, \, 445, \, 465, \, 485,
505, \, 525, \, 545, \, 565, \, 585, \, 605, \, 625, \, 645,
665, \, 685, \, 705, \, 725, \, 745, \, 765, \, 785.
Note: These numbers are in the sequence 20n-15.
Example 4: systematic sampling – smaller groups
A bookstore is analyzing the average value of online purchases over the past quarter. There were 15,320 orders placed, each with a unique transaction ID.
The bookstore decides to take a systematic sample of 3 \% of the orders. Determine which transaction IDs will be included in the sample.
Since each purchase has a unique reference number, you can order the numbers from smallest to largest, and then number each item of data from 1–15,320.
Since the bookstore is taking a sample of 3 \%, you need to calculate 3 \% of 15,320\text{:}
15,320 \times 0.03=459.6
The sample size is 460 purchases (remember to round to the nearest integer).
The interval is equal to
\text { Interval }=\frac{\text { Population size }}{\text { Sample size }}=\frac{15,320}{460}=33 \text { (nearest whole number) }
Using a random number generator, you need to select the first item of data from the first 33 purchases. The random number chosen is 22.
The first item of data in the list is the 22 nd purchase.
Since the interval is 33, the next order will be 22+33=55, then 55+33=88, then 88+33=121 \, … and so on until you have selected the 460 items of data.
The sample will therefore contain 460 items of data that belong to the sequence 33n-11.
For example, the 123 rd item of data will be order number 33\times{123}-11=4048.
Example 5: a sample of the sums of two six-sided dice
There are two fair, six-sided dice. The number rolled on the first dice and the number rolled on the second dice are added and the sum recorded. Collect a sample of 10 sums.
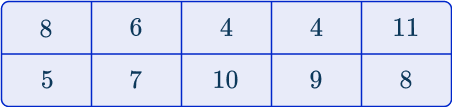
Since each dice has the numbers 1 to 6, you have the following sample space:
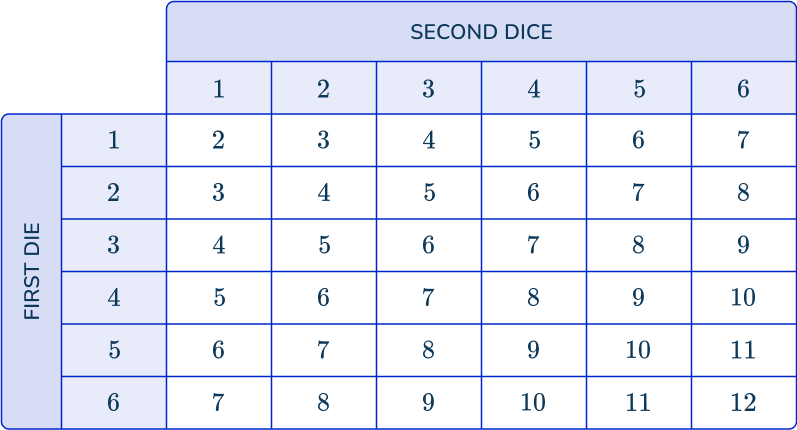
Each member of the population (each sum shown in the table) has a unique reference number.
Rolling the dice together 12 times, and allowing repetitions, you obtain the following random sample:
Example 6: student survey
A school wants to investigate what students in 11 th grade eat for lunch. The school has 341 students in 11 th grade. They want to take a sample of 10 \% of the students.
Each student is ordered alphabetically by their last name and given a unique number between 1 and 341 to represent the total number of individuals. Use a random number generator to determine the students who will participate in the investigation.
Since there are 341 students in the population, you would use a list to determine each unique reference number.
For this example, you will visualize the list without writing down all 341 numbers!
Each member of the population has a unique reference number as stated in the question so you can move on to step 3.
You need a sample of 10 \%\text{:} \, 341\times{0.1}=34.1, rounded to a random sample of 34 students. Any duplicates are ignored.
The students involved in the investigation are:
Teaching tips for sampling methods
- Expose students to real world examples that have a variety of demographics, numbers, population size and variability.
- Offer worked examples illustrating various scenarios, including differing population sizes and sampling intervals.
- After students understand the different sampling methods and how to use them, incorporate statistical software or online tools that automate the sampling process, enabling students to engage more effectively with real-world data.
Easy mistakes to make
- Confusing sampling methods
Using an inappropriate sampling method, such as systematic sampling or non-random sampling, to select data.
- Assuming one type of sampling method is always better than another
For example, some students might believe that stratified sampling is always better than simple random sampling or other methods. While it can be advantageous in many situations, it may not be the best option if the population is homogeneous or the strata show minimal differences.
- Incorrect number of items in the sample / duplicates
If a sample requires a specific number of data values, it must include exactly that number. Pay attention to whether duplicates are permitted, as some samples allow repeated values.
Practice sampling methods questions
1. A baseball league is completing research on their players. They want a stratified sample, proportional to their ages. Determine how many players will be asked in the missing category, x.
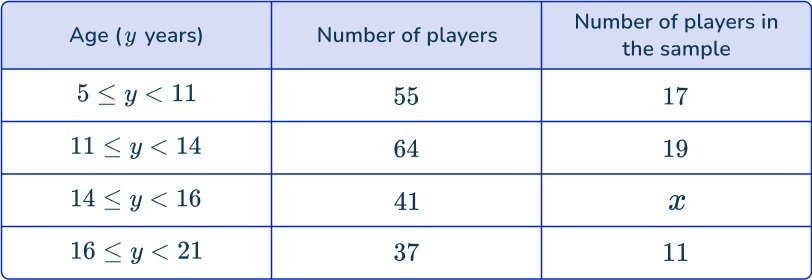


Use the given information to calculate the proportion used in the sample.
Ages 5 \leq y<11\text{:} \cfrac{17}{55} \times 100=30.91 \%
Ages 11 \leq y<14\text{:} \cfrac{19}{64} \times 100=29.69 \%
Ages 16 \leq y<21\text{:} \cfrac{11}{37} \times 100=29.73 \%
Remember that the number of players in the sample was rounded to the nearest whole, so the percentages are not exact.
All the percentages used are close to 30 \%, so this was the proportion used.
Now use this to find the missing value.
30 \% of 41=41 \times 0.3=12.3, which rounds to 12.
2. A company wants to survey 10 \% of its staff members. The company has 70 employees which are listed in alphabetical order by their last names. If the first member in the list chosen is number 2, what other members will be chosen for a systematic sample?
10 \% of 70=7, so the sample size contains 7 members of staff.
\cfrac{7}{70}=\cfrac{1}{10} so every 10 th person is chosen after person 2.
3. A blog post contains 1,200 sentences. The writer wants to analyze the average sentence complexity by taking a random sample of sentences and evaluating their structure.
Each sentence in the blog post is numbered from 1 to 1,200. Describe how you would take a random sample of 10 \% of the sentences in the blog post.
Use a random number generator to select 120 random numbers between 1 and 1,200.
Find the average word length of all 1,200 words.
Select the first word out of the first 4 words at random, then use every fourth word in the article following this.
Use the first 120 words in the article.
For a random sample of 10 \% of the words in the blog post, you need to calculate 10 \% of the population. Here, 10 \% of 1,200 is 120 words.
Since the location of each word is numbered (e.g. the first word in the above paragraph “For” would be labeled 1, \, “a” would be labeled 2, etc) you can use a random number generator to select 120 numbers out of a possible 1,200, and therefore select the 120 words for the sample.
Note that once a number is chosen for the sample, it cannot be chosen again.
4. The table below shows the number of students in each grade level at a school.
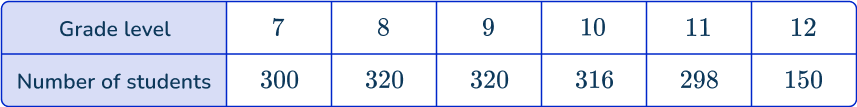
Micah is completing a study for the school newspaper. He uses a stratified sample of 80 students according to their grade level. How many students should feature in his research from grade 11?
Find the total population:
300+320+320+316+298+150=1,704
Proportion of grade 11 students =\cfrac{298}{1704}
Multiply the proportion by the sample size (80 students )\text{:}
\cfrac{298}{1704} \times 80=13.991 \ldots
So there should be 14 students featured from grade 11.
5. A field is divided into equal-sized squares. Each square is ordered from 1-220. The farmer would like to study the amount of weeds in the crop so he takes a systematic sample of 5 \% of the population.
Given that the final number in the list is square 205, determine the number of the first square in the sample.
5 \% of 220=11 items of data
\cfrac{220}{11}=20 so every 20 th item of data is chosen.
As there are 11 items of data, subtract 20 from 11-1=10 times for the remaining 10 items of data.
205-(20\times{10})=5
The first item of data is square number 5.
6. A library has 500 books on its shelves. To assess the condition of the books, the librarian wants to inspect a sample.
Describe how you would use a random sampling method to select 50 books from the collection.
Split the books into 3 groups, randomly choose a group and take the top 15 books.
Assign books numbers 1-500. Randomly select 15 unique numbers between 1 and 50.
Choose the 50 newest books from the collection.
Pick every 5 th book from the shelves.
To randomly select books, each book needs to be assigned a number 1-500.
Using a random number generator to select the 15 books in the sample, eliminates the bias and makes the sample truly random.
This would mean that each book has an equal chance of being selected for the sample. Note that once a number is chosen for the sample, it cannot be chosen again.
Sampling methods FAQs
Sampling methods are necessary because they allow researchers to study a subset of the population that is representative of the entire population.
This approach accounts for variability and saves time and money while helping researchers understand opinions, trends, or patterns without the need to examine every individual or item. It also helps eliminate sampling bias or selection bias.
Sampling error accounts for the difference between the value obtained from a sample and the true value of the population. Sampling error can be minimized with the correct research design, but variance within a population will always produce some error.
Sampling is used in research to study a smaller group that represents the whole population. It’s common in surveys, experiments, and research studies on behavior, health, or social trends.
Yes, some other types not overviewed on this page include: cluster sampling, convenience sampling, snowball sampling, purposive sampling, quota sampling and more – many of which are non-probability sampling methods used for qualitative research.
In random sampling, every individual in the population has an equal and independent chance of being selected. In systematic random sampling, a starting point is randomly chosen, and then individuals are selected at fixed intervals from that starting point.
The next lessons are
Still stuck?
At Third Space Learning, we specialize in helping teachers and school leaders to provide personalized math support for more of their students through high-quality, online one-on-one math tutoring delivered by subject experts.
Each week, our tutors support thousands of students who are at risk of not meeting their grade-level expectations, and help accelerate their progress and boost their confidence.

Find out how we can help your students achieve success with our math tutoring programs.
[FREE] Common Core Practice Tests (3rd to 8th Grade)
Prepare for math tests in your state with these 3rd Grade to 8th Grade practice assessments for Common Core and state equivalents.
Get your 6 multiple choice practice tests with detailed answers to support test prep, created by US math teachers for US math teachers!