High Impact Tutoring Built By Math Experts
Personalized standards-aligned one-on-one math tutoring for schools and districts
In order to access this I need to be confident with:
Converting fractions decimals and percentages Adding fractions Multiplying fractions Types of numbers Factors and multiples Frequency tableProbability
Here you will learn about probability, including what it is, how to represent and calculate it, and the different types of probability.
Students will first learn about probability as part of statistics and probability in 7 th grade and continue to learn more advanced topics through high school.
What is probability?
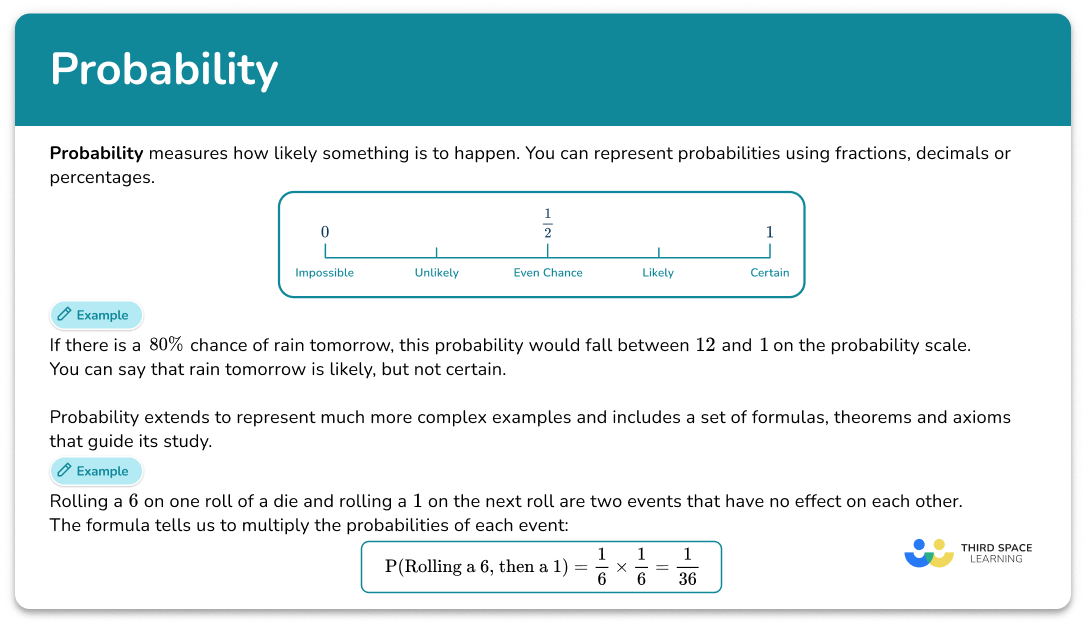
Probability measures how likely something is to happen. You can represent probabilities using fractions, decimals or percentages.
Just like other specialized topics in math, probability has its own notation, called set notation. Events are usually notated using capital letters, as well as the use of some Greek letters.
For example,
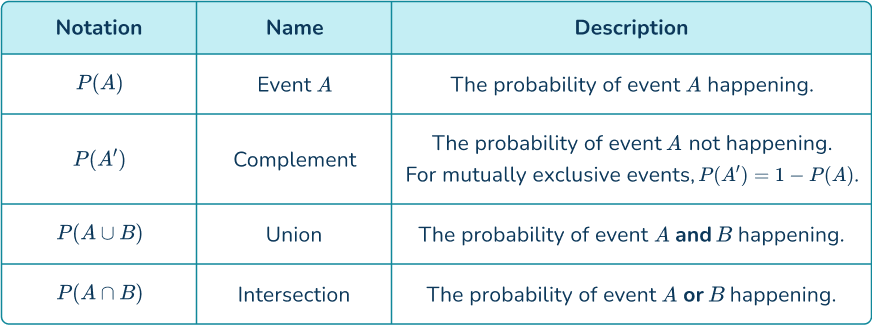
Step-by-step guide: Probability notation
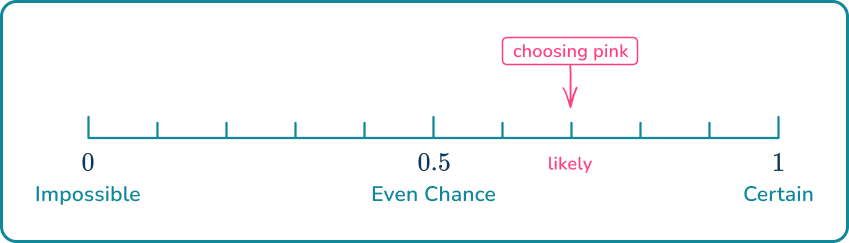
The probability of an event happening is always between 0 and 1 \, ( or 0 \% and 100 \%). The probability of an event can be placed on the probability scale, to see how likely it is that the event will happen.
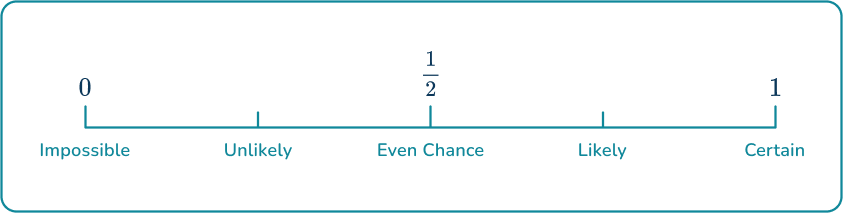
For example,
If there is a 80 \% chance of rain tomorrow, this probability would fall between \cfrac{1}{2} and 1 on the probability scale. You can say that rain tomorrow is likely, but not certain.
Step-by-step guide: Probability scale
The probability of an event happening is the ratio of the number of desired outcomes and the total number of possible outcomes. It can be calculated using the formula
\text{Probability}=\cfrac{\text{Number of desired outcomes}}{\text{Total number of outcomes}}
For example,
When flipping a fair coin, the total number of outcomes is 2 (heads or tails). So the theoretical probability of flipping heads is \cfrac{1}{2}.
Step-by-step guide: How to find probability
![[FREE] Probability Worksheet (Grade 7 to 12)](https://thirdspacelearning.com/wp-content/uploads/2023/07/Probability-check-for-understanding-quiz-listing-image.png)
[FREE] Probability Worksheet (Grade 7 to 12)
Use this quiz to check your grade 7 to 12 students’ understanding of calculating probability. 15+ questions with answers covering a range of 7th to 12th grade probability topics to identify areas of strength and support!
DOWNLOAD FREE [FREE] Probability Worksheet (Grade 7 to 12)
Use this quiz to check your grade 7 to 12 students’ understanding of calculating probability. 15+ questions with answers covering a range of 7th to 12th grade probability topics to identify areas of strength and support!
DOWNLOAD FREECompound events probability
Compound events in probability are events that occur at the same time or in succession. You can calculate the likelihood of a certain combination of outcomes.
See also: Compound probability
There are some different types of compound probability, which include:
- Mutually exclusive events – events that cannot happen at the same time.
If two events are mutually exclusive, then
P(A\text{ or }B)=P(A)+P(B) .
For example,
Rolling an even number AND a 5 on a die cannot happen at the same time.
However, rolling an even number OR a 5 can happen.
P(\text{ rolling an even number or }5)=\cfrac{3}{6}+\cfrac{1}{6}=\cfrac{4}{6}
Step-by-step guide: Mutually exclusive events
- Independent events – the outcome of two or more events have no effect on the outcome of the other events.
If two events are independent, then
P(A\text{ and }B)=P(A)\times{P(B)}.
For example,
Rolling a 6 on one roll of a die and rolling a 1 on the next roll are two events that have no effect on each other.
P(\text{Rolling a }6\text{, then a }1)=\cfrac{1}{6}\times\cfrac{1}{6}=\cfrac{1}{36}
Step-by-step guide: Independent events
- Conditional probability – is the probability of A given B has already occurred.
For example,
A bag contains 6 green marbles and 10 blue marbles. One marble is picked and it is blue. A second marble is then picked. Find the probability that the second marble is blue given that the first marble was blue.
Given that 1 blue has already been picked, there are now 9 blue marbles and 15 marbles in total.
P(2\text{nd marble is blue}\mid1\text{st marble was blue})=\cfrac{\text{ number of desired outcomes}}{\text{total number of outcomes}}=\cfrac{9}{15}
For a review of all three types of compound probability, see either of the pages linked below:
Step-by-step guide: Conditional probability
Step-by-step guide: How to calculate probability
Step-by-step guide: Probability formula
Sample spaces
There are a few different ways that the sample spaces of compound events can be represented, including tree diagrams and Venn diagrams.
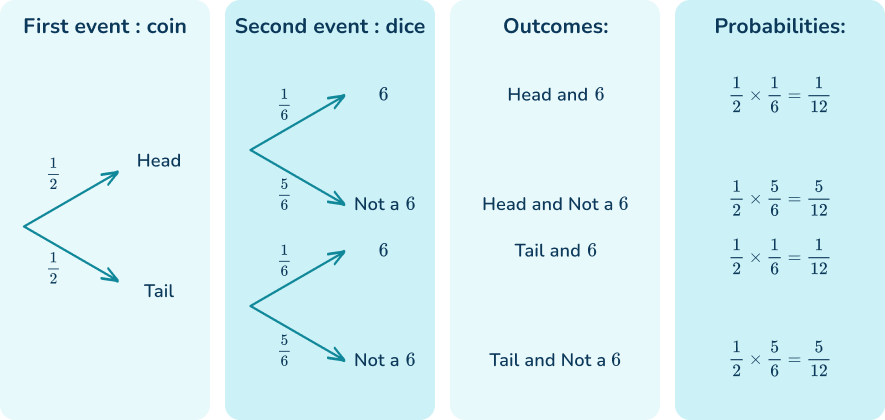
Tree diagram probability is a way of organizing the information of two or more probability events. They show all the possible outcomes and can then be used to solve probability questions.
For example,
A coin is flipped and a dice is rolled.
What is the probability of getting a ‘tail’ and a ‘6’?
Here is the tree diagram which also includes the different outcomes and their probabilities,
Tree diagrams can also be used to help solve conditional probability problems.
Step-by-step guide: Tree diagram probability
A Venn diagram is a diagrammatic representation of two or more sets.
For example,
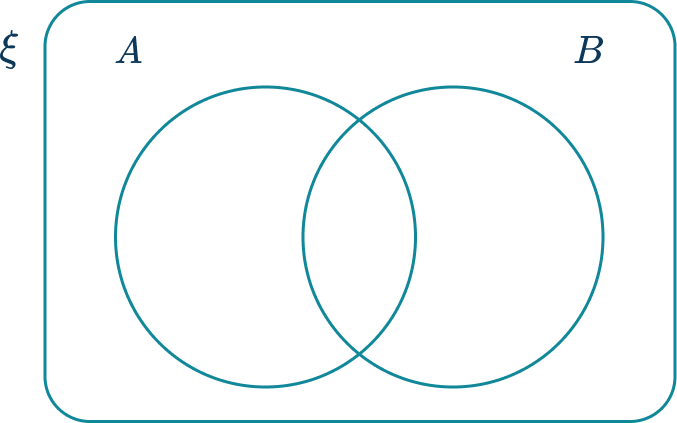
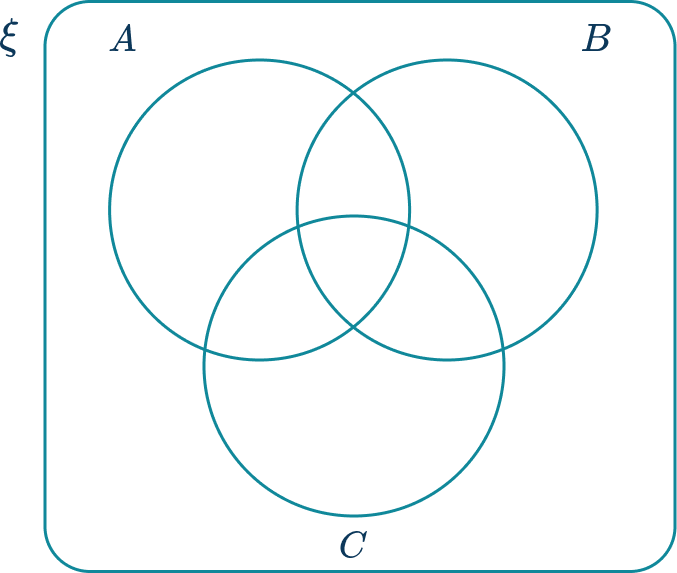
Above are examples of a two set and a three set Venn diagram with the following features:
- The universal set is a rectangle outlining the space in which all values within the smaller sets are found. The universal set is denoted using the symbol \xi.
- The set \textbf{A} , shown using a circle and labeled A.
- The set \textbf{B} , shown using a circle and labeled B.
- The set \textbf{C} , shown using a circle and labeled C (Three set Venn diagram).
- Set A and set B (and set C ) overlap, describing how items in set A can also be in set B. This is called the intersection.
Venn diagrams can also be used to help solve conditional probability problems.
Step-by-step guide: Venn diagrams
What is probability?
Common Core State Standards
How does this relate to 7 th grade math and high school math?
- Grade 7 – Statistics and Probability (7.SP.C.5)
Understand that the probability of a chance event is a number between 0 and 1 that expresses the likelihood of the event occurring. Larger numbers indicate greater likelihood.
A probability near 0 indicates an unlikely event, a probability around \cfrac{1}{2} indicates an event that is neither unlikely nor likely, and a probability near 1 indicates a likely event.
- Grade 7 – Statistics and Probability (7.SP.C.7)
Develop a probability model and use it to find probabilities of events. Compare probabilities from a model to observed frequencies; if the agreement is not good, explain possible sources of the discrepancy.
- Statistics and Probability – Conditional Probability and the rules of Probability (HS.S-CP.A.2)
Understand that two events A and B are independent if the probability of A and B occurring together is the product of their probabilities, and use this characterization to determine if they are independent.
- Statistics and Probability – Conditional Probability and the rules of Probability (HS.S-CP.A.3)
Understand the conditional probability of A given B as P(A\text{ and } B) \div P(B), and interpret independence of A and B as saying that the conditional probability of A given B is the same as the probability of A, and the conditional probability of B given A is the same as the probability of B.
- Statistics and Probability – Conditional Probability and the rules of Probability (HS.S-CP.B.6)
Find the conditional probability of A given B as the fraction of B’s outcomes that also belong to A, and interpret the answer in terms of the model.
- Statistics and Probability – Conditional Probability and the rules of Probability (HS.S-CP.B.7)
Apply the Addition Rule, P(A\text{ or } B)=P(A)+P(B) \, – \, P(A\text{ and }B), and interpret the answer in terms of the model.
- Statistics and Probability – Conditional Probability and the rules of Probability (HS.S-CP.B.8)
Apply the general Multiplication Rule in a uniform probability model, P(A\text{ and } B)=P(A)P(B \mid A)=P(B)P(A \mid B), and interpret the answer in terms of the model.
How to use probability
There are a lot of ways to use probability. For more specific step-by-step guides, check out the probability pages linked in the “What is probability?” section above or read through the examples below.
Probability examples
Example 1: understanding probability notation
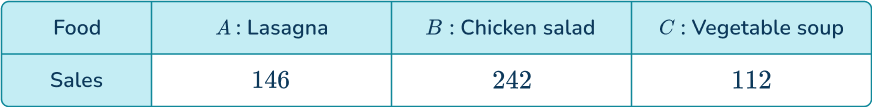
A school cafeteria records what their students ate on Monday at lunch. This data is used to predict what students will buy the next Monday.
Calculate P(A\cup{C}).
- Identify the event(s) needed.
The outcomes are lasagna or vegetable soup.
2Identify how many possible outcomes there are.
The total students is 146+242+112=500.
3Identify how many times the event(s) occur.
Event \text{A:} \, 146
Event \text{C:} \, 112.
146+112=258
There are a total of 258 possible outcomes.
4Write this as a probability.
P(A\cup{C})=\cfrac{258}{500}.
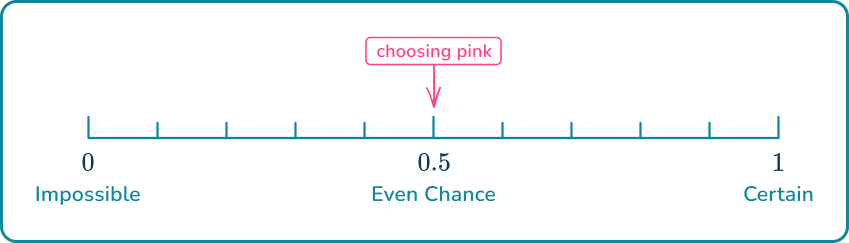
Example 2: placing events on a probability scale
There are 12 marbles in a bag.
6 marbles are yellow.
4 marbles are green.
2 marbles are red.
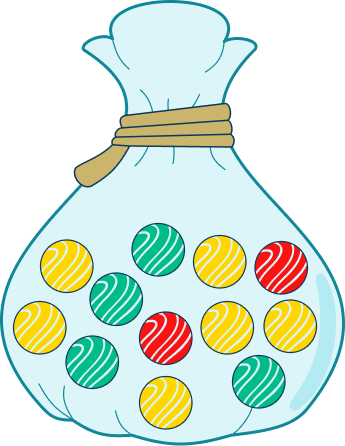
The probability that Lucas randomly chooses a yellow marble is \cfrac{6}{12} or \cfrac{1}{2}.
On the probability scale, mark the probability.

The mathematical probability is given.
Visualize where \cfrac{1}{2} would fall on the number line.
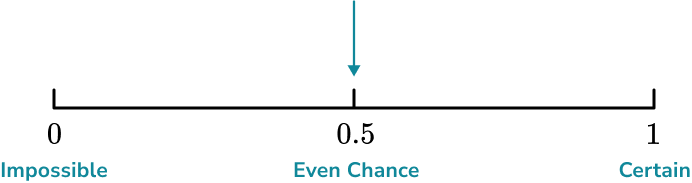
Since this event falls in the exact middle, the outcomes of a randomly chosen marble being yellow or not are equally likely events.
Example 3: probability of two independent events
The probability that Tom forgets his homework is 0.25. The probability that Noah forgets his homework is 0.3. The events are independent. Calculate the probability that both Tom and Noah forget their homework on the same day.
You are told in the question that the events are independent.
The first event is that Tom forgets his homework. The probability that Tom forgets his homework is 0.25.
The second event is that Noah forgets his homework. The probability that Noah forgets his homework is 0.3.
The probability that Tom and Noah both forget their homework is
0.25\times{0.3}=0.075 or 7.5 \%
Example 4: probability of three mutually exclusive events
A card is drawn from a standard deck of cards. Calculate the probability of a 2, \, 3, or face card (Jack, Queen, or King) being picked.
If you are picking one card, you cannot pick a 2, \, 3, and a face card at the same time, so the events are mutually exclusive.
The probability of picking a 2 is \cfrac{4}{52}.
The probability of picking a 3 is \cfrac{4}{52}.
The probability of picking a face card is \cfrac{12}{52}.
The probability of a 2, \, 3, or face card (Jack, Queen, or King) being picked is the sum of the probabilities:
\cfrac{4}{52}+\cfrac{4}{52}+\cfrac{12}{52}=\cfrac{20}{52}.
Example 5: probability of two events using a tree diagram
There are 12 socks in a drawer. 4 are white and 8 are black. William picks one sock and then picks a second sock. Find the probability that both socks are black.
You can draw a tree diagram to represent the possible outcomes:
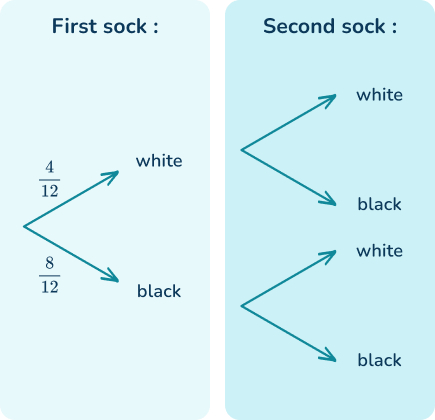
Since there are 12 socks to begin with, 4 of them white and 8 black, the probability of picking a black sock on the first pick is \cfrac{4}{12} and the probability of picking a black sock is \cfrac{8}{12}.
The probabilities for the second pick need to be calculated given the condition that the first pick has already occurred.
Let’s first assume that the first pick was a white sock. If a white sock has already been picked there are now 3 white socks and 8 black socks. There are now 11 socks left altogether.
P\text{(Event)}=\cfrac{\text{number of desired outcomes}}{\text{total number of outcomes}}
P(\text{White sock})=\cfrac{3}{11}
P(\text{Black sock})=\cfrac{8}{11}
Now let’s assume the first sock was black. If a black sock has already been picked there are now 4 white socks and 7 black socks. There are now 11 socks left altogether.
P\text{(Event)}=\cfrac{\text{number of desired outcomes}}{\text{total number of outcomes}}
P(\text{White sock})=\cfrac{4}{11}
P(\text{Black sock})=\cfrac{7}{11}
You can now fill the rest of the tree diagram:
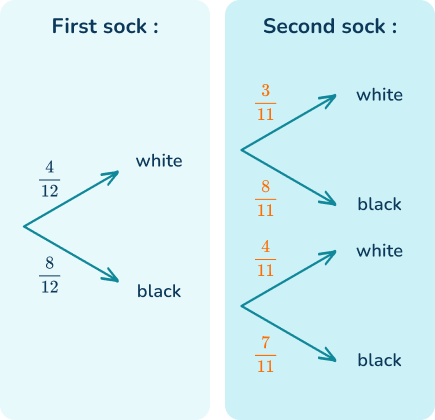
To find the joint probability that both socks are black you use
P(A\cap{B})=P(A)\times{P(B)} which is the multiplication rule of probability.
\begin{aligned}P(\text { Black and Black })&=\cfrac{8}{12}\times\cfrac{7}{11} \\\\ &=\cfrac{56}{132} \end{aligned}
Example 6: probability with a venn diagram
50 student athletes were asked if they play volleyball (V) or ping pong (P). The results are shown in the Venn diagram below.
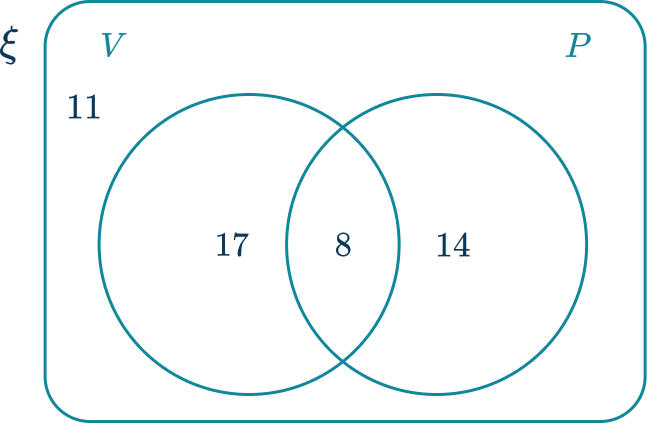
Calculate the probability of selecting a student athlete at random that can only play volleyball.
The subset of student athletes that can only play volleyball:
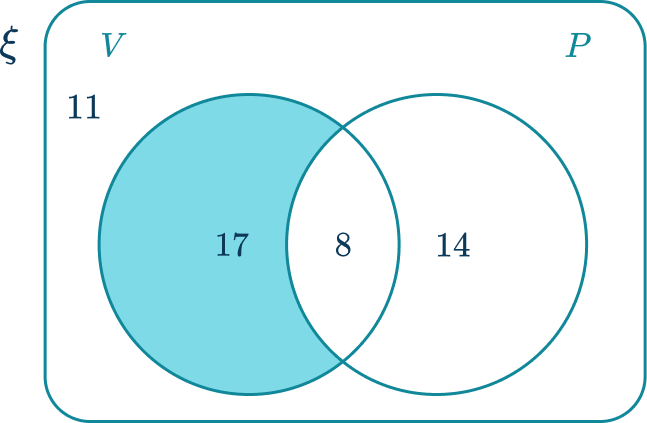
The frequency of student athletes that only play volleyball is 17.
The larger set is every student athlete. Calculate this by adding all the sections together, 11+17+8+14=50.
The probability of picking a student athlete at random that can only play the volleyball is \cfrac{17}{50}.
Teaching tips for probability
- Start by introducing the topic through applications of probability, instead of just asking students to complete worksheets and memorize formulas. This can include playing games of chance (such as coin tosses), performing random experiments or studying real world topics, like weather forecasting.
- Emphasize probability models, such as probability tree diagrams and tables, before introducing the formulas for calculating the probability of the event.
Easy mistakes to make
- Probabilities greater than \bf{1}
The probabilities of all outcomes of an event will always add up to one.
Therefore a probability as a decimal cannot be greater than 1 or a fraction cannot be improper. For example, 1.4 or \cfrac{6}{5} cannot be probabilities.
- Adding probabilities instead of multiplying them
For independent events, the rule is P(A\text{ and }B)=P(A)\times{P(B)}. For mutually exclusive events, the rule P(A\text{ or }B)=P(A)+P(B). When students are taught the rules in isolation, they are more likely to confuse them. Always give students opportunities to explore the foundations of a rule or formula, before introducing it to students.
- Multiplying or dividing fractions incorrectly
To multiply fractions, multiply the numerators and multiply the denominators.
To divide fractions, change the second one to its reciprocal, then multiply.
- Adding fractions incorrectly
Remember, fractions can only be added or subtracted if they have a common denominator.
Practice probability questions
1. A fair six-sided dice is rolled.

Event A is the dice landing on an odd number.
Event B is the dice landing on ‘2’.
Calculate P(A\cup{B}).


The notation P(A\cup{B}) means the probability of the outcome being in event A, or B, or both.
There are three odd numbers and one ‘2’.
Therefore there are 4 possible outcomes that satisfy event A, event B, or both.
There are 6 outcomes in total. So, P(A\cup{B})=\cfrac{4}{6}.
2. The probability that a pink marble is picked from the bag below is \cfrac{1}{5}. Show where this belongs on the probability scale.
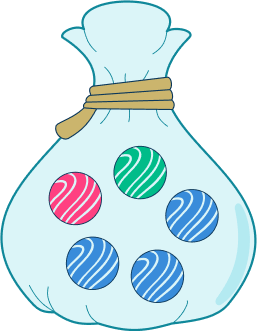
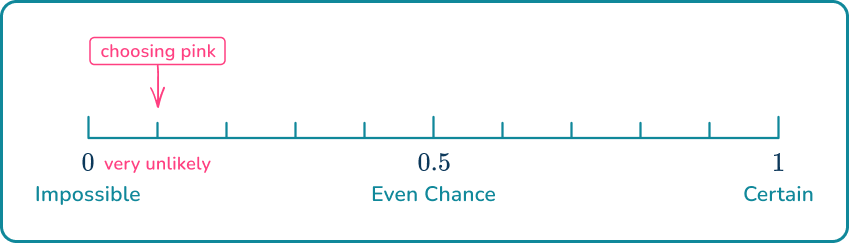
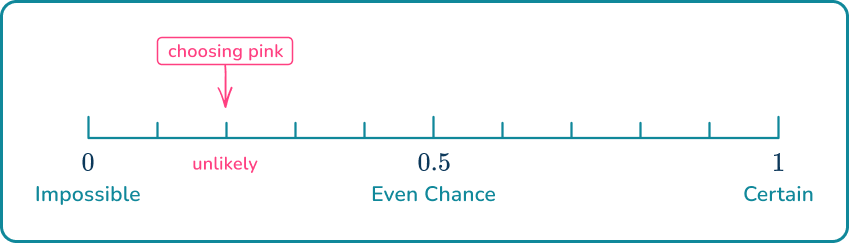
The blue number line below shows fifths.

\cfrac{1}{5} \, ( or \cfrac{2}{10}) is close to 0, so it is unlikely.
3. The probability that my train is late on any given day is \cfrac{1}{10}. Find the probability that my train is late three days in a row.
The events are independent, because one outcome does not affect the other.
The probability that the train is late on any one day is \cfrac{1}{10}.
The probability that the train is late on day 1 and day 2 and day 3 is
\cfrac{1}{10}\times\cfrac{1}{10}\times\cfrac{1}{10}=\cfrac{1}{1,000}.
4. Taran has a box of chocolates containing milk, white and dark chocolates. The probability of picking a milk chocolate from the box is \cfrac{1}{3} and the probability of picking a milk chocolate or a white chocolate is \cfrac{4}{7}.
What is the probability of picking a white chocolate from the box?
The events are mutually exclusive therefore P(A\text{ or }B)=P(A)+P(B).
\begin{aligned}\cfrac{4}{7}&=\cfrac{1}{3}+P(W) \\\\ \cfrac{4}{7}-\cfrac{1}{3}&=P(W) \\\\ P(W)&=\cfrac{12}{21}-\cfrac{7}{21} \\\\ &=\cfrac{5}{21} \end{aligned}
5. Amare has the following cards
![]()
Amare picks two cards. The first card is an A. Find the probability that the second card is a C.
If one A has already been picked, there will be one A left. There will be 7 cards left in total.
The probability that the second card is a C is \cfrac{2}{7}.
6. A local pharmacy is carrying out some research. They would like to find out how many people have had one of the following three symptoms of flu:
- H= {Headache}
- C= {Cough}
- F= {Fever}
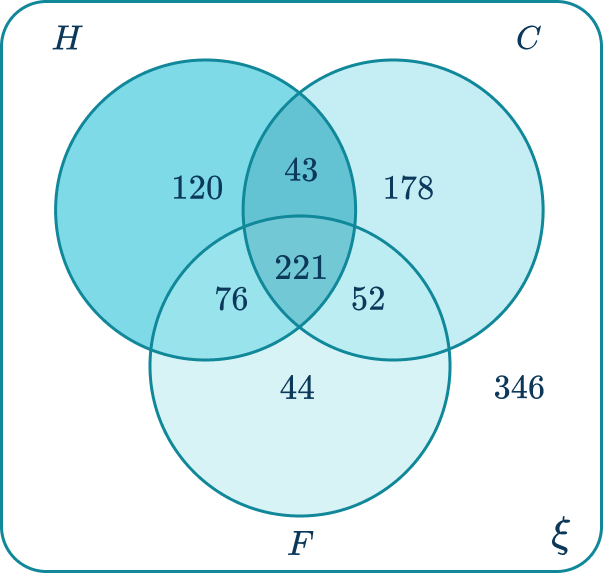
Calculate the frequency of people who had a cough or headache, but not a fever.
178 people had a cough only. 120 people had a headache only. 43 people had a cough and a headache, but not a fever.
The number of people that had a cough or headache, but not a fever is 178+120+43=341.
Probability FAQs
The branch of mathematics that deals with the likelihood of events.
Yes, theoretical probability is the theoretical calculation of the likely outcomes of event(s) and experimental probability is the actual outcome given by an experiment.
The normal distribution is a continuous probability distribution. It is symmetric around its mean and the majority of values are clustered around the center.
A permutation is a representation of all the ways a set can be arranged.
The next lessons are
- Probability distribution
- Units of measurement
Still stuck?
At Third Space Learning, we specialize in helping teachers and school leaders to provide personalized math support for more of their students through high-quality, online one-on-one math tutoring delivered by subject experts.
Each week, our tutors support thousands of students who are at risk of not meeting their grade-level expectations, and help accelerate their progress and boost their confidence.

Find out how we can help your students achieve success with our math tutoring programs.
[FREE] Common Core Practice Tests (3rd to 8th Grade)
Prepare for math tests in your state with these 3rd Grade to 8th Grade practice assessments for Common Core and state equivalents.
Get your 6 multiple choice practice tests with detailed answers to support test prep, created by US math teachers for US math teachers!