High Impact Tutoring Built By Math Experts
Personalized standards-aligned one-on-one math tutoring for schools and districts
In order to access this I need to be confident with:
Fractions Decimals Probability notation Probability scale How to calculate probabilityTree diagram probability
Here you will learn about tree diagrams in probability, including what they are and how to complete them. You will also look at calculating probabilities using tree diagrams.
Students will first learn about tree diagram probability as part of statistics and probability in 7 th grade and continue to learn about it in high school.
What is tree diagram probability?
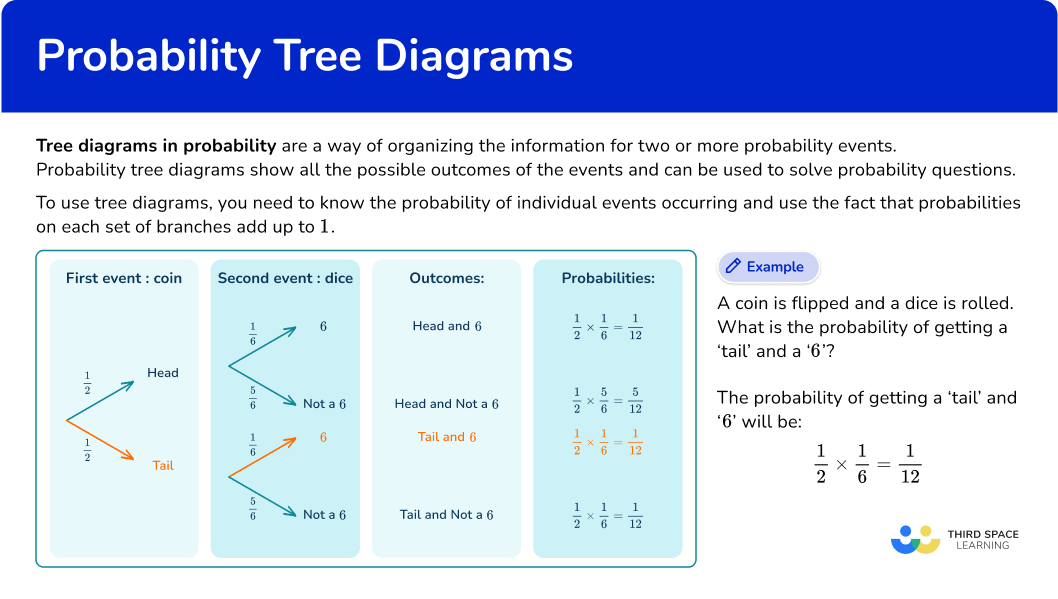
Tree diagram probability is a way of organizing the information for two or more probability events. Probability tree diagrams show all the possible outcomes of the events and can be used to solve probability questions.
A simple tree diagram has branches that match each outcome.
For example,
A coin is flipped and a dice is rolled.
What is the probability of getting a ‘tail’ and a ‘6’?
The first event is flipping the coin. The two possible outcomes are ‘heads’ and ‘tails’.
These are mutually exclusive events. They cannot happen at the same time.
The second event is rolling the dice. The possible outcomes are ‘1’, ‘2’, ‘3’, ‘4’, ‘5’ and ‘6’.
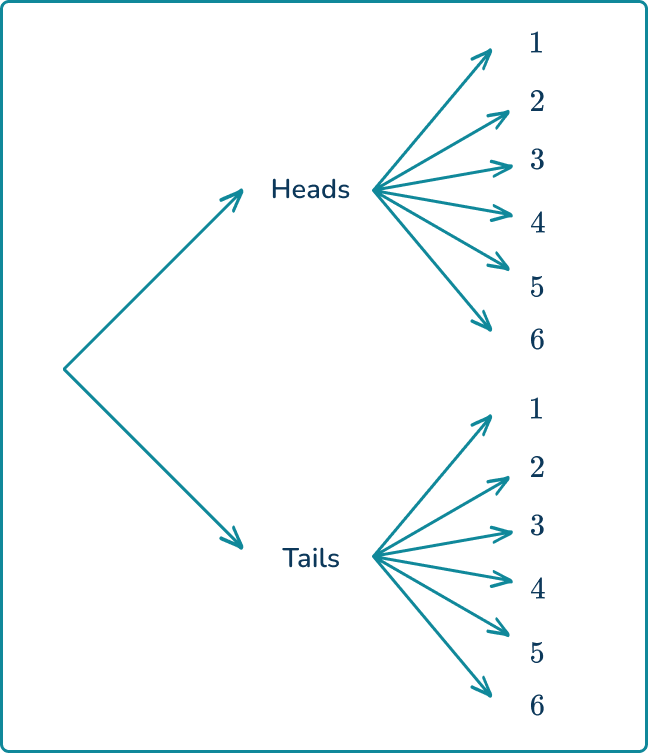
The tree diagram shows 12 possible outcomes and each has an equal chance. Only one of the outcomes is tails and then 6, so the probability is \cfrac{1}{12}.
To avoid writing out each outcome, you can create a more efficient tree diagram that utilizes probability calculations and rules.
For example,
A coin is flipped and a dice is rolled.
What is the probability of getting a ‘tail’ and a ‘6’?
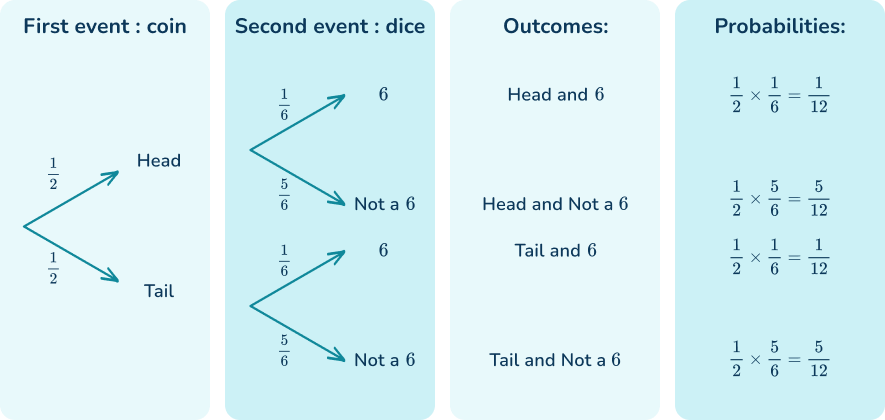
Since the question is only interested in ‘6’, so you can have a ‘6’ branch and a ‘not a 6 ’ branch.
These outcomes can occur whether the coin landed on heads or tails, so add these outcomes to the end of both branches, with the probabilities written along the branches.
The probabilities of the events can be written as fractions or decimals. For individual events occurring the probabilities on each set of branches add up to \bf{1}.
The probability of getting a ‘6’ is \cfrac{1}{6}.
The probability of getting ‘not a 6 ’ will be 1-\cfrac{1}{6} = \cfrac{5}{6}.
Remember that the probabilities on each set of branches add up to \bf{1}.
You want the probability of getting a tail and a 6 , so follow the path that shows a tail and a 6.
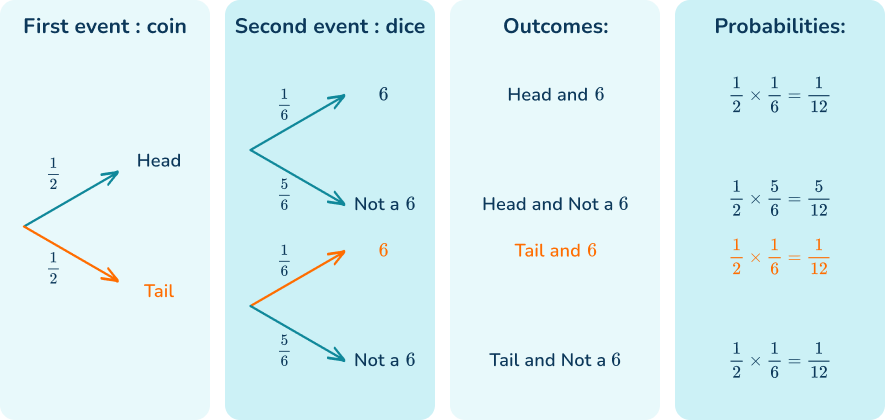
The AND rule for probability states that for independent events,
\text{P(A and B) }=\text{P(A)} \times \text{P(B)}
Taking the probabilities from the corresponding branches of the tree diagram, you get:
The probability of getting a ‘tail’ and a ‘6’ is:
\cfrac{1}{2}\times \cfrac{1}{6}=\cfrac{1}{12}
What is tree diagram probability?
![[FREE] Probability Worksheet (Grade 7 to 12)](https://thirdspacelearning.com/wp-content/uploads/2023/07/Probability-check-for-understanding-quiz-listing-image.png)
[FREE] Probability Worksheet (Grade 7 to 12)
Use this quiz to check your grade 7 to 12 students’ understanding of probability. 15+ questions with answers covering a range of 7th to 12th grade probability topics to identify areas of strength and support!
DOWNLOAD FREE [FREE] Probability Worksheet (Grade 7 to 12)
Use this quiz to check your grade 7 to 12 students’ understanding of probability. 15+ questions with answers covering a range of 7th to 12th grade probability topics to identify areas of strength and support!
DOWNLOAD FREECommon Core State Standards
How does this relate to 7 th grade math and high school math?
- Grade 7 – Statistics and Probability (7.SP.C.8)
Find probabilities of compound events using organized lists, tables, tree diagrams, and simulation.
- Statistics and Probability – Conditional Probability and the rules of Probability (HS.S-CP.B.6)
Find the conditional probability of A given B as the fraction of B’ s outcomes that also belong to A, and interpret the answer in terms of the model.
- Statistics and Probability – Conditional Probability and the rules of Probability (HS.S-CP.B.7)
Apply the Addition Rule, P(A \text { or } B) = P(A) + P(B) \, – \, P(A \text { and } B), and interpret the answer in terms of the model.
- Statistics and Probability – Conditional Probability and the rules of Probability (HS.S-CP.B.8)
Apply the general Multiplication Rule in a uniform probability model, P(A \text { and } B) = P(A)P(B|A) = P(B)P(A|B), and interpret the answer in terms of the model.
How to draw a simple tree diagram to find probability
In order to use a tree diagram to find probability:
- Create a set of branches for the first event, showing all possible outcomes.
- Continue to add sets of branches for each event, showing all possible outcomes.
- Find the probability of those outcomes by creating a ratio.
Probability tree diagrams examples
Example 1: two independent events
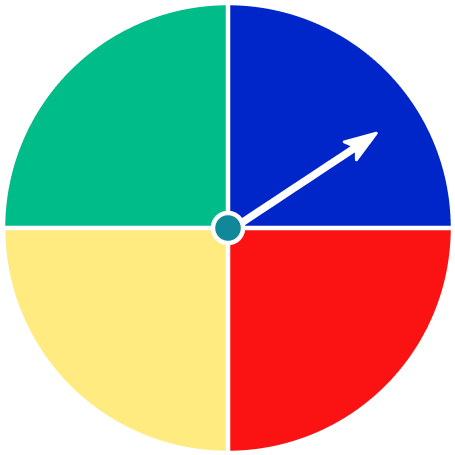
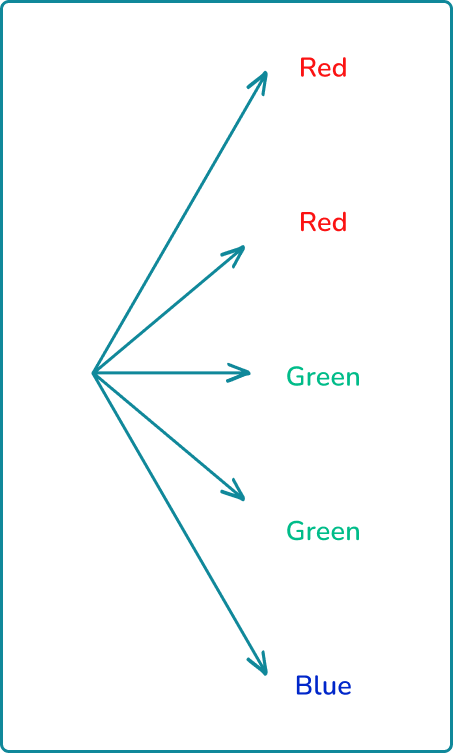
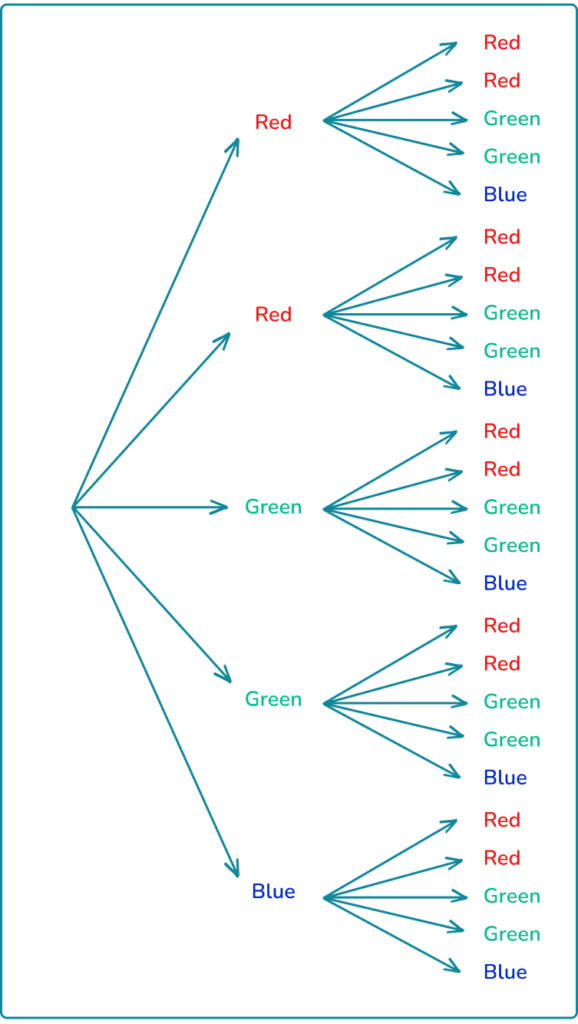
The spinner above is spun twice.
Show a tree diagram for all possible outcomes.
Then state the probability for spinning red both times.
- Create a set of branches for the first event, showing all possible outcomes.
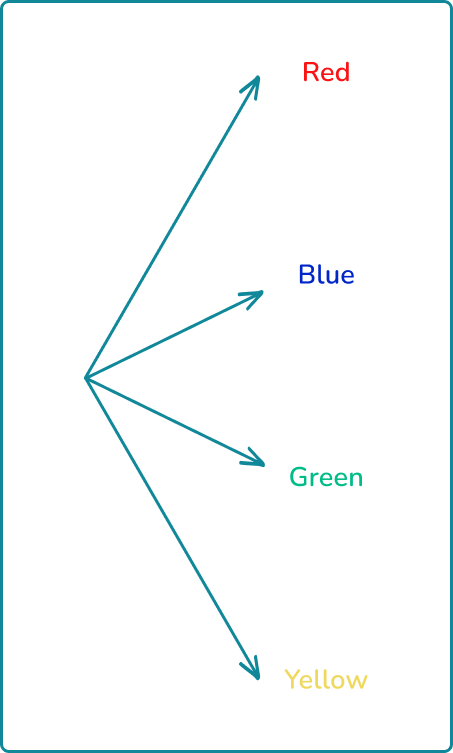
The area of each color is the same on the spinner, so each outcome has the same probability of being spun.
2Continue to add sets of branches for each event, showing all possible outcomes.
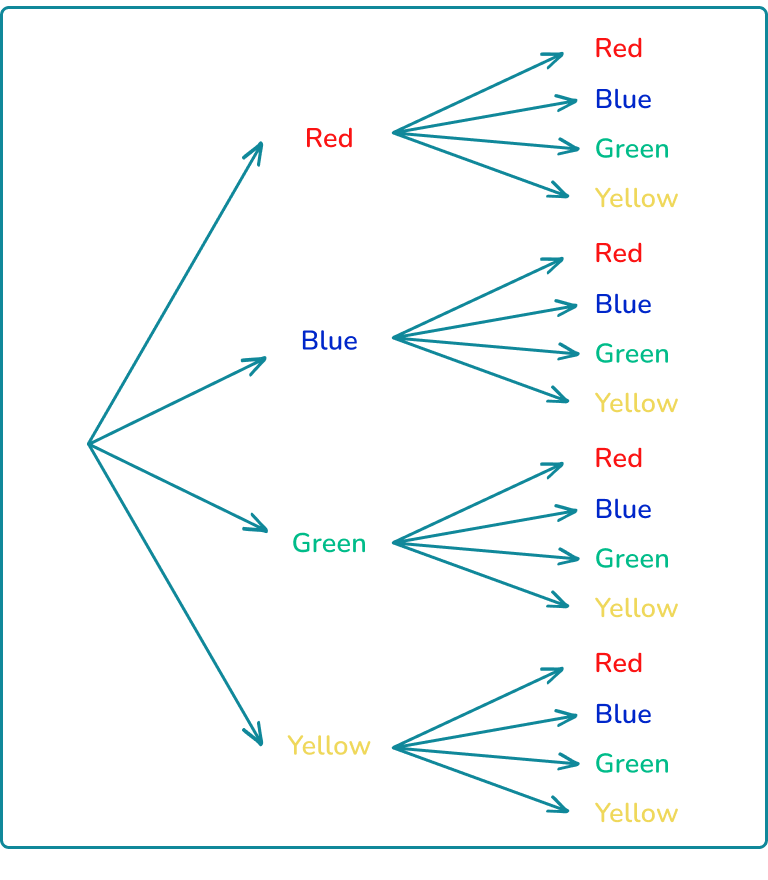
3Find the probability of those outcomes by creating a ratio.
\text { Probability }=\cfrac{\text { desired outcome }}{\text { total possible outcomes }}=\cfrac{1}{16}
Example 2: two independent events
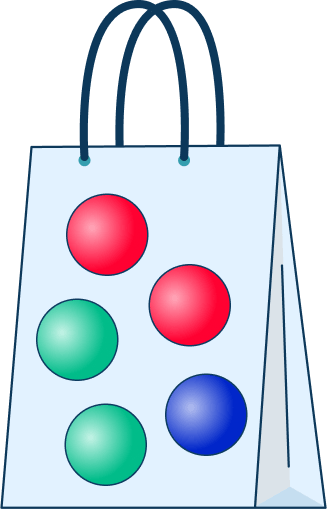
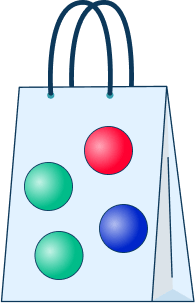
A marble is removed at random from the bag above and the color noted.
The marble is replaced.
A second marble is removed at random and the color is noted.
Complete the tree diagram.
Calculate the probability that there will be marbles of different colors.
\text { Probability }=\cfrac{\text { desired outcome }}{\text { total possible outcomes }}=\cfrac{16}{25}
How to use a tree diagram to find probability using rules
In order to use a tree diagram to find probability using rules:
- Fill in the probabilities on the branches.
- Consider which outcomes are required to answer the question.
- Find the probability of those outcomes by multiplying along the branches.
- Use the probability/probabilities you have calculated to answer the question.
Probability tree diagrams examples
Example 3: two independent events
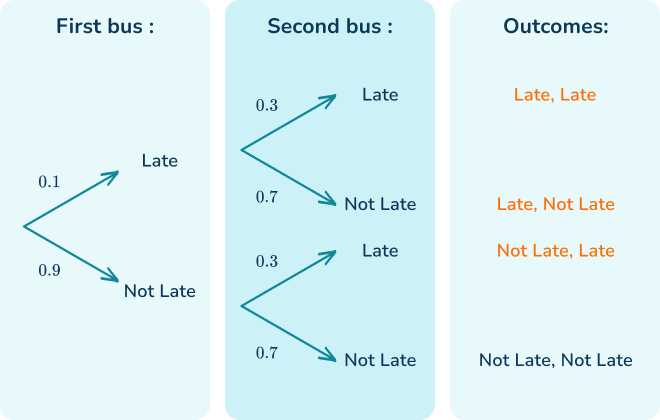
Mary has to catch 2 buses to work. The probability the first bus will be late is 0.1 and the probability the second bus will be late is 0.3.
Complete the tree diagram.
Calculate the probability that at least one bus will be late.
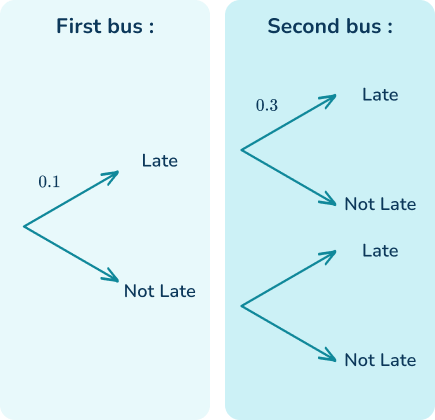
Use the given probability to calculate the probability of the first bus NOT being late.
P(\text{NOT late})=1-P(\text{late})=1-0.1=0.9
Fill in the missing probability for the first bus on the tree diagram.
Since the probability of the second bus being late is different, use different probabilities for the second set of branches.
P(\text{NOT late})=1-P(\text{late})=1-0.3=0.7
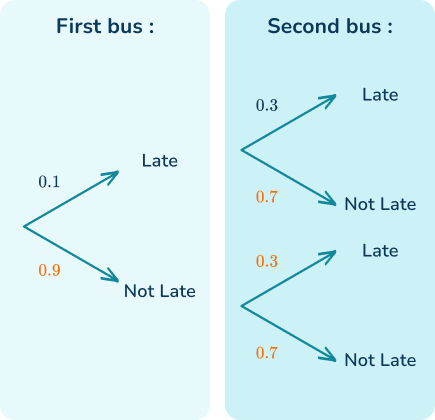
The question asks about at least one of the buses being late. So we need to look at one bus late or both buses are late.
\begin{aligned}& \text{P(Late and late): } 0.1 \times 0.3=0.03 \\\\ &\text{P(Late and not late): } 0.1 \times 0.7 =0.07 \\\\ &\text{P(Not late and late): } 0.9 \times 0.3=0.27 \end{aligned}
\begin{aligned} P(\text{at least one bus late)} &= P(\text{Late, Late}) \, or \, P(\text{Late, Not late}) \, or \, P(\text{Not late, Late}) \\\\ &= P(\text{Late, Late})+P(\text{Late, Not late})+P(\text{Not late, Late}) \\\\ &=0.03+0.07+0.27 \\\\ &=0.37 \end{aligned}
The calculation is also shown at the end of the branches.
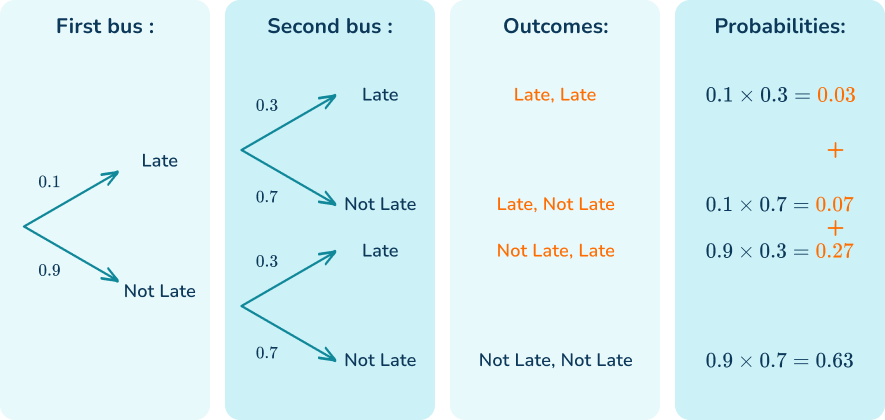
The probability that at least one bus will be late is 0.37.
Alternatively:
You could have found the probability of at least one bus being late a different way.
\begin{aligned}P(\text{at least one late}) &=1- P(\text{NONE late}) \\\\ &= 1-(0.9\times 0.7) \\\\ &=1-0.63 \\\\ &=0.37 \end{aligned}
Example 4: dependent events
There are 9 pencils in a bag. 3 of the pencils are blue and the remaining pencils are yellow. A pencil is taken out at random.
A second pencil is taken at random.
Complete the tree diagram.
Work out the probability that two blue pencils are chosen.
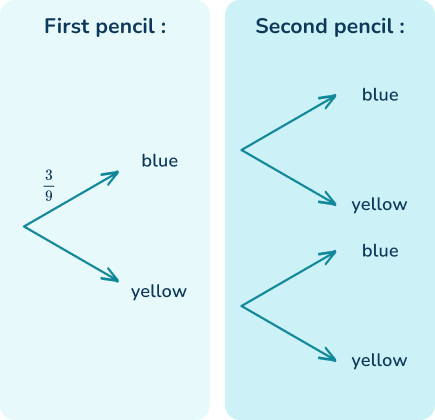
You have been given the probability of the first pencil being blue. Use it to calculate the probability of the first pencil being yellow. Do not reduce the fraction.
P(\text{yellow})=1-P(\text{blue})=1-\cfrac{3}{9}=\cfrac{6}{9}
Fill in the missing probability for the first pick.
Since the pencil which is picked is NOT replaced, you need different probabilities for the second set of branches. These probabilities change depending on whether the first pencil is blue or yellow.
If the first pencil is blue, there will be 8 pencils left, 2 blue and 6 yellow.
If the first pencil is yellow, there will be 8 pencils left, 3 blue and 5 yellow.
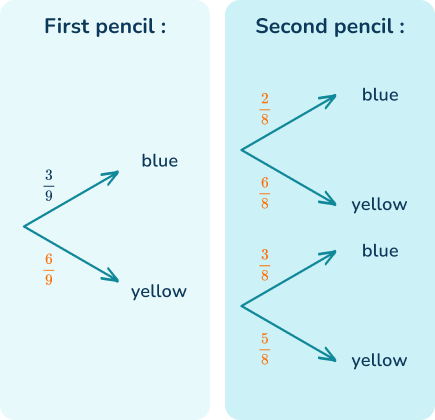
The question asks about both pencils being blue. Let’s look at this part of the tree diagram.
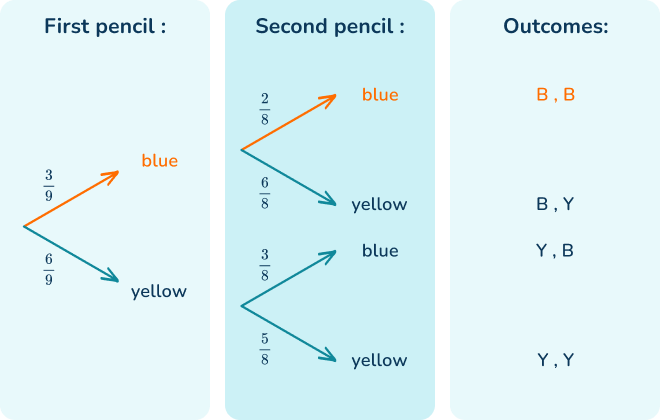
The probability of picking two blue pencils is:
\begin{aligned}P(\text { blue and blue })&=P(\text { blue }) \times P(\text { blue }) \\\\ &=\cfrac{3}{9} \times \cfrac{2}{8} \\\\ &=\cfrac{6}{72} \\\\ &=\cfrac{1}{12} \end{aligned}
The probability that both pencils chosen will be blue is \cfrac{1}{12}.
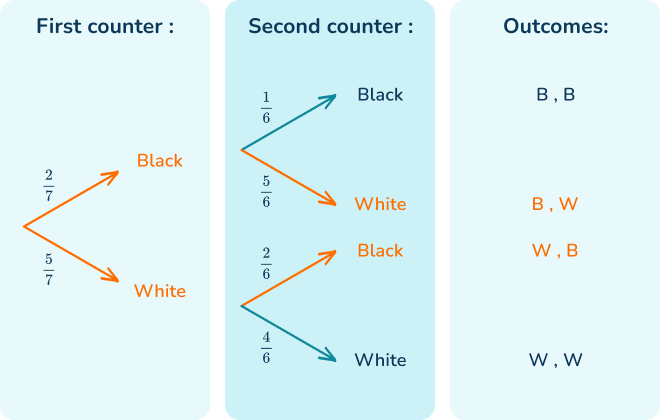
Example 5: dependent events
In a bag there are 7 counters. There are 2 black counters and the remaining counters are white.
A counter is removed and the color noted.
The counter is NOT replaced.
A second counter is removed and the color is noted.
Complete the tree diagram.
Calculate the probability that there will be one counter of each color picked.
You have been given the probability of picking a black counter. Use it to fill in the probability of picking a white counter.
P(\text{white})=1-P(\text{black})=1-\cfrac{2}{7}=\cfrac{5}{7}
So, you can fill in the missing probability for the first counter. Since the counter which is picked is NOT replaced, you need different probabilities for the second set of branches. These probabilities change depending on whether the first counter is white or black.
If one black counter has been picked, there will be 6 counters left, 1 black and 5 white.
If one white counter has been picked, there will be 6 counters left, 2 black and 4 white.
The question asks about one of each color counter so look for any paths which give one counter of each color.
\begin{aligned}& \text{P(Black and white): } \cfrac{2}{7} \times \cfrac{5}{6} = \cfrac{10}{42} \\\\ & \text{P(White and black): } \cfrac{5}{7} \times \cfrac{2}{6} = \cfrac{10}{42} \end{aligned}
For the probability of the overall probability, calculate the sum of the probabilities.
\begin{aligned}P(\text { one of each color }) & =P(B, W) \text { or } P(W, B) \\\\ & =P(B, W)+P(W, B) \\\\ & =\cfrac{10}{42}+\cfrac{10}{42} \\\\ & =\cfrac{20}{42} \\\\ & =\cfrac{10}{21} \end{aligned}
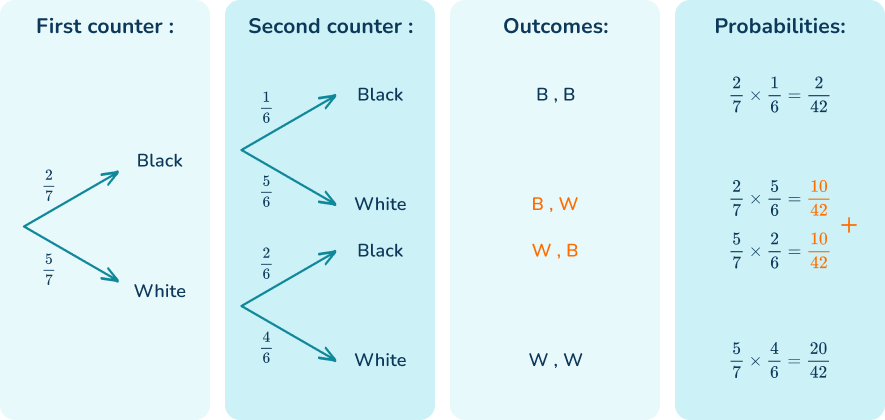
The probability that one of each color counter will be picked is \cfrac{10}{21}.
Example 6: three independent events
Mark does a coin toss with three fair coins.
Complete the tree diagram.
Calculate the probability of all three coins landing on heads.
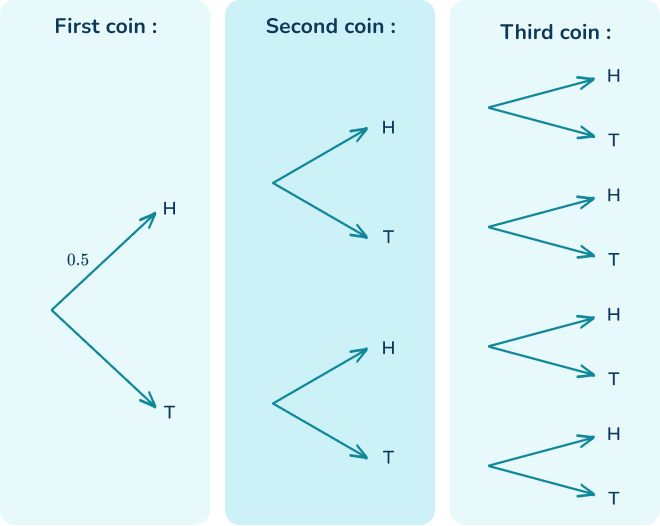
Use the probability of the first coin landing on a head to calculate the probability of the first coin landing on a tail.
P(\text{tails})=1-P(\text{heads})=1-0.5=0.5
Fill in the missing probability for the first coin. The second coin and third coin will have the same probabilities.
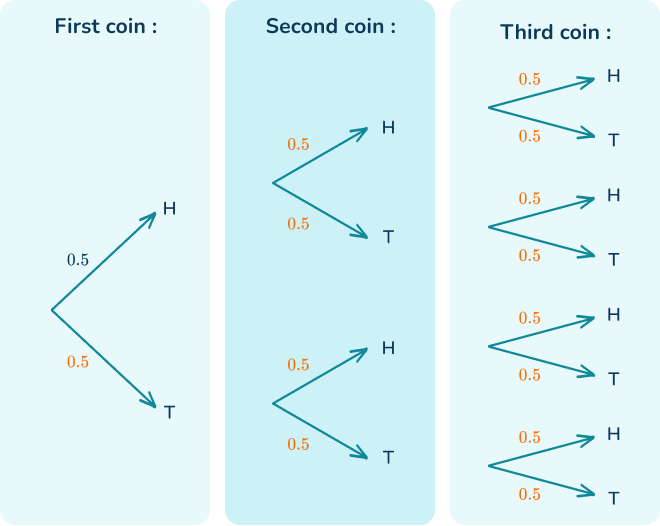
The question asks about 3 heads. Look for the path which shows the coin flips with three heads as the outcome.
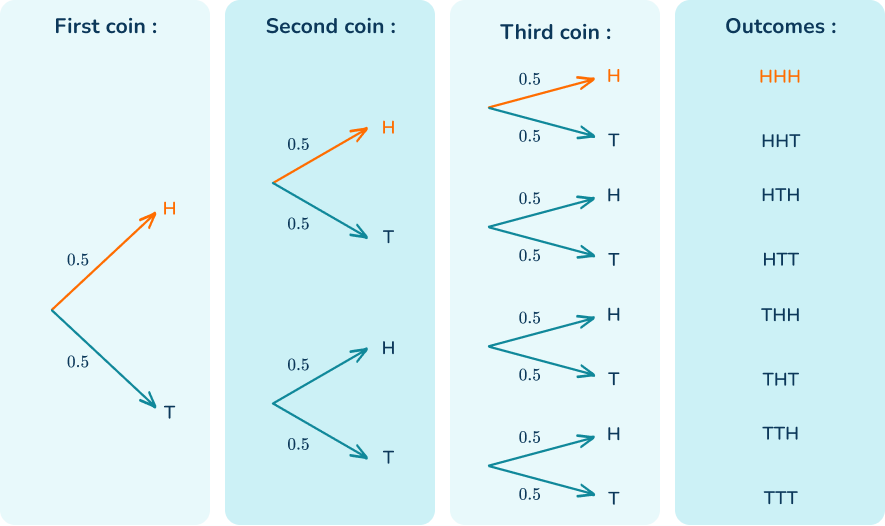
\begin{aligned}P(3 \text { heads }) & =P(\text { heads and heads and heads }) \\\\ & =P(\text { heads }) \times P(\text { heads }) \times P(\text { heads }) \\\\ & =0.5 \times 0.5 \times 0.5 \\\\ & =0.125 \end{aligned}
The probability that there will be 3 heads is 0.125.
Teaching tips for tree diagram probability
- Start with examples that are easy to replicate, such as flipping a coin twice or rolling two dice. This allows students to use a simple tree diagram or a more advanced one with rules. As students advance, choose worksheets that have a variety of contexts and complexity.
Easy mistakes to make
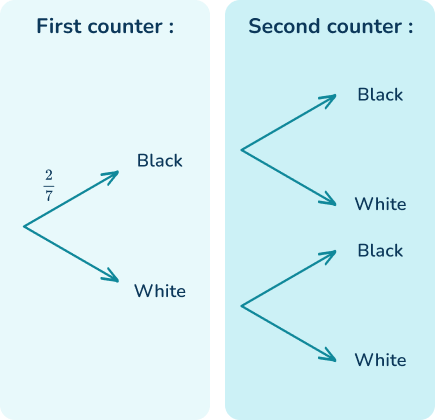
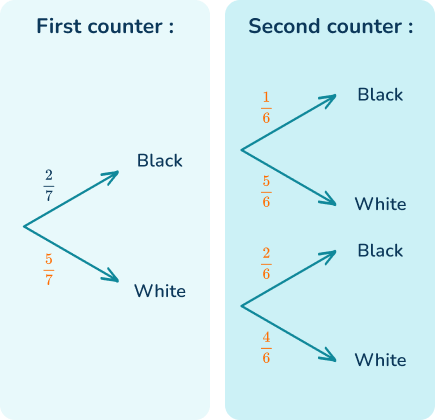
- Not proportionally representing unfair events in a sample space
When using any type of tree diagram, the probability of each outcome should be clearly represented.
For example,
A bag has 1 yellow tennis ball and 2 green tennis balls. One ball is removed, replaced and then another ball is removed.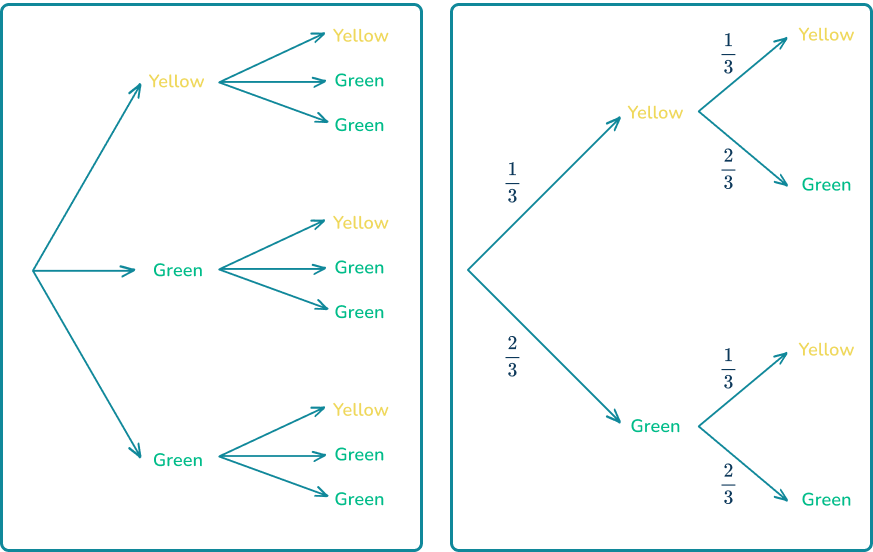
The first tree diagram shows each color proportionally. The second tree diagram labels each branch with the probability.
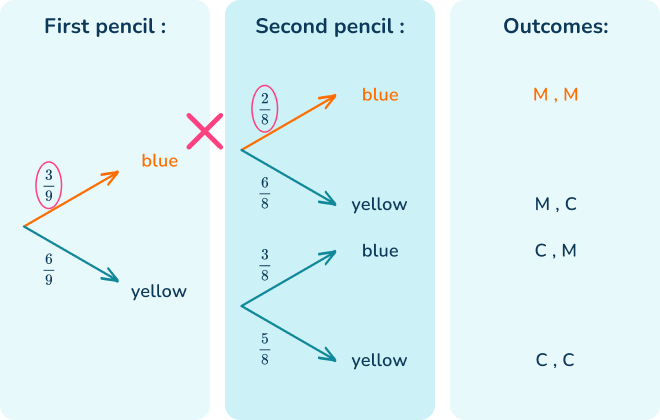
- Reducing fractions while solving
It is usually not worth reducing fractions when working within probability questions. This is because the numerator and denominator give information about the event, for example, the number of marbles in a bag.
Also, we often need to add fractions and they need a common denominator. Only reduce right at the end of a question.
- Dependent events
Remember that for a series of events that include dependent events, the probability of the second event changes depending on the outcome of the first event.
Related probability lessons
Practice probability tree diagrams questions
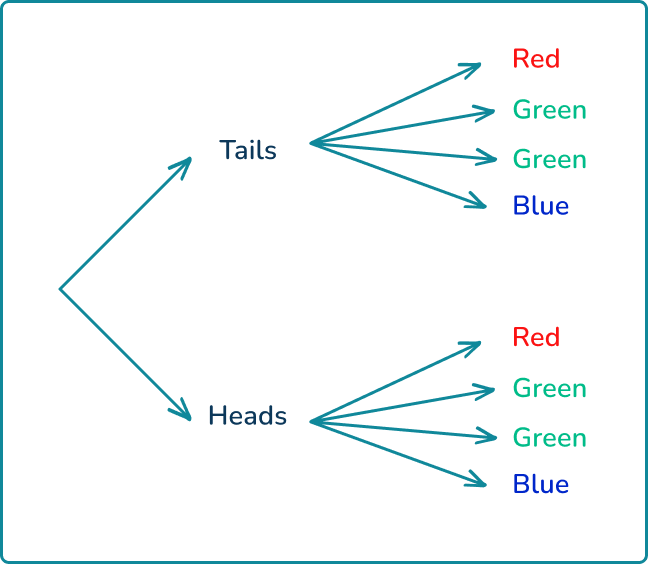
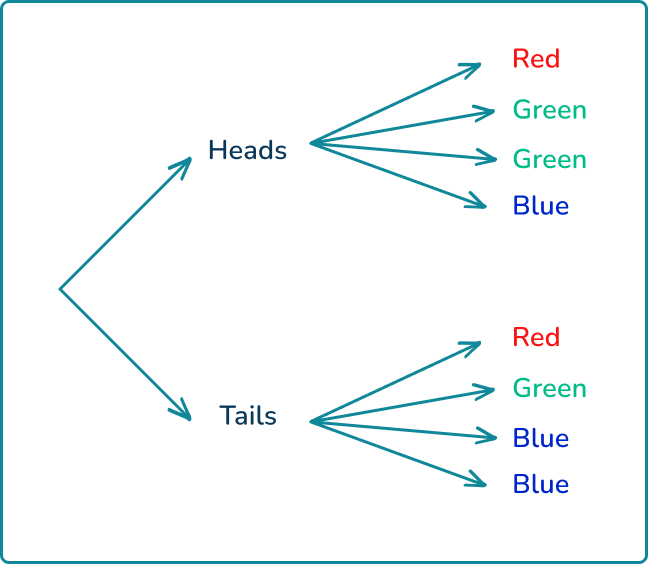
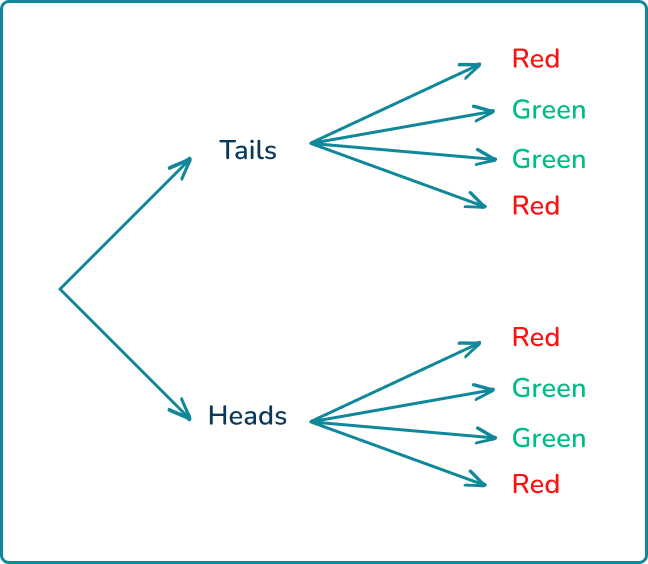
1. A fair coin is flipped and then a marble is chosen from the bag.
Which tree diagram shows the sample space?
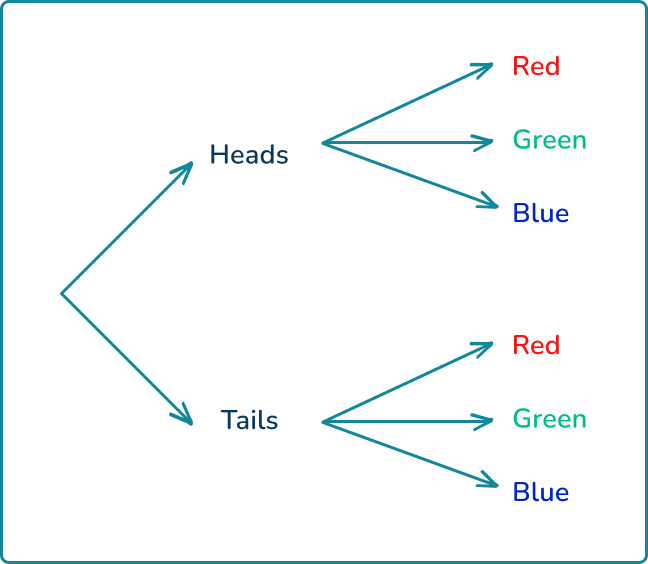


The first set of branches is for the coin. Since heads and tails have an equal chance of being flipped, they each appear once.
The second set of branches is for the marbles. There are two green, one blue and one red. The tree diagram should reflect this proportion.
2. A spinner has green sections and blue sections.
The probability of the spinner landing on green is \cfrac{2}{7}.
The spinner is spun twice.
Using the tree diagram, calculate the probability of the spinner landing on green twice.
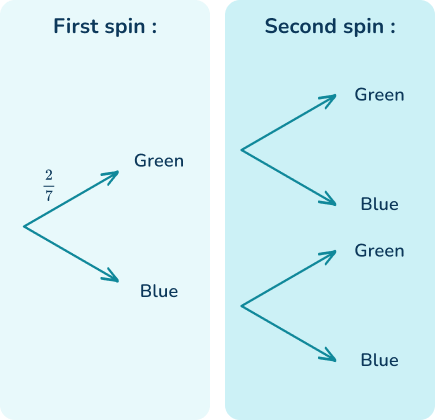
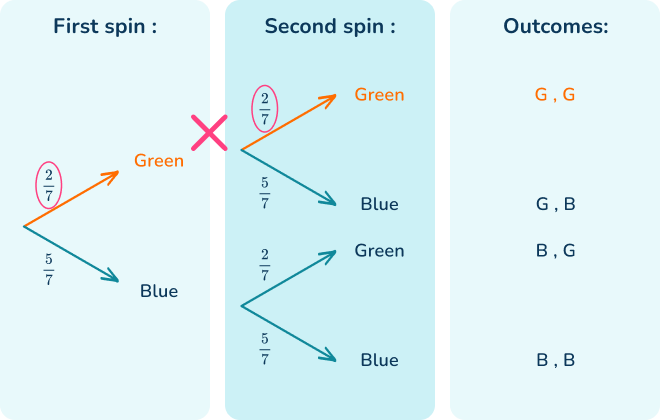
\begin{aligned}P(\text{2 Greens})&=P(\text{Green and green}) \\\\ &=P(\text{Green})\times P(\text{Green}) \\\\ &=\cfrac{2}{7}\times \cfrac{2}{7} \\\\ &=\cfrac{4}{49} \end{aligned}
3. In a bag there are 10 balls. There are 2 red balls and the remaining balls are yellow.
A ball is removed at random and the color noted.
The first ball is replaced.
A second ball is removed at random and the color is noted.
Using the tree diagram, work out the probability that there will be a ball of each color chosen.
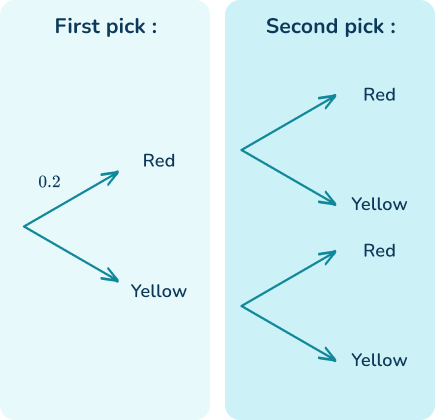
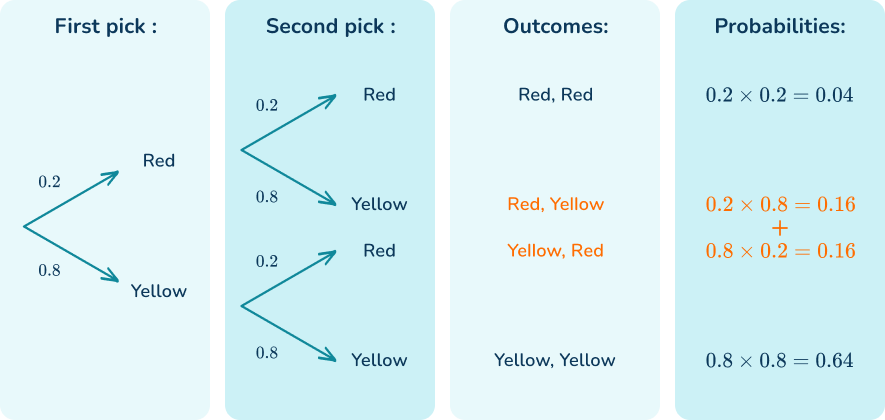
\begin{aligned}P(\text{One of each color})&=P(\text{R,Y}) \, or \, P(\text{Y,R}) \\\\ &=P(\text{R,Y}) + P(\text{Y,R}) \\\\ &=(0.2\times 0.8)+(0.8\times 0.2) \\\\ &=0.16+0.16 \\\\ &=0.32 \end{aligned}
4. A football team has a probability of 0.7 of winning games.
Using a tree diagram, find the probability that they win at least 1 of their next two games.
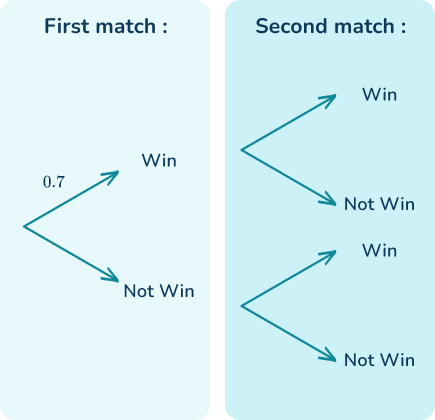
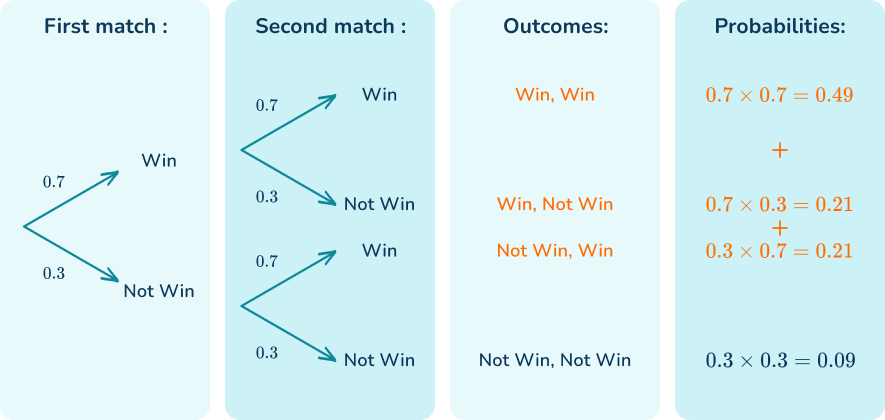
\begin{aligned}P(\text{At least one win})&=P(\text{Win, Win}) \, or \, P(\text{Win, Not win}) \, or \, P(\text{Not win, Win}) \\\\ &=P(\text{Win, Win}) + P(\text{Win, Not win})+P(\text{Not win, Win}) \\\\ &=(0.7\times 0.7)+(0.7\times 0.3)+P(0.3\times 0.7) \\\\ &=0.49+0.21+0.21 \\\\ &=0.91 \end{aligned}
5. There are 6 chocolates in a box. 4 of the chocolates are milk chocolates and the remaining chocolates are plain chocolates. A chocolate is taken out at random and is eaten.
A second chocolate is taken at random and is also eaten.
Calculate the probability that two milk chocolates are eaten.
Give your answer in its simplest form.
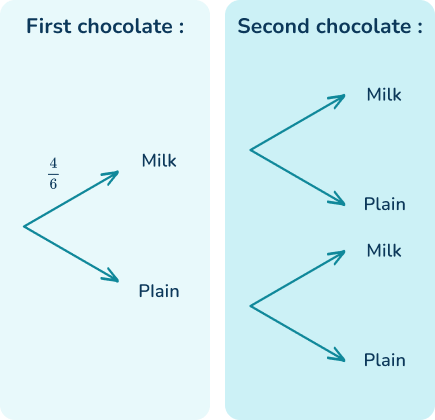
Since the first chocolate is eaten, the probabilities on the second set of branches are different.
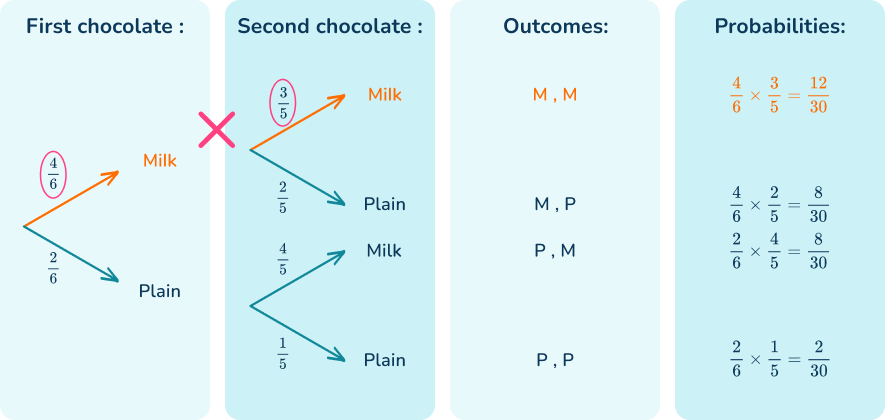
\begin{aligned}P(\text{Two Milks})&=P(\text{Milk and Milk}) \\\\ &=P(\text{Milk}) \times P(\text{Milk}) \\\\ &=\cfrac{4}{6}\times \cfrac{3}{5} \\\\ &=\cfrac{12}{30} \\\\ &=\cfrac{2}{5} \end{aligned}
6. In a bag there are 8 counters. There are 3 blue counters and the remaining counters are yellow.
A counter is removed at random and the color noted.
The counter is NOT replaced.
A second counter is removed at random and the color is noted.
Using the tree diagram, work out the probability that there will be at least one blue counter picked.
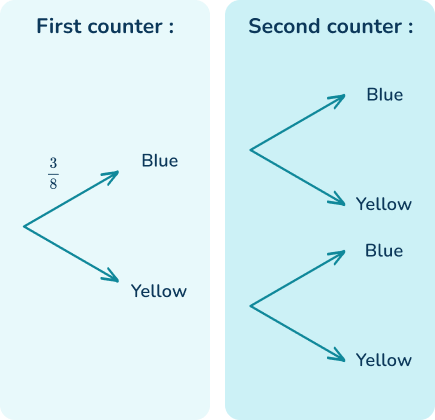
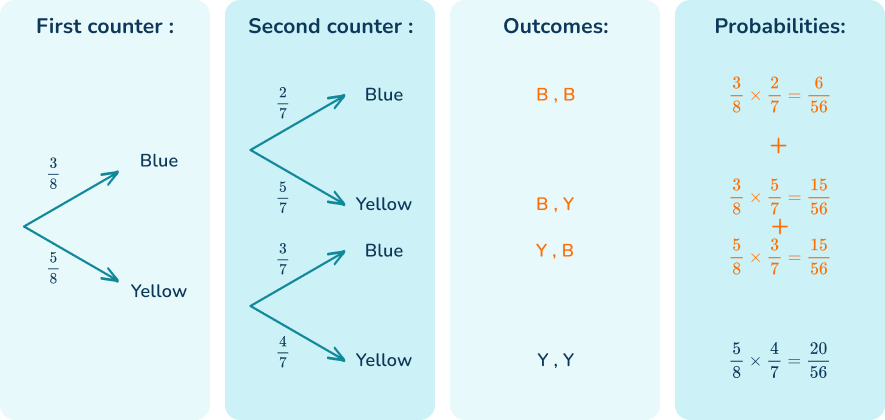
\begin{aligned}P(\text{At least one blue})&=P(\text{B,B}) \, or \, P(\text{B,Y}) \, or \, P(\text{Y,B}) \\\\ &=P(\text{B,B}) + P(\text{B,Y})+P(\text{Y,B}) \\\\ &=(\cfrac{3}{8}\times\cfrac{2}{7})+(\cfrac{3}{8}\times \cfrac{5}{7})+P(\cfrac{5}{8}\times \cfrac{3}{7}) \\\\ &=\cfrac{6}{56}+\cfrac{15}{56}+\cfrac{15}{56} \\\\ &=\cfrac{36}{56} \\\\ &=\cfrac{9}{14} \end{aligned}
Tree diagram probability FAQs
It is a visual representation that shows the outcomes of an event and then the outcomes of at least one other event. Each outcome is represented by a branch and each event is represented by a set of branches.
Tree diagrams can be used for both independent and dependent events. The events ‘flipping a coin’ and ‘rolling a dice’ are independent events – where the outcome of one event does not affect the outcome of the other event.
Events can also be dependent events – where the outcome of one event depends upon what has happened before.
The next lessons are
- Compound probability
- Probability distribution
- Units of measurement
Still stuck?
At Third Space Learning, we specialize in helping teachers and school leaders to provide personalized math support for more of their students through high-quality, online one-on-one math tutoring delivered by subject experts.
Each week, our tutors support thousands of students who are at risk of not meeting their grade-level expectations, and help accelerate their progress and boost their confidence.

Find out how we can help your students achieve success with our math tutoring programs.
[FREE] Common Core Practice Tests (3rd to 8th Grade)
Prepare for math tests in your state with these 3rd Grade to 8th Grade practice assessments for Common Core and state equivalents.
Get your 6 multiple choice practice tests with detailed answers to support test prep, created by US math teachers for US math teachers!