High Impact Tutoring Built By Math Experts
Personalized standards-aligned one-on-one math tutoring for schools and districts
In order to access this I need to be confident with:
Fractions operations Converting fractions, decimals and percentages Decimals Relative frequencyExperimental probability
Here you will learn about experimental probability, including using the relative frequency and finding the probability distribution.
Students will first learn about experimental probability as part of statistics and probability in 7 th grade.
What is experimental probability?
Experimental probability is the probability of an event happening based on an experiment or observation.
To calculate the experimental probability of an event, you calculate the relative frequency of the event.
Relative frequency =\cfrac{\text{frequency of event occurring}}{\text{total number of trials of the experiment}}
You can also express this as R=\cfrac{f}{n} where R is the relative frequency, f is the frequency of the event occurring, and n is the total number of trials of the experiment.
If you find the relative frequency for all possible events from the experiment, you can write the probability distribution for that experiment.
The relative frequency, experimental probability, and empirical probability are the same thing and are calculated using the data from random experiments. They also have a key use in real-life problem-solving.
For example, Jo made a four-sided spinner out of cardboard and a pencil.

She spun the spinner 50 times. The table shows the number of times the spinner landed on each of the numbers 1 to 4. The final column shows the relative frequency.
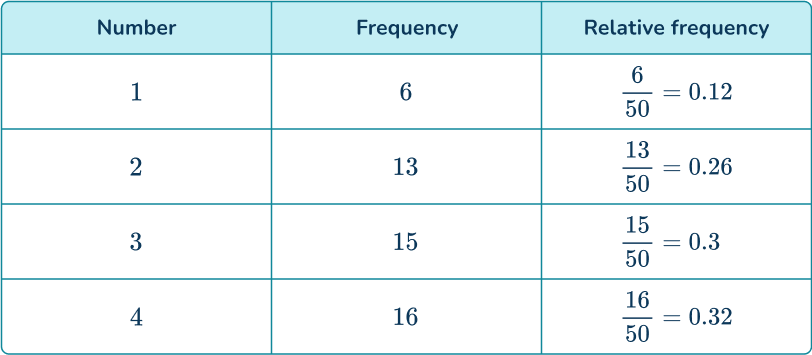
The relative frequencies of all possible events will add up to 1.
0.12 + 0.26 + 0.3 + 0.32 = 1
This is because the events are mutually exclusive.
See also: Mutually exclusive events
![[FREE] Probability Check for Understanding Quiz (Grade 7 to 12)](https://thirdspacelearning.com/wp-content/uploads/2023/07/Probability-check-for-understanding-quiz-listing-image.png)
[FREE] Probability Check for Understanding Quiz (Grade 7 to 12)
Use this quiz to check your grade 7 to 12 students’ understanding of probability. 15+ questions with answers covering a range of 7th to 12th grade probability topics to identify areas of strength and support!
DOWNLOAD FREE [FREE] Probability Check for Understanding Quiz (Grade 7 to 12)
Use this quiz to check your grade 7 to 12 students’ understanding of probability. 15+ questions with answers covering a range of 7th to 12th grade probability topics to identify areas of strength and support!
DOWNLOAD FREEExperimental probability vs theoretical probability
You can see that the relative frequencies are not equal to the theoretical probabilities you would expect if the spinner was fair.
If the spinner is fair, the more times an experiment is done, the closer the relative frequencies should be to the theoretical probabilities.
In this case, the theoretical probability of each section of the spinner would be 0.25, or \cfrac{1}{4}.
Step-by-step guide: Theoretical probability
What is experimental probability?
Common Core State Standards
How does this relate to 7 th grade math?
- Grade 7 – Statistics & Probability (7.SP.C.5)
Understand that the probability of a chance event is a number between 0 and 1 that expresses the likelihood of the event occurring. Larger numbers indicate greater likelihood.
A probability near 0 indicates an unlikely event, a probability around \cfrac{1}{2} indicates an event that is neither unlikely nor likely, and a probability near 1 indicates a likely event.
How to find an experimental probability distribution
In order to calculate an experimental probability distribution:
- Draw a table showing the frequency of each outcome in the experiment.
- Determine the total number of trials.
- Write the experimental probability (relative frequency) of the required outcome(s).
Experimental probability examples
Example 1: finding an experimental probability distribution
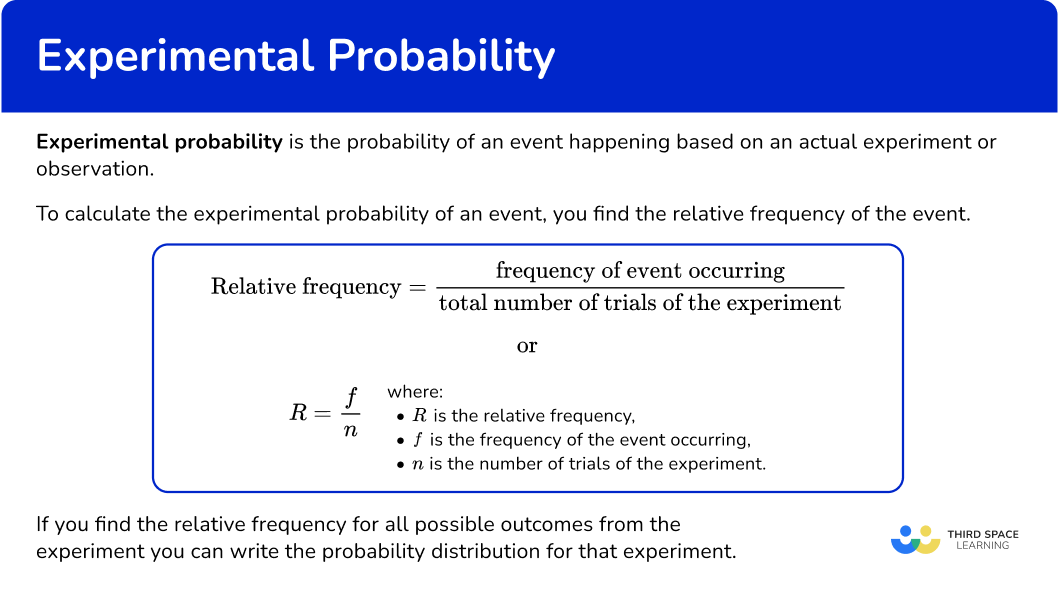
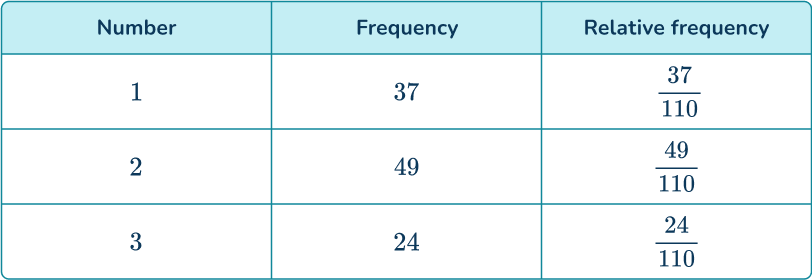
A 3- sided spinner numbered 1, \, 2, and 3 is spun and the results are recorded.
Find the probability distribution for the 3- sided spinner from these experimental results.
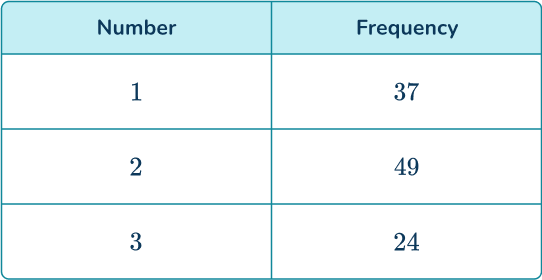
- Draw a table showing the frequency of each outcome in the experiment.
A table of results has already been provided. You can add an extra column for the relative frequencies.
2Determine the total number of trials.
37+49+24=110
3 Write the experimental probability (relative frequency) of the required outcome(s).
Divide each frequency by 110 to find the relative frequencies.
Example 2: finding an experimental probability distribution
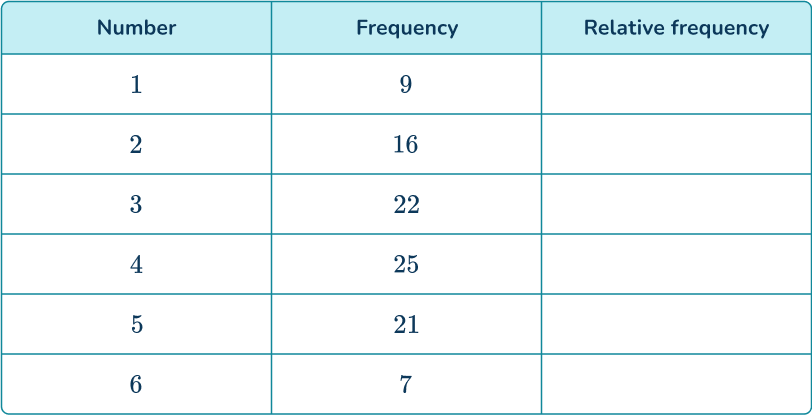
A normal 6- sided die is rolled 50 times. A tally chart was used to record the results.

Determine the probability distribution for the 6- sided die. Give your answers as decimals.
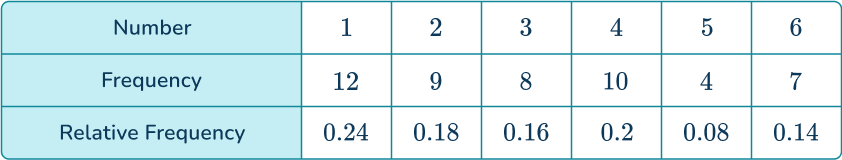
Use the tally chart to find the frequencies and add a row for the relative frequencies.
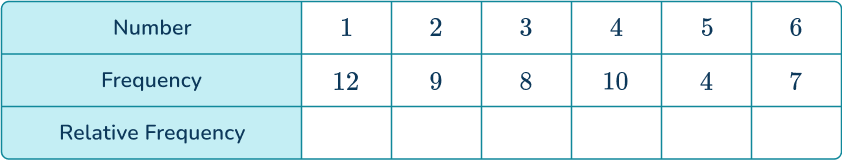
The question stated that the experiment had 50 trials. You can also check that the frequencies add up to 50.
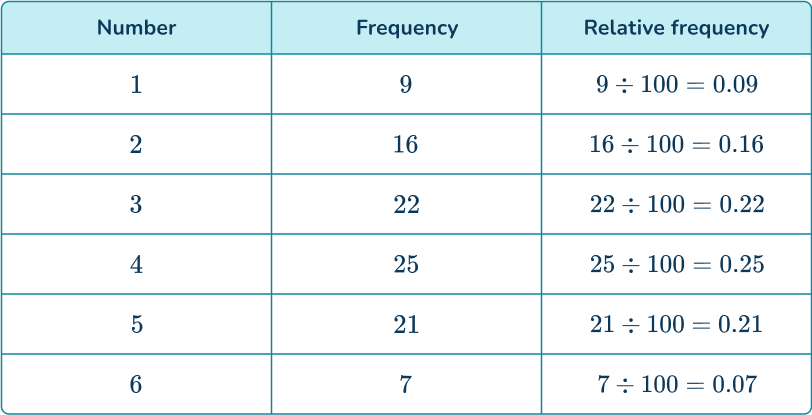
Divide each frequency by 50 to find the relative frequencies.
Example 3: using an experimental probability distribution
A student made a biased die and wanted to find its probability distribution for use in a game. They rolled the die 100 times and recorded the results.
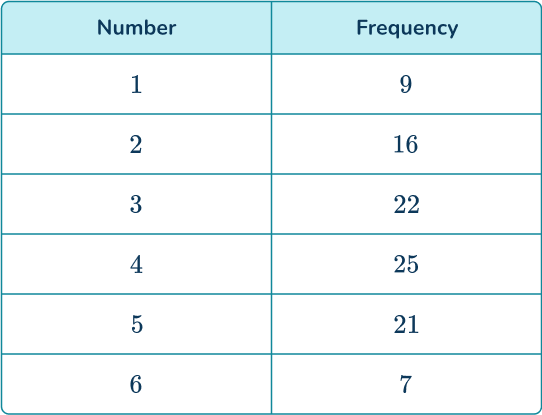
By calculating the probability distribution for the die, determine the probability of the die landing on a 3 or a 4.
A table of results has already been provided. You can add an extra column for the relative frequencies.
The die was rolled 100 times.
You can find the probability of rolling a 3 or a 4 by adding the relative frequencies for those numbers.
P(3\text{ or }4)=0.22+0.25=0.47
Note: P(\text{Event }A) means the probability of event A occurring.
Alternatively, it is only necessary to calculate the relative frequencies for the desired events but by calculating all of the relative frequencies and finding the sum of these values, your solution should equal 1.
The frequency of rolling a 3 or a 4 is 22+25=47.
As the total frequency is 100, the relative frequency is \cfrac{47}{100}=0.47.
Example 4: calculating the relative frequency without a known frequency of outcomes
A research study asked 1,200 people how they commute to work. 640 travel by car, 174 use the bus, and the rest walk. Determine the relative frequency of someone walking to work.
Writing the known information into a table, you have
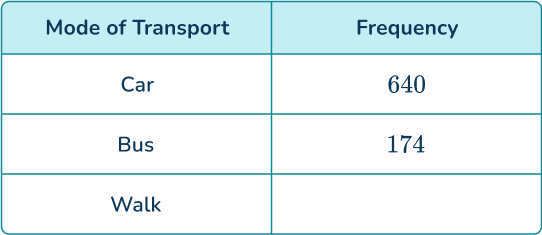
You currently do not know the frequency of people who walk to work. You can calculate this as you know the total frequency.
The number of people who walk to work is equal to
1200-(640+174)=386.
You now have the full table,
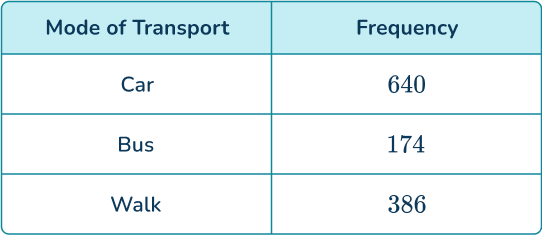
The total frequency is 1,200.
Divide each frequency by the total number of people (1,200), you have
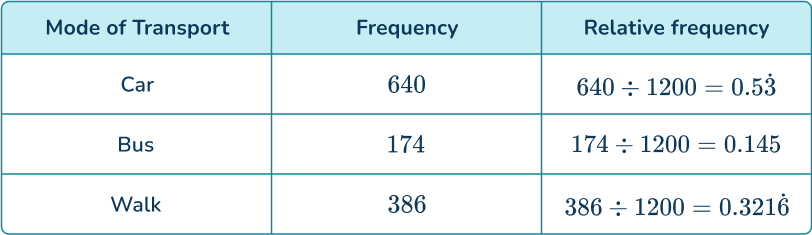
The relative frequency of someone walking to work is 0.3216.
How to find a frequency using an experimental probability
In order to calculate a frequency using an experimental probability:
- Determine the experimental probability of the event.
- Multiply the total frequency by the experimental probability.
Example 5: calculating a frequency
A dice was rolled 300 times. The experimental probability of rolling an even number is \cfrac{27}{50}. How many times was an even number rolled?
The experimental probability is \cfrac{27}{50}.
300\times\cfrac{27}{50}=6\times{27}=162
An even number was rolled 162 times.
Example 6: calculating a frequency
A bag contains different colored counters. A counter is selected at random and replaced back into the bag 240 times. The probability distribution of the experiment is given below.
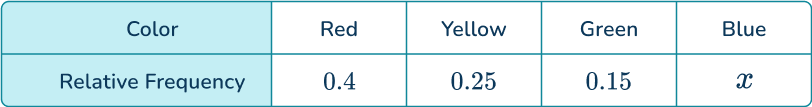
Determine the total number of times a blue counter was selected.
As the events are mutually exclusive, the sum of the probabilities must be equal to 1.
This means that you can determine the value of x.
1-(0.4+0.25+0.15)=0.2
The experimental probability (relative frequency) of a blue counter is 0.2.
Multiplying the total frequency by 0.2, you have
240 \times 0.2=48
A blue counter was selected 48 times.
Teaching tips for experimental probability
- Relate probability to everyday situations, such as the chance of getting heads or tails when flipping a fair coin, to make the concept more tangible.
- Rather than strictly using worksheets, let students conduct their own experiments, such as rolling dice or drawing marbles from a bag, to collect data and compute probabilities.
- Emphasize that in mathematics, experimental probability is based on actual trials or experiments, as opposed to theoretical probability which is based on possible outcomes.
- Teach students how to record the results of an experiment systematically and use them to calculate probabilities. Use charts or tables to help visualize the data.
- Discuss events that cannot occur, such as rolling a 7 with a single six-sided die. Explain that the probability of impossible events is always 0. This helps students understand the concept of probability in a broader context.
Easy mistakes to make
- Forgetting the differences between theoretical and experimental probability
It is common to forget to use the relative frequencies from experiments for probability questions and use the theoretical probabilities instead. For example, they may be asked to find the probability of a die landing on an even number based on an experiment and the student will incorrectly answer it as 0.5.
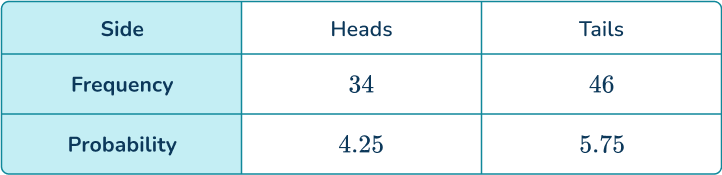
- Thinking the relative frequency is an integer
The relative frequency is the same as the experimental probability. This value is written as a fraction, decimal, or percentage, not an integer.
- Assuming future results will be the same
Students might think that if an experiment yields a certain probability on one day, the results will be the same the next day. Explain that while probabilities are consistent over time in theory, each set of trials can have different outcomes due to randomness, and variations can occur from day to day.
Related probability distribution lessons
- Probability distribution
- Expected frequency
Practice experimental probability questions
1. A coin is flipped 80 times and the results are recorded.
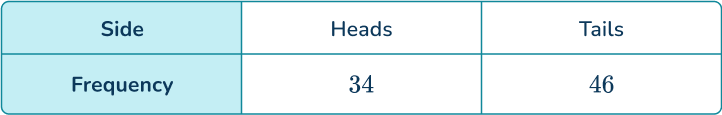
Determine the probability distribution of the coin.
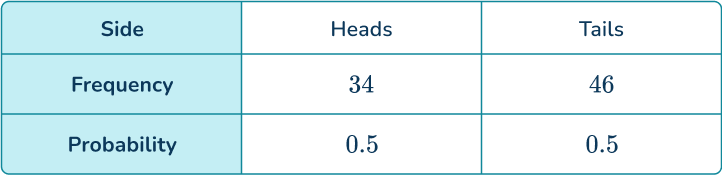


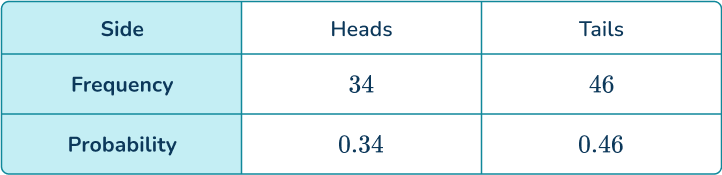
As the number of tosses is 80, dividing the frequencies for the number of heads and the number of tails by 80, you have
34\div{80}=0.425
46\div{80}=0.575
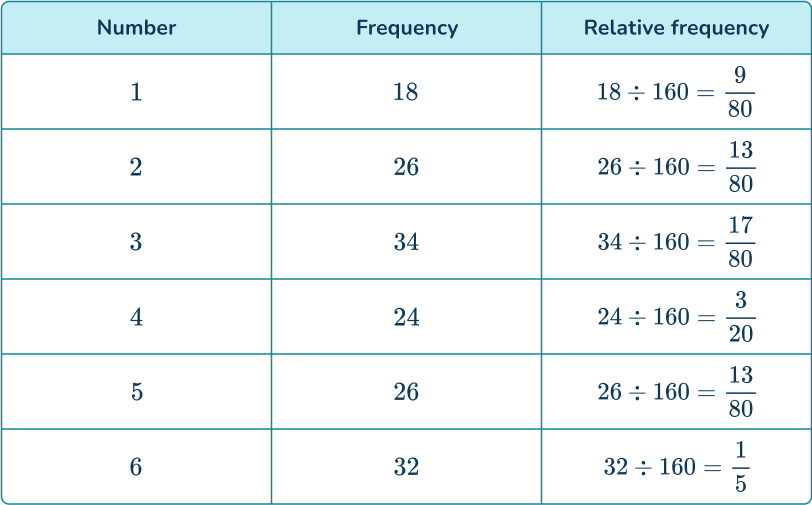
2. A 6- sided die is rolled 160 times and the results are recorded.
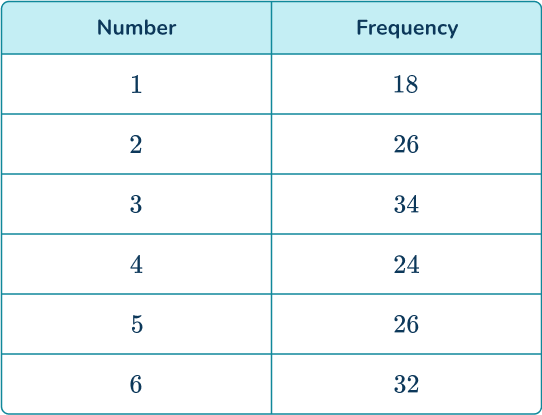
Determine the probability distribution of the die. Write your answers as fractions in their simplest form.
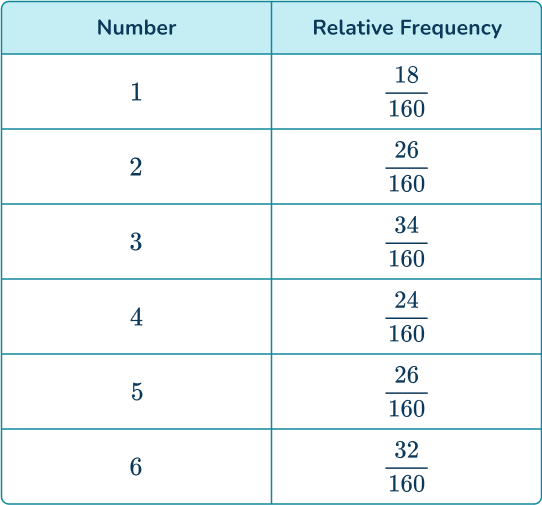
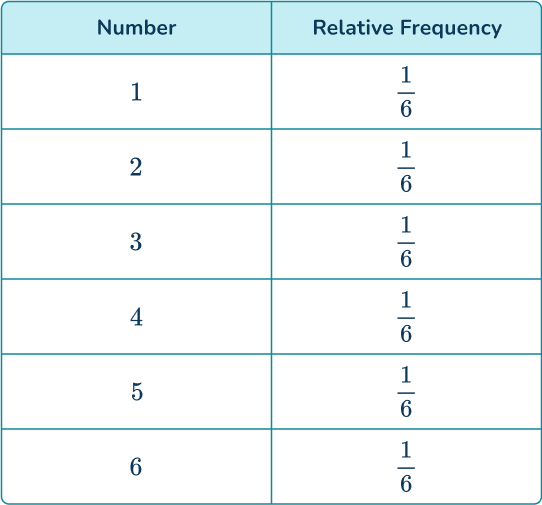
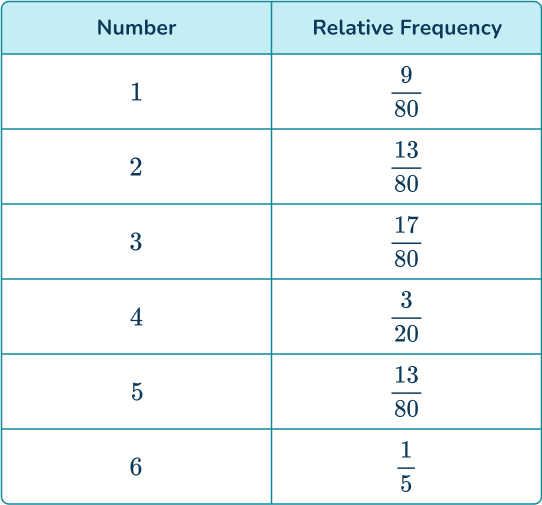
Dividing the frequencies of each number by 160, you get
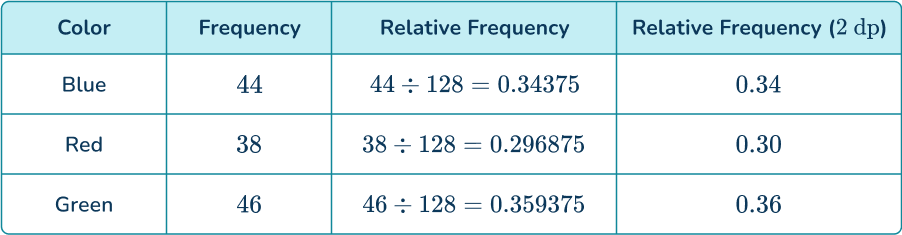
3. A 3- sided spinner is spun and the results are recorded.
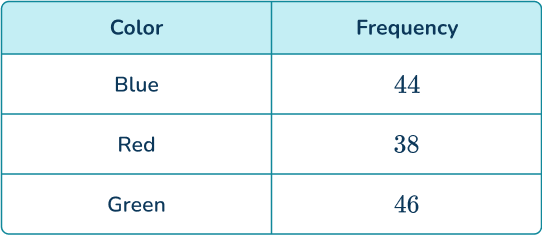
Find the probability distribution of the spinner, giving your answers as decimals to 2 decimal places.
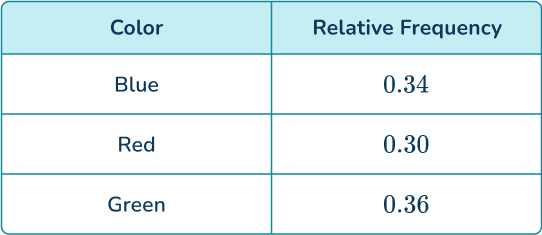
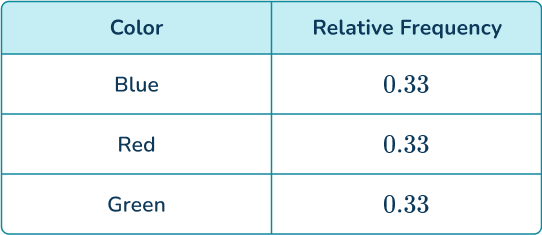
By dividing the frequencies of each color by 128 and simplifying, you have
4. A 3- sided spinner is spun and the results are recorded.

Find the probability of the spinner not landing on red. Give your answer as a fraction.
Add the frequencies of blue and green and divide by 128.
44+46=90
90\div{128}=\cfrac{45}{64}
5. A card is picked at random from a deck and then replaced. This was repeated 4,000 times. The probability distribution of the experiment is given below.
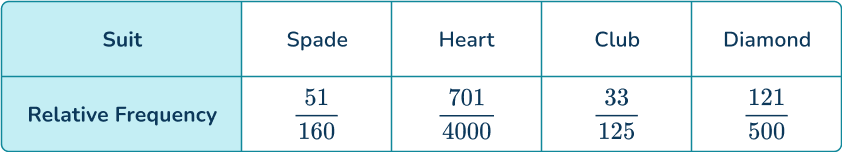
How many times was a club picked?
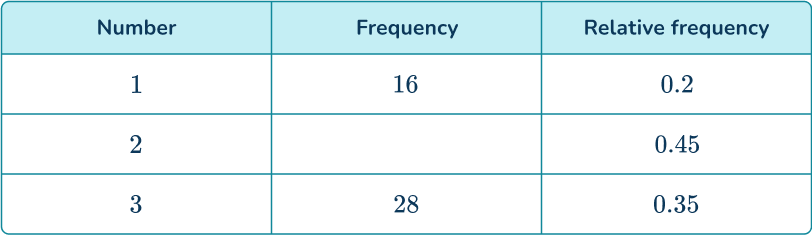
6. Find the missing frequency from the probability distribution.
How many times was a club picked?
The total frequency is calculated by dividing the frequency by the relative frequency.
16\div{0.2}=80
80-(16+28)=36
Experimental probability FAQs
Experimental probability is the likelihood of an event occurring based on the results of an actual experiment or trial. It is calculated as the ratio of the number of favorable outcomes to the total number of trials.
To calculate experimental probability, you calculate the relative frequency of the event:
\text{Relative frequency}=\frac{\text{Frequency of event occurring}}{\text{Total number of trials of the experiment}}
Experimental Probability is based on actual results from an experiment or trial. Theoretical Probability is based on the possible outcomes of an event, calculated using probability rules and formulas without conducting experiments.
It helps us understand how likely events are in real-world scenarios based on actual data. For example, it can be used to predict outcomes in various fields such as social science, medicine, finance, and engineering.
The next lessons are
Still stuck?
At Third Space Learning, we specialize in helping teachers and school leaders to provide personalized math support for more of their students through high-quality, online one-on-one math tutoring delivered by subject experts.
Each week, our tutors support thousands of students who are at risk of not meeting their grade-level expectations, and help accelerate their progress and boost their confidence.

Find out how we can help your students achieve success with our math tutoring programs.
[FREE] Common Core Practice Tests (3rd to 8th Grade)
Prepare for math tests in your state with these 3rd Grade to 8th Grade practice assessments for Common Core and state equivalents.
Get your 6 multiple choice practice tests with detailed answers to support test prep, created by US math teachers for US math teachers!