High Impact Tutoring Built By Math Experts
Personalized standards-aligned one-on-one math tutoring for schools and districts
In order to access this I need to be confident with:
Coordinate grid
Plot points on a graph Linear graphRate of change formula
Here you will learn about the rate of change formula, including what it is and how to use it.
Students will first learn about the rate of change formula as part of functions in 8 th grade and continue to use it in high school.
What is the rate of change formula?
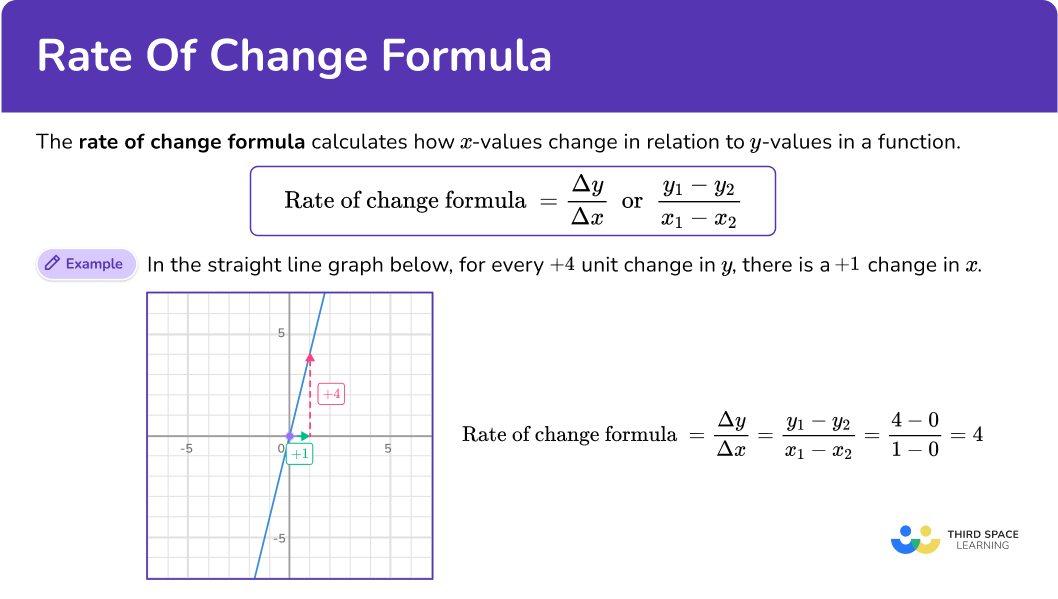
The rate of change formula, for a polynomial function, calculates how x -values change in relation to y -values in a function. In linear functions, this is often referred to as the slope formula.
\text { Rate of change formula }=\cfrac{\Delta y}{\Delta x}Note: The \Delta (delta symbol) is a greek letter used to represent ‘change’
For example,
In the straight line graph below, for every +4 unit change in y, there is a +1 change in x.
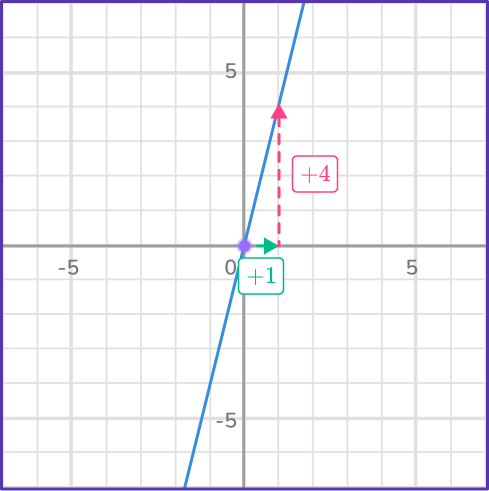
The rate of change (or slope) of this linear function is 4. Notice as x increases, so does y, so the function is increasing and has a positive slope.
When given the table or coordinates of a function, instead of the graph, you will need to calculate the change in x and the change in y.
For example,
The points (3, \, 4) and (7, \, 2) are part of a linear function. Find the rate of change.
Start with the coordinate (3, \, 4) and calculate the change to (7, \, 2). In the rate of change formula, the numerator is the change in y. From 3 to 7, the change is +4.
The denominator is the change in x. From 4 to 2, the change is –2.
Note: You could have also started with (7, \, 2) and calculate the change to (3, \, 4).
The updated formula below shows how to calculate \Delta y and the \Delta x for any two points in a linear function: \left(x_1, y_1\right) and \left(x_2, y_2\right).
\text { Rate of change formula }=\cfrac{y_1-y_2}{x_1-x_2}=\cfrac{7-3}{2-4}=\cfrac{4}{-2}Now, simplify the rate of change by finding the quotient.
\text { Rate of change formula }=\cfrac{4}{-2}=4 \div(- \, 2)=- \, 2The rate of change (or slope) of this linear function is –2. The function is decreasing and has a negative slope.
Let’s look at two different types of graphs where you can use the rate of change formula.
Distance time graphs are graphs that show the distance an object or person has traveled against time. Straight lines on a distance-time graph represent constant speeds. The steeper the slope, the faster the object is traveling.
For example,
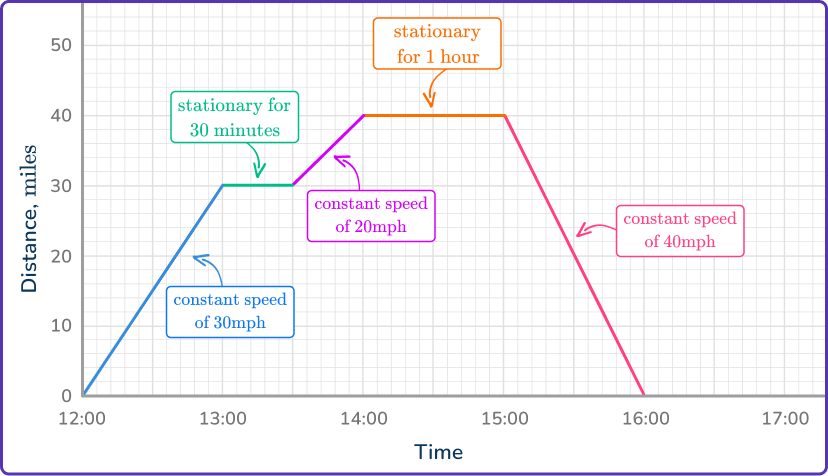
Step-by-step guide: Distance time graph
Step-by-step guide: Velocity vs time graph
What is the rate of change formula?
Common Core State Standards
How does this relate to 8 th grade math?
- Grade 8 – Functions (8.F.B.4)
Construct a function to model a linear relationship between two quantities. Determine the rate of change and initial value of the function from a description of a relationship or from two (x, \, y) values, including reading these from a table or from a graph. Interpret the rate of change and initial value of a linear function in terms of the situation it models, and in terms of its graph or a table of values.
![[FREE] Algebra Worksheet (Grade 6 to 8)](https://thirdspacelearning.com/wp-content/uploads/2023/07/Algebra-check-for-understanding-quiz-listing-image-.png)
[FREE] Algebra Worksheet (Grade 6 to 8)
![[FREE] Algebra Worksheet (Grade 6 to 8)](https://thirdspacelearning.com/wp-content/uploads/2023/07/Algebra-check-for-understanding-quiz-listing-image-.png)
Teaching rate of change formula? Use this quiz to check your grade 6 to 8 students’ understanding of algebra. 10+ questions with answers covering a range of algebra topics to identify areas of strength and support!
DOWNLOAD FREE![[FREE] Algebra Worksheet (Grade 6 to 8)](https://thirdspacelearning.com/wp-content/uploads/2023/07/Algebra-check-for-understanding-quiz-listing-image-.png)
[FREE] Algebra Worksheet (Grade 6 to 8)
![[FREE] Algebra Worksheet (Grade 6 to 8)](https://thirdspacelearning.com/wp-content/uploads/2023/07/Algebra-check-for-understanding-quiz-listing-image-.png)
Teaching rate of change formula? Use this quiz to check your grade 6 to 8 students’ understanding of algebra. 10+ questions with answers covering a range of algebra topics to identify areas of strength and support!
DOWNLOAD FREEHow to use the rate of change formula:
In order to use the rate of change formula:
- Identify two coordinates in the linear function.
- Calculate the change in \textbf{y} .
- Calculate the change in \textbf{x} .
- Divide the change in \textbf{y} by the change in \textbf{x} .
Rate of change formula examples
Example 1: slope of a line
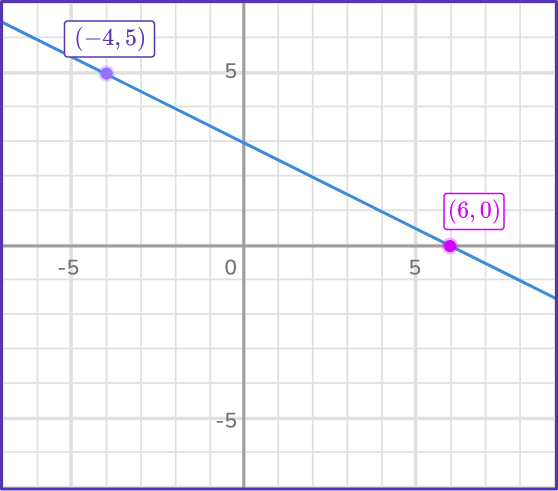
What is the rate of change of the linear function?
- Identify two coordinates in the linear function.
The coordinates (– \, 4, \, 5) and (6, \, 0) are shown on the graph of the line.
2Calculate the change in \textbf{y} .
Let’s look at the change from (- \, 4, \, 5) to (6, \, 0).
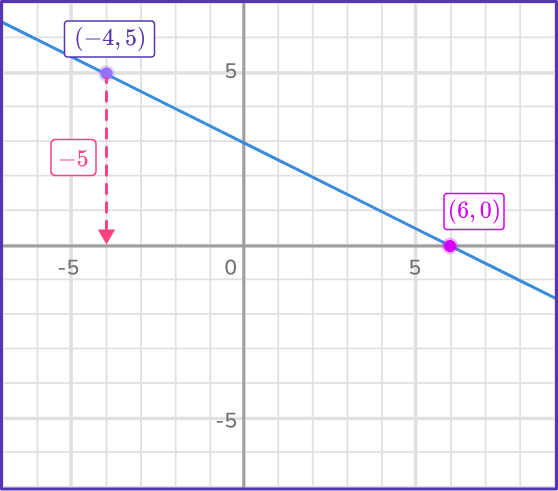
The change in y is - \, 5.
The negative sign dictates that the change is in the negative direction.
3Calculate the change in \textbf{x} .
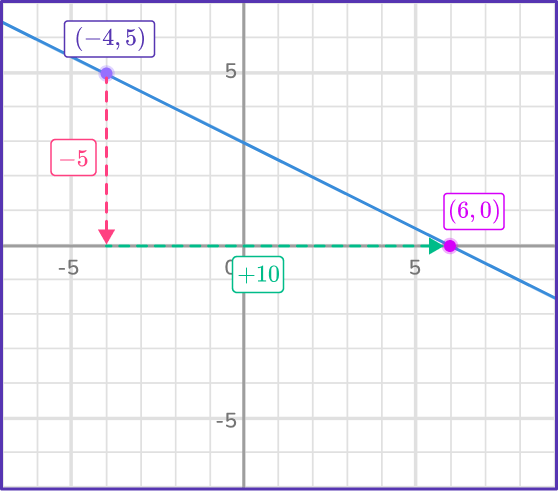
The change in x is +10.
4Divide the change in \textbf{y} by the change in \textbf{x} .
\text { Rate of change}=\cfrac{\Delta y}{\Delta x}=\cfrac{-5}{10}=- \, \cfrac{1}{2}Example 2: rate of change for a specific period of time
What is the rate of change from 1.5 hours to 3 hours?
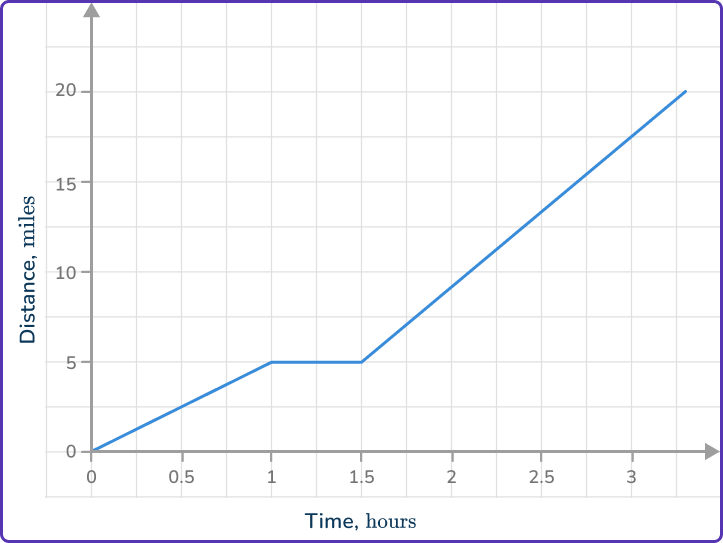
Identify two coordinates in the linear function.
Identify the endpoints of the interval.
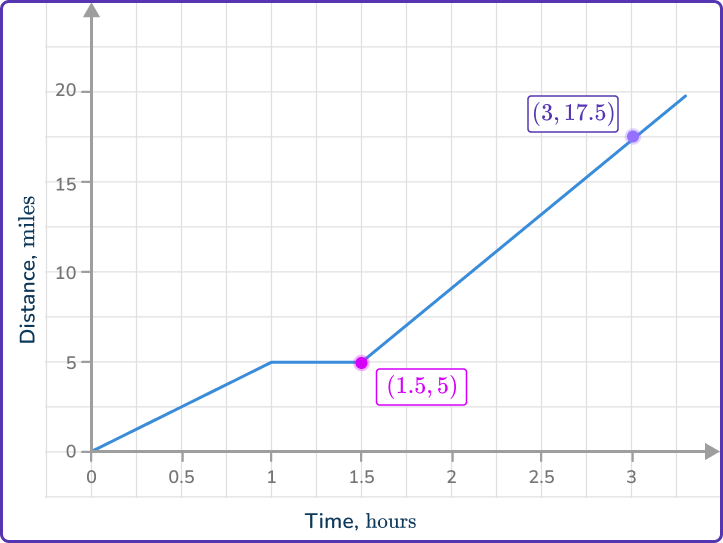
At 1.5 hours the distance is 5 and at 3 hours the distance is 17.5, so the coordinates are (1.5, \, 5) and (3, \, 17.5).
Note: You could also use any point in between the endpoints as well but it is useful to use points that cross the corners of two gridlines.
Calculate the change in \textbf{y} .
Let’s look at the change from (1.5, \, 5) to (3, \, 17.5).
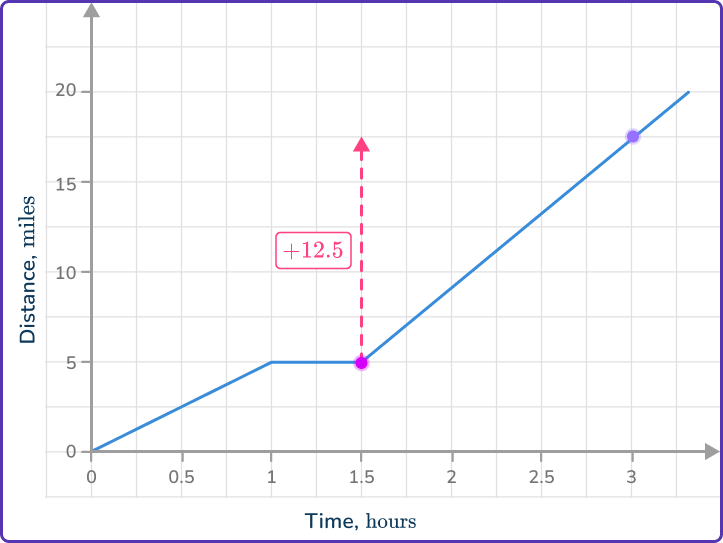
The change in y is + \, 12.5.
Calculate the change in \textbf{x} .
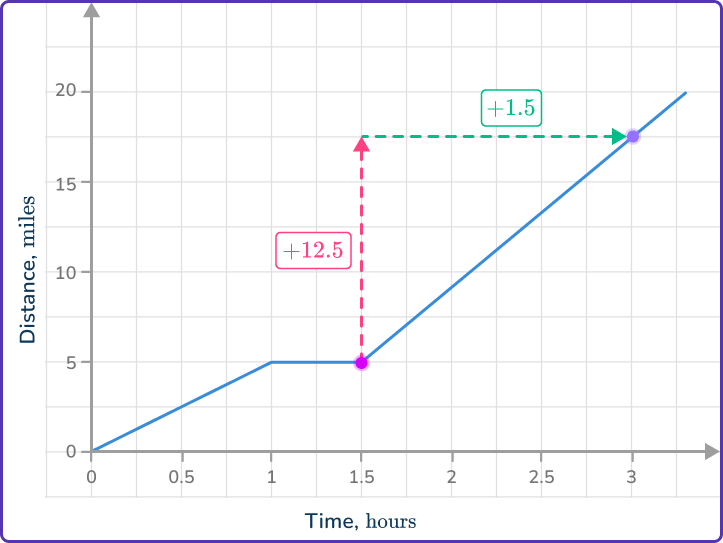
The change in x is + \, 1.5.
Divide the change in \textbf{y} by the change in \textbf{x} .
Example 3: table of values
What is the rate of change of the linear function?

Identify two coordinates in the linear function.
You can use any two of the coordinates in the table. Look for the two that seem to be the easiest calculations. For many people, this will be the smaller, positive numbers.
Since (0, \, – \, 10) has a negative y -coordinate, let’s use the coordinates (1, \, 2) and (2, \, 14).
Calculate the change in \textbf{y} .
Let’s look at the change from (1, \, 2) to (2, \, 14). From the 14 on the y axis to 2, the distance is + \, 12.
Calculate the change in \textbf{x} .
From the 1 on the x axis to 2, the distance is + \, 1.
Divide the change in \textbf{y} by the change in \textbf{x} .
Example 4: table of values
What is the rate of change of the linear function?

Identify two coordinates in the linear function.
You can use any two of the coordinates in the table. Look for the two that seem to be the easiest calculations. This could be numbers that will subtract nicely, like 1 \, \cfrac{1}{2} and \cfrac{1}{2}.
Let’s use the coordinates (\cfrac{1}{2}, \, - \, 12) and (1 \cfrac{1}{2}, \, - \, 36).
Calculate the change in \textbf{y} .
Let’s look at the change from (\cfrac{1}{2}, \, - \, 12) and (1 \cfrac{1}{2}, \, - \, 36). From the – \, 12 on the y axis to – \, 36, the distance is - \, 24.
Calculate the change in \textbf{x} .
From the \cfrac{1}{2} on the x axis to 1 \cfrac{1}{2}, the distance is + \, 1.
Divide the change in \textbf{y} by the change in \textbf{x} .
Example 5: real world linear function
A social media channel wants to grow its subscribers steadily. By the 3 rd month, they aim to have 750 subscribers, and by the 5 th month, 1,250 subscribers. What is the rate of change?
Identify two coordinates in the linear function.
The variables in the function are the months (independent) and the number of subscribers (dependent on the month). This makes the two coordinates (3, \, 750) and (5, \, 1,250).
Calculate the change in \textbf{y} .
Let’s look at the change from (3, \, 750) to (5, \, 1,250). From the 750 on the y axis to 1,250, the distance is + \, 500.
Calculate the change in \textbf{x} .
From the 3 on the x axis to 5, the distance is + \, 2.
Divide the change in \textbf{y} by the change in \textbf{x} .
Example 6: real world average rate of change of a function
Caben measured the mass of an ice cube as it melted for some minutes. After 4 minutes the mass was 19.2 grams. After 15 minutes the mass was 17 grams. What is the average rate of change from 4 to 15 minutes?
Identify two coordinates in the linear function.
We do not know if the relationship is linear, but the average rate of change formula calculates the change between two points, linearly. More specifically it calculates the slope of the secant line, that intersects the function and points a and b. Given two points in a function, a and b, calculate…
\text { Average rate of change }=\cfrac{f(b)-f(a)}{b-a}
The variables in the function are the minutes (independent) and the mass of the ice cube (dependent on the minutes). This makes the two coordinates in the function point a \, (4, \, 19.2) and point b \, (15, \, 17).
Calculate the change in \textbf{y} .
Let’s look at the change from (4, \, 19.2) to (15, \, 17). Since f(4)=19.2 and f(15)=17, the distance is – \, 2.2.
Calculate the change in \textbf{x} .
Since a=4 and b=15, the distance is + \, 11.
Divide the change in \textbf{y} by the change in \textbf{x} .
Teaching tips for rate of change formula
- To make the concept of rate of change more relatable, connect it to real-world examples like average velocity or average speed calculations. Many students have prior experience with these concepts, making it a familiar starting point.
- While worksheets can be a valuable practice tool, provide students with opportunities to work with digital tools as well, that give them dynamic experiences with graphs and the rate of change formula.
Easy mistakes to make
- Confusing the independent and dependent variables
Students can confuse the x and y coordinates when calculating the rate of change, especially in real world examples where they don’t clearly understand which quantity represents the independent variable and which represents the dependent variable.
Helping students visualize the quantities on a graph and explicitly discuss which quantity changes in response to the other can help prevent this type of confusion.
- Confusing the numerator and the denominator
It is easy to get confused and to solve the rate of change formula as \text{ Rate of change }=\cfrac{\Delta{y}}{\Delta{x}}=\cfrac{x_{1}-x_{2}}{y_{1}-y_{2}}.
This can happen, similar to the mistake above, when students do not fully understand that the rate of change defines y in terms of x. Always encourage students to check their work, by using their calculated rate of change with the original function values, to make sure they have the correct rate of change.
- Confusing rate of change with other terms
Without meaningful experiences, students can confuse this term with similar terms (ie. percentage change, unit rate, exchange rate, etc.).
This is yet another reason why activities that focus on conceptual understanding and real world connections are crucial to teaching/learning the rate of change formula.
Practice rate of change formula questions
1. What is the rate of change of Function f?
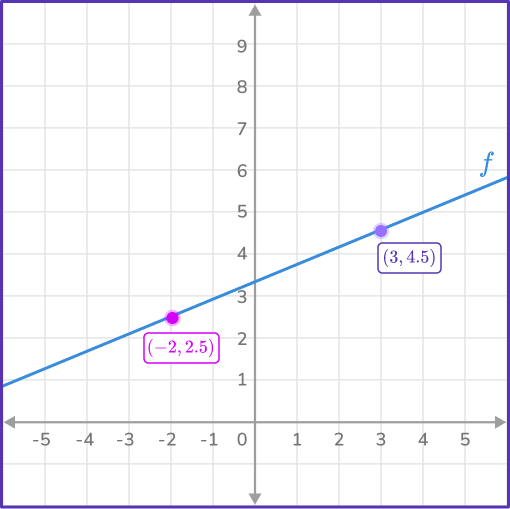


The coordinates (– \, 2, \, 2.5) and (3, \, 4.5) are shown on the graph of the line.
Inspecting the rate of change in y and the rate of change in x:
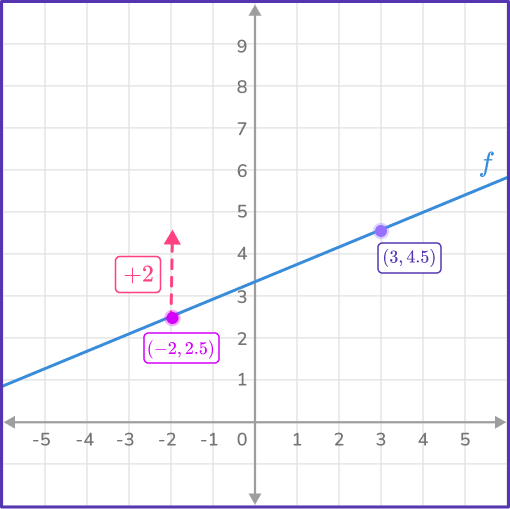
The change in y is + \, 2.
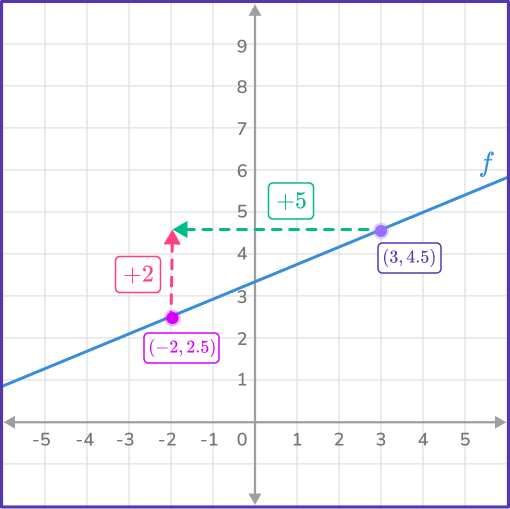
The change in x is + \, 5.
\text { Rate of change }=\cfrac{\Delta y}{\Delta x}=\cfrac{4.5-2.5}{3-(- \, 2)}=\cfrac{2}{5}
2. What is the rate of change of the function?
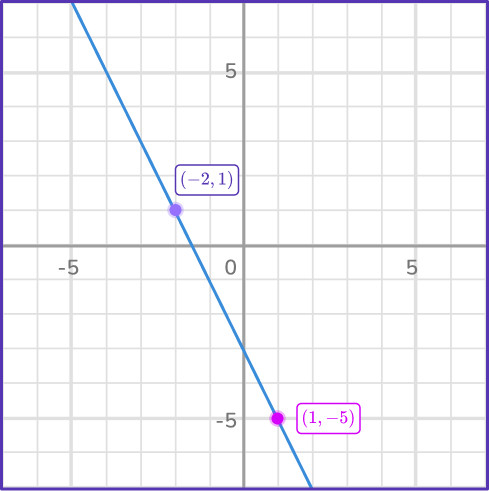


The coordinates (–\, 2, \, 1) and (1, \, – \, 5) are shown on the graph of the line.
Inspecting the rate of change in y and the rate of change in x:
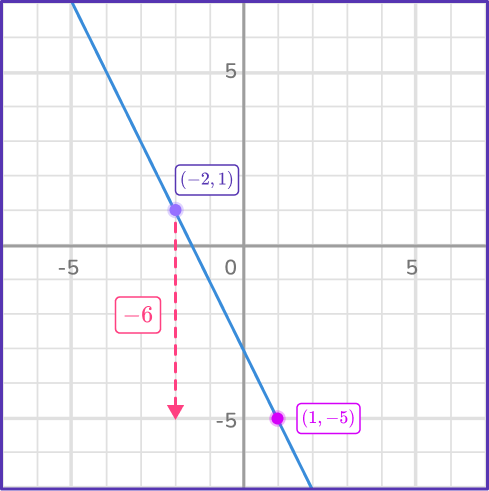
The change in y is – \, 6.
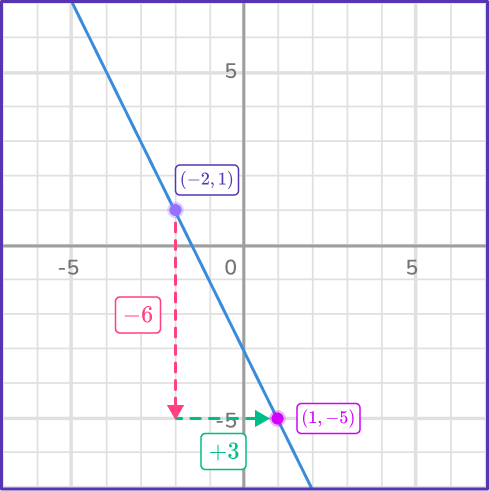
The change in x is + \, 3.
\text { Rate of change }=\cfrac{\Delta y}{\Delta x}=\cfrac{-5-1}{1-(- \, 2)}=\cfrac{-6}{3}=- \, 2
3. What is the rate of change of the linear function?


You can use any two of the coordinates in the table. Look for the two that seem to be the easiest calculations.
Let’s look at the change from (6, \, 33) to (8, \, 44).
From the 33 on the y axis to 44, the distance is + \, 11.
From the 6 on the x axis to 8, the distance is + \, 2.
\text { rate of change formula }=\cfrac{\Delta y}{\Delta x}=\cfrac{44-33}{8-6}=\cfrac{11}{2}=5.5
4. What is the rate of change of the linear function?


You can use any two of the coordinates in the table. Look for the two that seem to be the easiest calculations.
Let’s look at the change from (6, \, 33) to (20, \, 110).
From the 33 on the y axis to 110, the distance is + \, 77.
From the 6 on the x axis to 20, the distance is + \, 14.
\text { Rate of change }=\cfrac{\Delta y}{\Delta x}=\cfrac{110-33}{20-6}=\cfrac{77}{14}=5.5
5. A bakery wants to increase its daily bread production steadily. They aim to produce 250 loaves on the 3 rd day and 400 loaves on the 7 th day. What is the rate of change in bread production per day?


The variables in the function are the days (independent) and the number of loaves (dependent on the days). This makes the two coordinates (3, \, 250) and (7, \, 402).
From the 250 on the y axis to 402, the distance is + \, 150.
From the 3 on the x axis to 7, the distance is + \, 4.
\text { Rate of change }=\cfrac{\Delta y}{\Delta x}=\cfrac{402-250}{7-3}=\cfrac{152}{4}=38
6. Thomas has a debt. He pays the same amount each month to pay it off. After 2 months, he still owes \$ 350. After 8 months, he owes \$ 140. What is the rate of change in the money Thomas owes each month?


The variables in the function are the months (independent) and the money Thomas still owes (dependent on the months). This makes the two coordinates (2, \, 350) and (8, \, 140).
From the 350 on the y axis to 140, the distance is – \, 210.
From the 2 on the x axis to 8, the distance is + \, 6.
\text { Rate of change }=\cfrac{\Delta y}{\Delta x}=\cfrac{140-350}{8-2}=\cfrac{- \, 210}{6}=- \, 35
Rate of change formula FAQs
It is the rate of change in a function at a specific point. It is a measurement of the slope of a function at a single point. In precalculus and calculus, the instantaneous rate of change is calculated by finding the derivative of the function (slope of a tangent line to the function at that specific point).
The next lessons are
Still stuck?
At Third Space Learning, we specialize in helping teachers and school leaders to provide personalized math support for more of their students through high-quality, online one-on-one math tutoring delivered by subject experts.
Each week, our tutors support thousands of students who are at risk of not meeting their grade-level expectations, and help accelerate their progress and boost their confidence.

Find out how we can help your students achieve success with our math tutoring programs.
[FREE] Common Core Practice Tests (3rd to 8th Grade)
Prepare for math tests in your state with these 3rd Grade to 8th Grade practice assessments for Common Core and state equivalents.
Get your 6 multiple choice practice tests with detailed answers to support test prep, created by US math teachers for US math teachers!