High Impact Tutoring Built By Math Experts
Personalized standards-aligned one-on-one math tutoring for schools and districts
In order to access this I need to be confident with:
Ratio and Proportions
Proportions
Coordinate Graph
Linear graph
Here you will learn about plotting linear graphs, interpreting linear graphs, and determining whether they represent proportional relationships.
Students first learn about first quadrant linear graphs in 6th grade with their work in ratio and proportional relationships. They expand this knowledge in pre-algebra and algebra.
What is a linear graph?
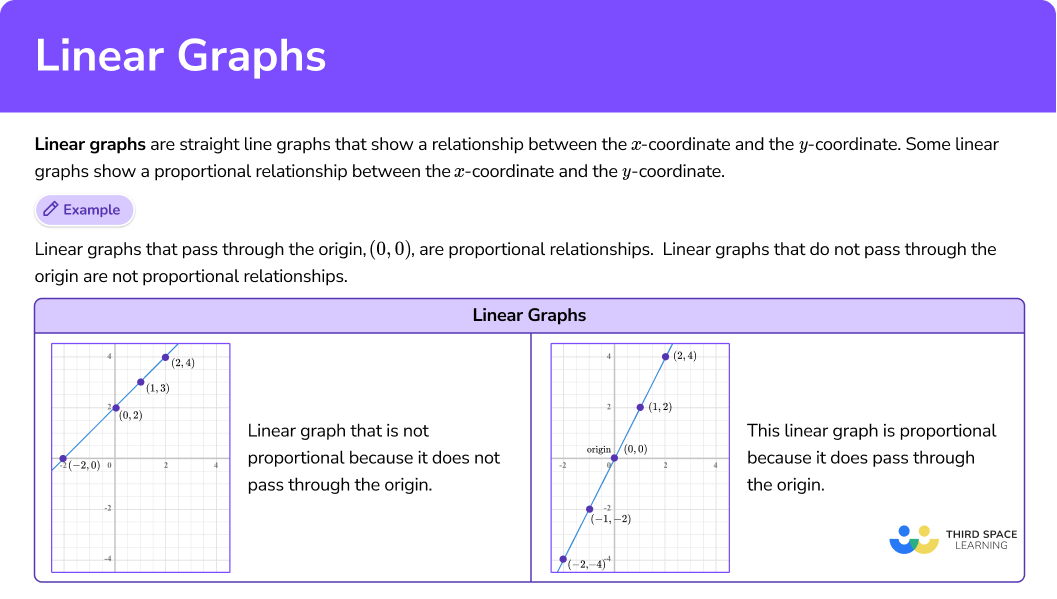
A linear graph is a straight line graph that shows a relationship between the x -coordinate and the y -coordinate. Some linear graphs show a proportional relationship between the x -coordinate and the y -coordinate.
For example,
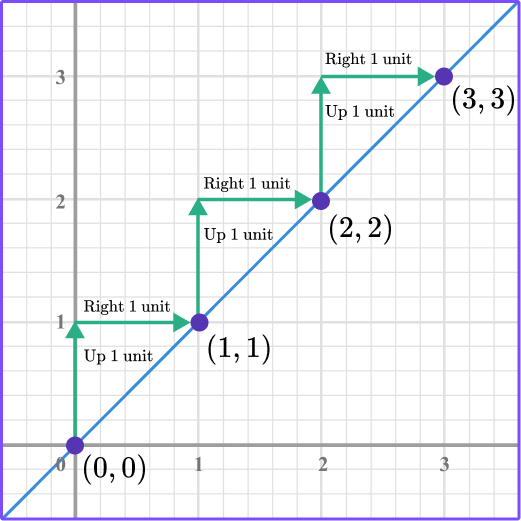
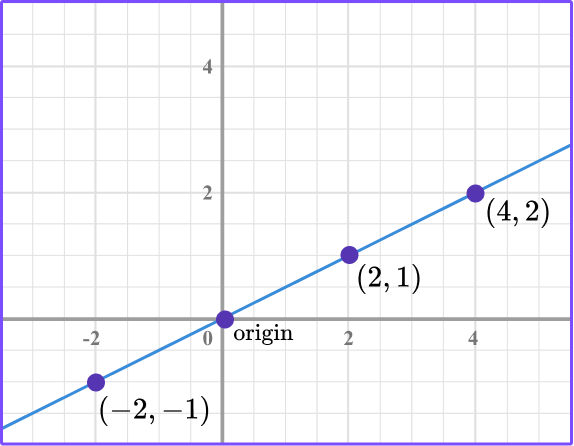
Take a look at this linear graph. Notice how it passes through the origin, (0, 0).

Now, let’s write the ratio of each of the points in the form \, \cfrac{y}{x} .
\begin{aligned} & (1,1) \rightarrow \cfrac{1}{1} \\\\ & (2,2) \rightarrow \cfrac{2}{2}=\cfrac{2 \, \div \, 2}{2 \, \div \, 2}=\cfrac{1}{1} \\\\ & (3,3) \rightarrow \cfrac{3}{3}=\cfrac{3 \, \div \, 3}{3 \, \div \, 3}=\cfrac{1}{1} \end{aligned}
(0,0) \rightarrow \cfrac{0}{0} \, (the origin is not a good point to use because division by 0 does not exist)
You can conclude that this linear graph represents a proportional relationship because:
- The line passes through the origin.
- There is a common ratio of each of the points, which is \, \cfrac{1}{1} .
Notice that the movement from one point to the next is the same as the common ratio, up one unit and right one unit.
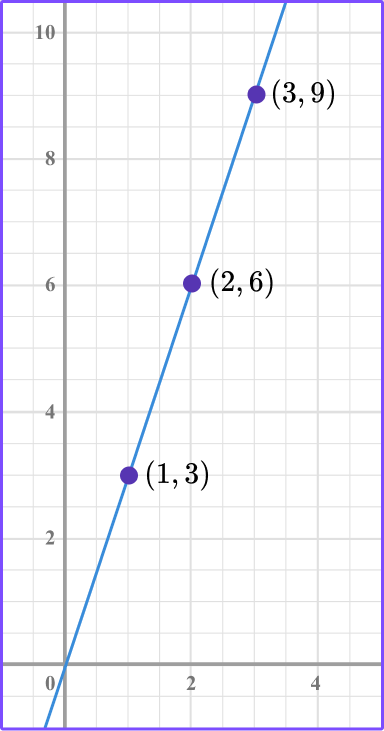
Let’s look at another example of a linear relationship that is proportional. The table represents three points on a coordinate plane.
| x | 0 | 1 | 2 | 3 |
| y | 0 | 3 | 6 | 9 |
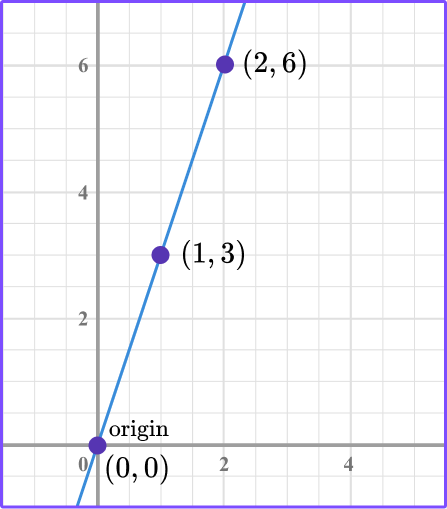
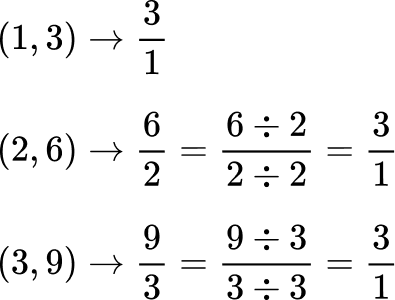
Plot the points and write the ratio of each coordinate in the form of \, \cfrac{y}{x} .
(0,0) \rightarrow \cfrac{0}{0} \, (the origin is not a good point to use because division by 0 does not exist)
\begin{aligned} & (1,3) \rightarrow \cfrac{3}{1}=3 \\\\ & (2,6) \rightarrow \cfrac{6}{2}=\cfrac{6 \, \div \, 2}{2 \, \div \, 2}=\cfrac{3}{1}=3 \\\\ & (3,9) \rightarrow \cfrac{9}{3}=\cfrac{9 \, \div \, 3}{3 \, \div \, 3}=\cfrac{3}{1}=3 \end{aligned}
The ratios are equal which means they are proportional where the common ratio (unit rate) is \, \cfrac{3}{1} \, .
Also, notice the line passes through the origin, (0, 0).
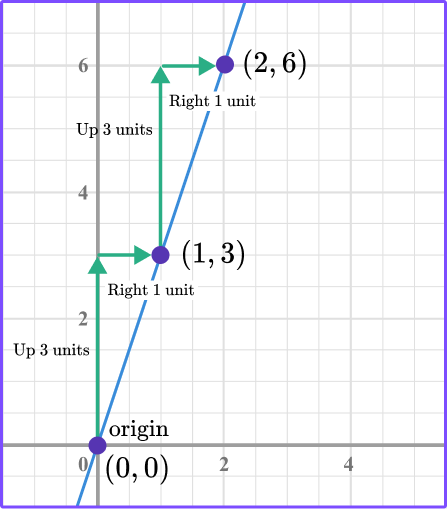
You can conclude that this linear graph represents a proportional relationship because:
- The line passes through the origin.
- There is a common ratio of each of the points, which is \, \cfrac{3}{1} .
Like with the previous example, notice that the movement from one point to the next is the same as the common ratio, up three units and right one unit.
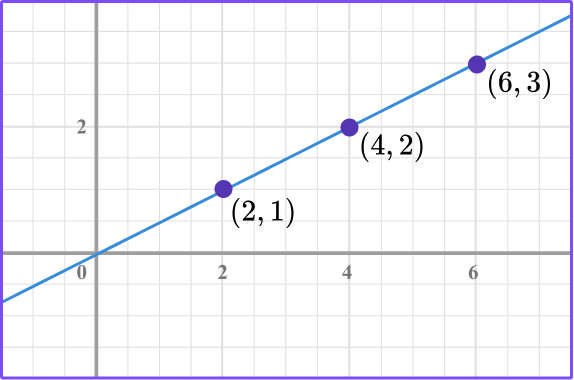
In this next example, does the linear graph represent a proportional relationship?
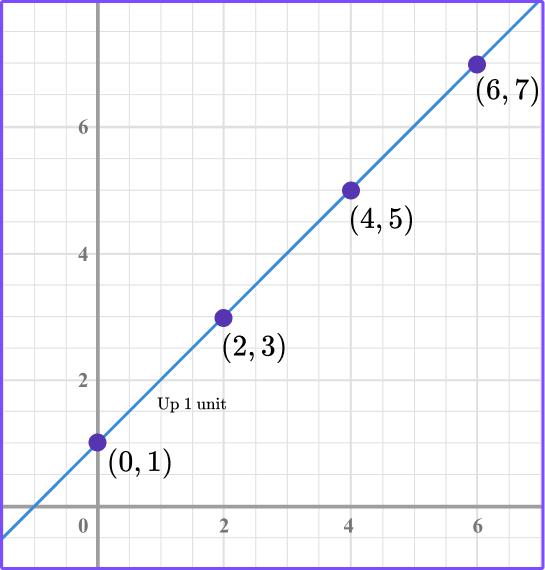
Notice that the line does not pass through the origin. Write the points as a ratio in the form \, \cfrac{y}{x} .
(0,1) \rightarrow \cfrac{1}{0} \, ( 0 in the denominator does not exist, so not a good point to use)
\begin{aligned} & (2,3) \rightarrow \cfrac{3}{2} \\\\ & (4,5) \rightarrow \cfrac{5}{4} \\\\ & (6,7) \rightarrow \cfrac{7}{6} \end{aligned}
\cfrac{3}{2} \,
You can conclude that this linear graph does not represent a proportional relationship because:
- The line does not pass through the origin.
- The ratio of the points is not equal.
![[FREE] Linear Graph Worksheet (Grade 8)](https://thirdspacelearning.com/wp-content/uploads/2024/04/Linear-Graphs-Worksheet-listing-image.png)
[FREE] Linear Graph Worksheet (Grade 8)
Use this worksheet to check your 8th grade students’ understanding of linear graphs. 15 questions with answers to identify areas of strength and support!
DOWNLOAD FREE [FREE] Linear Graph Worksheet (Grade 8)
Use this worksheet to check your 8th grade students’ understanding of linear graphs. 15 questions with answers to identify areas of strength and support!
DOWNLOAD FREEEquations that represent linear graphs
Linear graphs can be represented by equations. You can check to see if an equation represents a linear relationship by making a table of values.
For example, let’s see if the equation y=2x represents a linear graph.
Since x is the independent variable, you can select any number to substitute for x. Substitute the value for x in the equation and solve for the y value.
| x | y=2 x | y | (x, y) |
| -2 \;\; | y=2 \cdot(-2) | -4 \;\; | (-2, -4) |
| -1 \;\; | y=2 \cdot(-1) | -2 \;\; | (-1, -2) |
| 0 | y=2 \cdot(0) | 0 | (0, 0) |
| 1 | y=2 \cdot(1) | 2 | (1, 2) |
| 2 | y=2 \cdot(2) | 4 | (2, 4) |
Plot the points from the table on a linear graph.

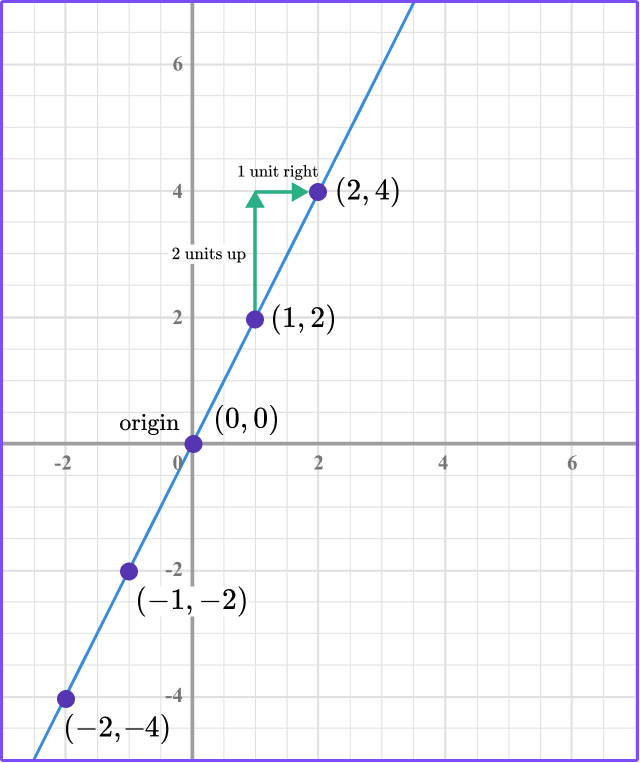
The points form a line, so y=2x is a linear relationship.
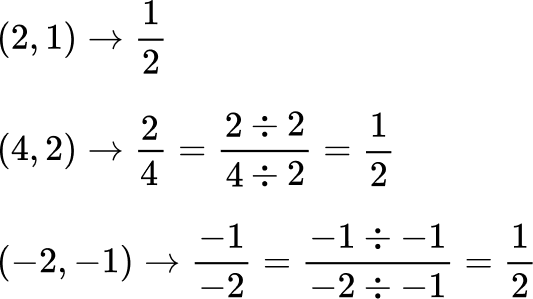
The ratio of the points in the form of \, \cfrac{y}{x} \, is \, \cfrac{2}{1} \, .
\begin{aligned} & \cfrac{4}{2}=\cfrac{4 \, \div \, 2}{2 \, \div \, 2}=\cfrac{2}{1} \\\\ & \cfrac{2}{1} \\\\ & \cfrac{-2}{-1}=\cfrac{-2 \, \div \, -1}{-1 \, \div \, -1}=\cfrac{2}{1} \\\\ & \cfrac{-4 \, \div \, -2}{-2 \, \div \, -2}=\cfrac{2}{1} \\\\ & \cfrac{4}{2}=\cfrac{2}{1}=\cfrac{-2}{-1}=\cfrac{-4}{-2} \end{aligned}
You can conclude that y=2x is also a proportional relationship because:
- The line passes through the origin.
- There is a common ratio (unit rate) of the points which is \, \cfrac{2}{1} \, .
Notice that the common ratio (unit rate) is \, \cfrac{2}{1} \, and the coefficient of x in the equation y=2x is also 2 or \, \cfrac{2}{1} \, .
In equations that represent linear graphs that are proportional, the common ratio will be equal to the coefficient of the x term in the equation.
k=\cfrac{y}{x} \, and y=k x
k represents the common ratio. Also notice the movement from one point to the next on the graph of y=2x is up 2 units and to the right 1 unit.
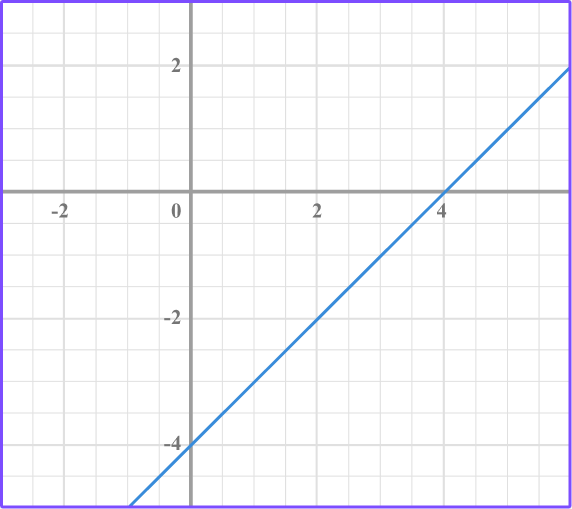
Let’s look at the equation y=-x+1. Does it represent a linear relationship?
Like in the last example, let’s make a table of values.
Since x is the independent variable, you can select any number to substitute for x.
Substitute the value for x in the equation and solve for the y value.
| x | y=- \, x+1 | y | (x, y) |
| -2 \;\; | y=- \, (-2)+1
| 3 | (-2, 3) |
| -1 \;\; | y=- \, (-1)+1
| 2 | (-1, 2) |
| 0 | y=- \, (0)+1
| 1 | (0, 1) |
| 1 | y=- \, (1)+1
| 0 | (1, 0) |
| 2 | y=- \, (2)+1
| -1 \;\; | (2, -1) |
Plot the points on a coordinate graph.
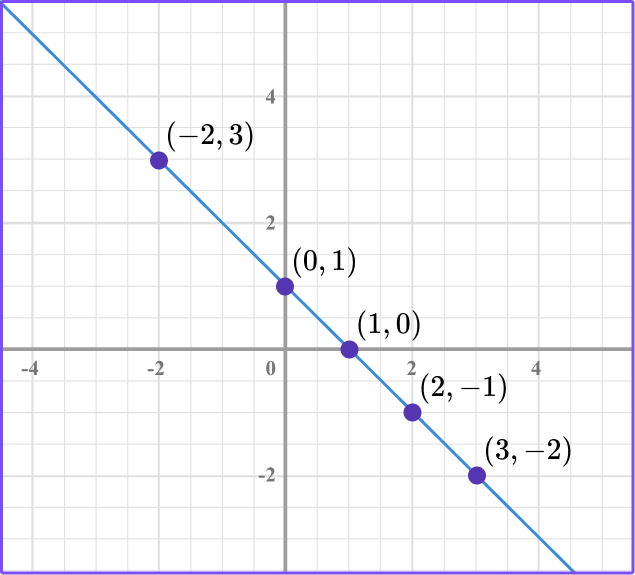
The points form a line so y=-x +1 is a linear relationship. However, the line does not pass through the origin.
Writing the ratio of each of the points in the form of \, \cfrac{y}{x} \, does not give you a common ratio.
\begin{aligned} & (3,-2) \rightarrow \cfrac{-2}{3} \\\\ & (2,-1) \rightarrow \cfrac{-1}{2} \\\\ & (1,0) \rightarrow \cfrac{0}{1} \end{aligned}
(0,1) \rightarrow \cfrac{1}{0} \, ( 0 in the denominator does not exist so not a good point to use)
(-2,3) \rightarrow \cfrac{3}{-2}
\cfrac{3}{-2} \,
You can conclude that y=-x+1 is not a proportional relationship because:
- The line does not pass through the origin.
- There is no common ratio (unit rate) of the points.
What are linear graphs?
Common Core State Standards
How does this relate to 6th grade math, 7th grade math, and 8th grade math?
- Grade 6 – Expressions and Equations (6.EE.C.9)
Use variables to represent two quantities in a real-world problem that change in relationship to one another; write an equation to express one quantity, thought of as the dependent variable, in terms of the other quantity, thought of as the independent variable. Analyze the relationship between the dependent and independent variables using graphs and tables, and relate these to the equation.
- Grade 7 – Ratios and Proportional Relationships (7.RP.A.2.b)
Identify the constant of proportionality (unit rate) in tables, graphs, equations, diagrams, and verbal descriptions of proportional relationships.
- Grade 7 – Ratios and Proportional Relationships (7.RP.A.2.d)
Explain what a point (x, y) on the graph of a proportional relationship means in terms of the situation, with special attention to the points (0, 0) and (1, r) , where r is the unit rate.
- Grade 8 – Expressions and Equations (8.EE.B.5)
Graph proportional relationships, interpreting the unit rate as the slope of the graph.
How to work with a linear graph
In order to determine if a linear graph represents a proportional relationship:
- Plot the points on the graph, connect them, and make sure it forms a straight line.
- Look at the graph to see if it passes through the origin. If it does, go to step 3.
- If it goes through the origin, find the common ratio (unit rate) in the form of \, \cfrac{\textbf{y}}{\textbf{x}} \, .
- Explain what the common ratio (unit rate) means on the graph.
In order to determine if an equation represents a linear proportional relationship:
- Make a table of values to represent the equation and select a minimum of three values for \textbf{x} .
- Substitute values for \textbf{x} in the equation to find the \textbf{y} value.
- Plot the points, connect them, and make sure it forms a straight line.
- Determine if the graph represents a linear relationship. If it is, go to step 5.
- Determine if the linear graph passes through the origin and find the common ratio in the form of \, \cfrac{\textbf{y}}{\textbf{x}} \, .
Linear graph examples
Example 1: determine if a table of values represents a linear, proportional relationship
Determine if the points represented in the table are a linear, proportional relationship.
| x | 1 | 2 | 3 | 4 |
| y | 3 | 6 | 9 | 12 |
- Plot the points on the graph, connect them, and make sure it forms a straight line.
2Look at the graph to see if it passes through the origin. If it does, go to step 3.
The line passes through the origin.
3If it goes through the origin, find the common ratio (unit rate) in the form of \, \cfrac{\textbf{y}}{\textbf{x}} \, .
The ratio of the points.
The common ratio is \, \cfrac{3}{1} \, .
4Explain what the common ratio (unit rate) means on the graph.
The common ratio (unit rate) is \, \cfrac{2}{1} \, which means the movement from one point to the next is 2 units up and 1 unit to the right.
Example 2: determine if a table represents a linear, proportional relationship
Do the points in the table represent a proportional relationship? If so, what is the common ratio (unit rate)?
| x | 1 | 2 | -1 \;\; |
| y | -5\;\; | -10\; | 5 |
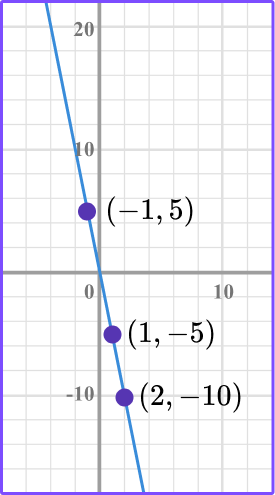
The line passes through the origin, so it represents a proportional relationship.
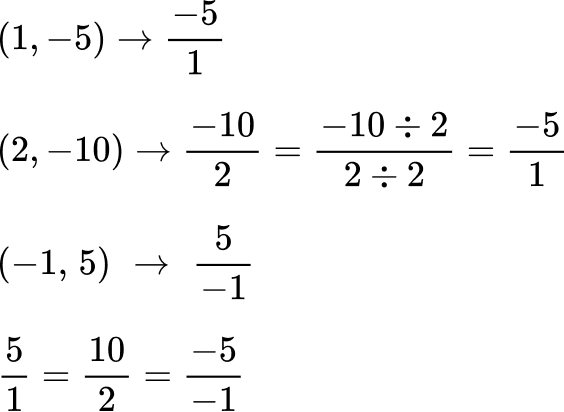
The common ratio is \, \cfrac{-5}{1} \,.
The common ratio (unit rate) is \, \cfrac{-5}{1} \, which means the movement from one point to the next is 5 units down and 1 unit to the right.
Example 3: determine if a linear graph is a proportional relationship from a table
Do the points in the table represent a proportional relationship?
| x | 0 | 2 | 4 |
| y | 1 | 2 | 3 |
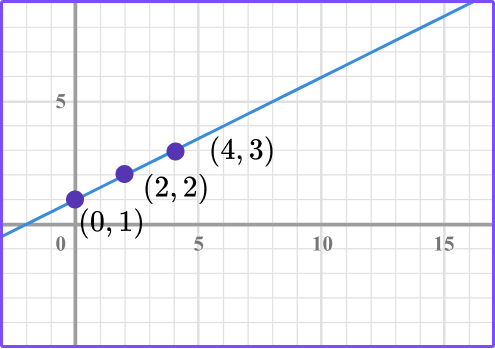
The line does not go through the origin so it does not represent a proportional relationship.
Example 4: real-world scenario linear, proportional relationship
The linear graph shows a relationship between the pounds of potting soil bought and the cost of the potting soil.
Does this relationship show a proportional relationship and what is the cost of 6 \, lbs of potting soil?
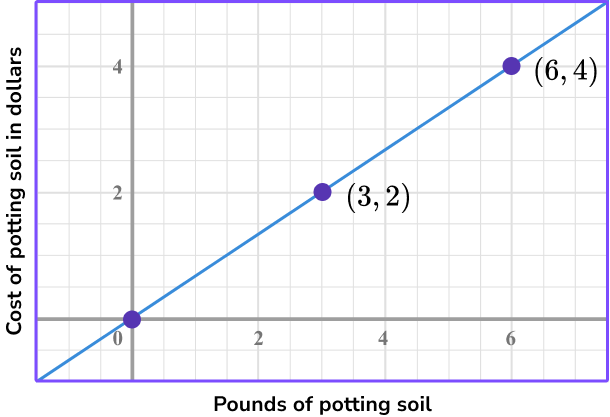
Points already plotted and connected to form a straight line.
The line goes through the origin because it contains the point (0, 0). So, it does represent a proportional relationship.
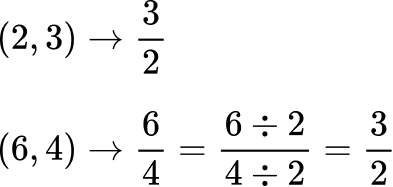
\cfrac{3}{2} \, is the common ratio (unit rate).
The common ratio (unit rate) means that for every 3 \, lbs of potting soil, the cost is \$2.
So, if you buy 6 pounds of potting soil, the cost will be \$4.
Example 5: determine if the equation represents a proportional relationship.
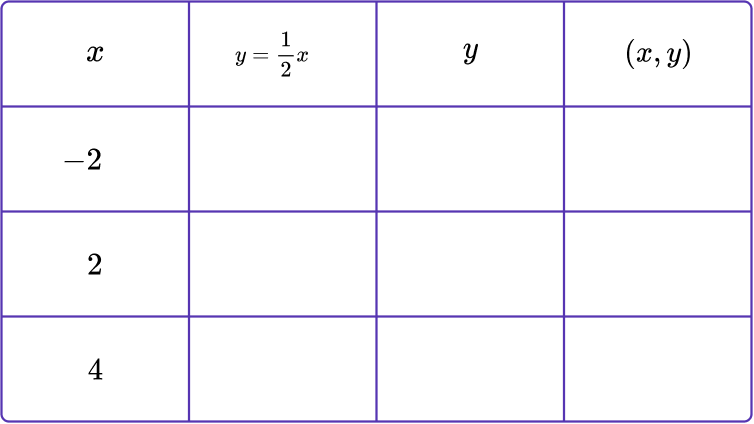
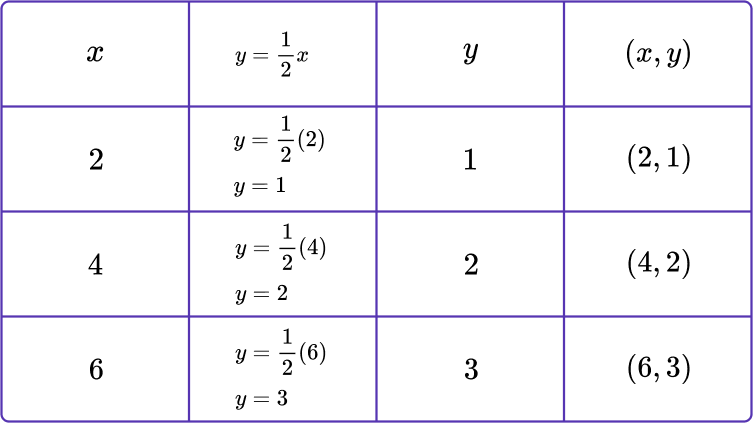
Graph the equation y=\cfrac{1}{2} \, x by making a table of values.
Then determine if it is a proportional relationship.
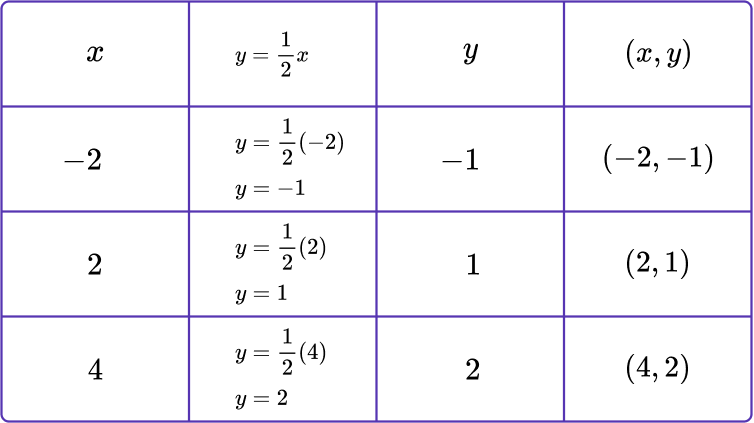
The linear graph goes through the origin, so it represents a proportional relationship.
The common ratio is \, \cfrac{1}{2} \, because that is the coefficient of x in the equation, and it is the ratio of the points.
Teaching tips for linear graphs
- Have students make comparisons on their own between the points and the visual graph so that they can formulate understanding for themselves as to what a proportional linear graph looks like versus a non-proportional linear graph.
- Infuse activities from the free graphing platform, Desmos, for students to explore linear graphs.
- Have students create their own proportional linear graphs and provide an explanation.
- Resources such as Khan Academy are useful for reinforcement of concepts but do not replace the authentic investigation that takes place in the classroom.
Easy mistakes to make
- Confusing the \textbf{x} coordinate and the \textbf{y} coordinate.
For example, plotting the point (1, 2) as (2, 1).
- Not knowing where the origin of the coordinate graph is located.
- Reading a table of values incorrectly.
For example, mixing up the x and y coordinates.
- When making a table of values, plugging in values for \textbf{y} and solving for \textbf{x} .
Related types of graphs lessons
Practice linear graph questions
1. Which linear graph represents a proportional relationship?


A linear graph is considered to be proportional if it goes through the origin, which is the point (0, 0). The graph goes through the origin so it is a proportional relationship.
2. The linear graph is proportional. What is the common ratio of the points?
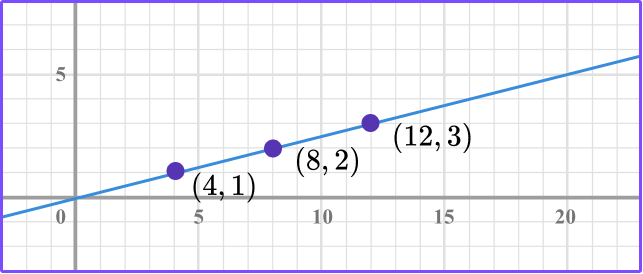
It’s a proportional relationship because the line goes through the origin. Write the ratio of each point in the form of \, \cfrac{y}{x} \, .
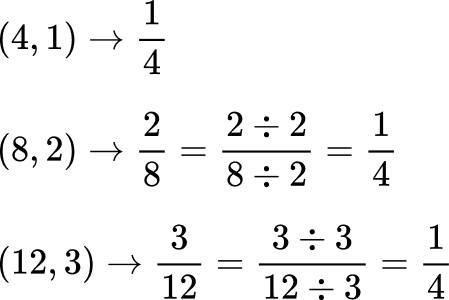
The common ratio is \cfrac{1}{4}. This means the movement from one point to the next is 1 unit up and 4 units right.
3. The linear graph shows a proportional relationship between how many pencils purchased and the cost of the pencils. What is the cost of 12 pencils?
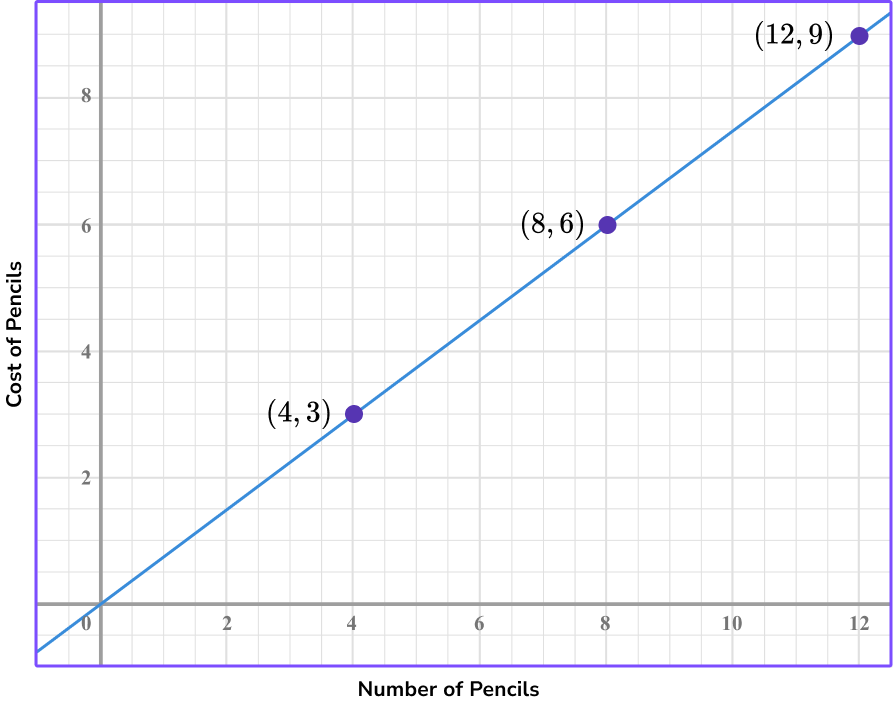
The graph is a proportional relationship. So the ratio of y to x for each of the points is equal.
Use the point (12, 9) which represents 12 pencils for \$9. So, the answer is \$9.
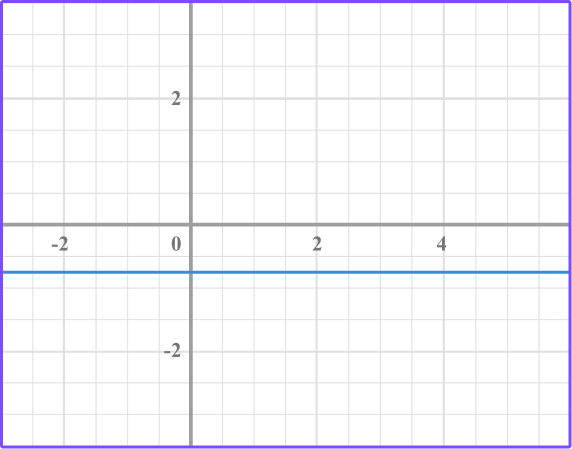
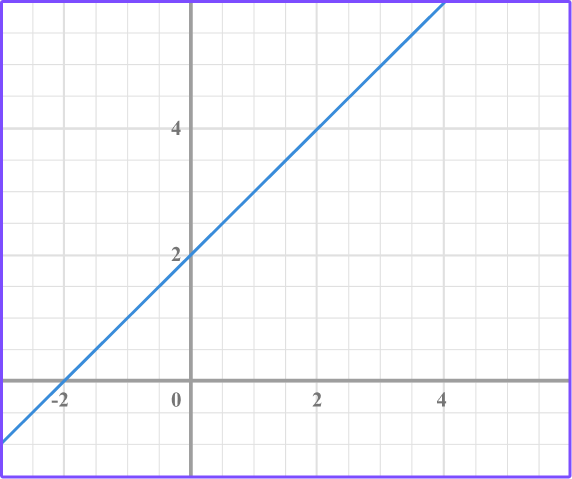
4. Which graph shows a proportional relationship that passes through the point (3, 1)?
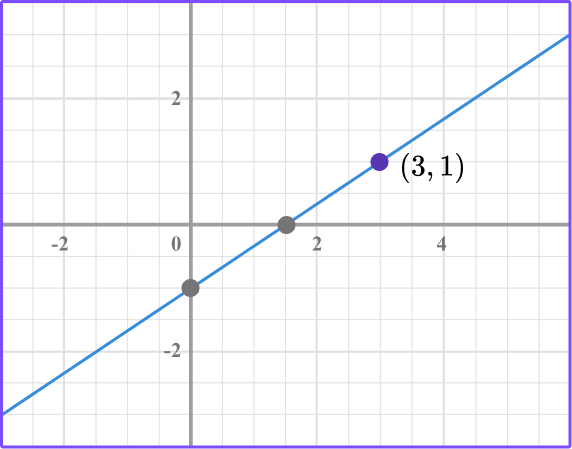
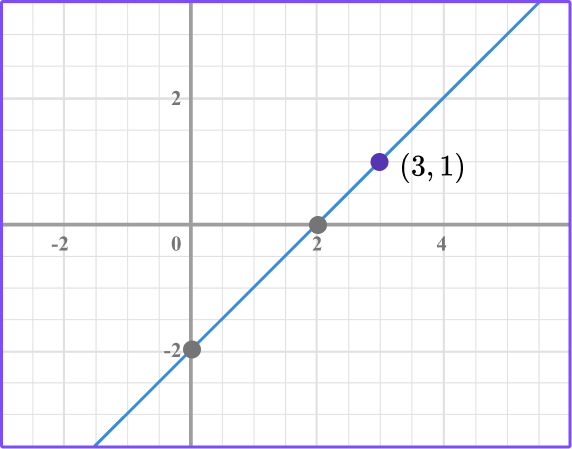
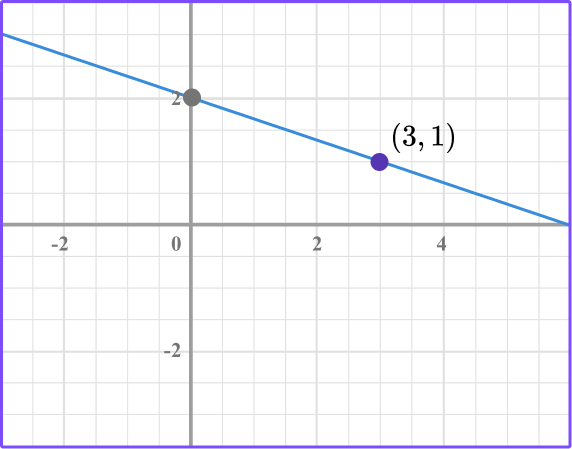
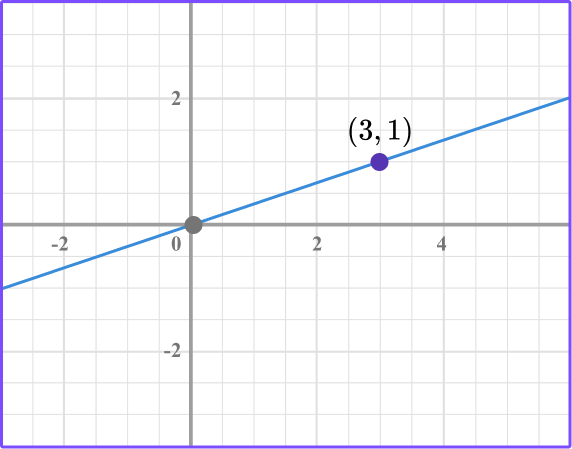
The linear graph has to pass through the origin (0, 0) in order for it to have a proportional relationship.
There is only one linear graph that passes through (0, 0) and contains the point (3, 1).
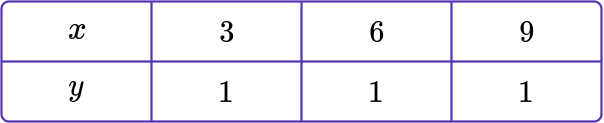
5. Which table of points shows a proportional relationship where the common ratio is \, \cfrac{1}{2} \, ?
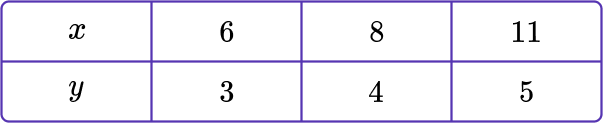
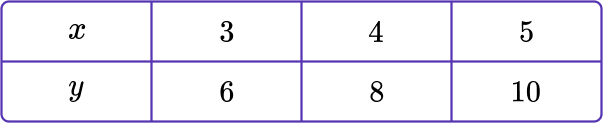
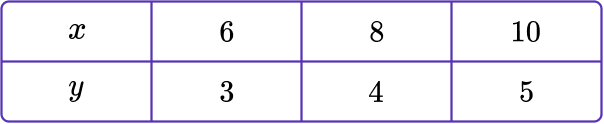
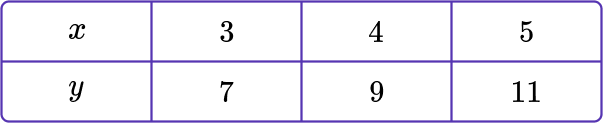
Write the ratio of each of the points in the form of \, \cfrac{y}{x} \, .
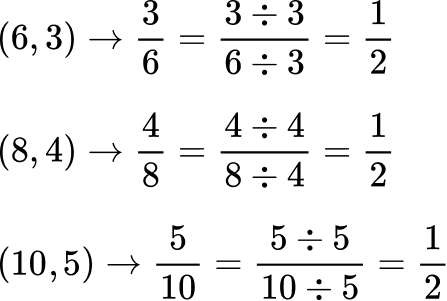
\cfrac{3}{6}=\cfrac{4}{8}=\cfrac{5}{10} \, , where the common ratio is \, \cfrac{1}{2} \, .
6. Which table shows a proportional relationship where the common ratio is 3?
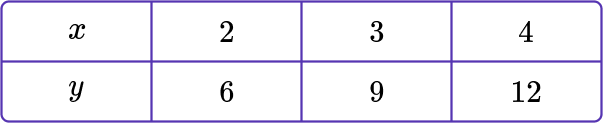
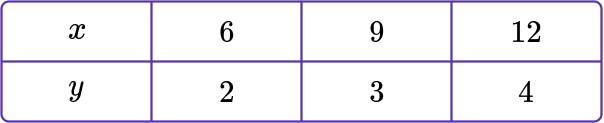
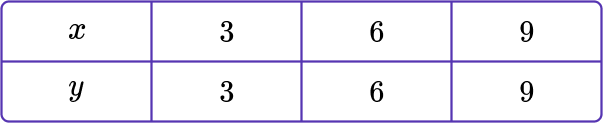
Write the ratio of each of the points in the form of \, \cfrac{y}{x} \, .
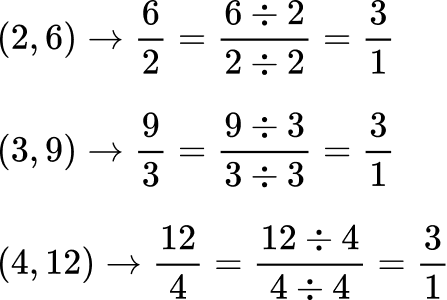
\cfrac{6}{2}=\cfrac{9}{3}=\cfrac{12}{4} \, , where the common ratio is \, \cfrac{3}{1}=3 .
7. Which linear equation represents a proportional relationship with a unit rate of \, \cfrac{1}{2} \, ?
Make a table of values selecting three values for x.
Graph the points to form a linear graph.
The linear graph goes through the origin proving that it is a proportional relationship.
Linear graph FAQS
No, only linear graphs that pass through the origin are proportional.
Yes, as you move through pre-algebra and algebra you will learn that the unit rate is the slope of the line.
The x -intercept is the point where the line crosses the x -axis. The y -intercept is the point where the line crosses the y -axis.
In pre-algebra and algebra, you will learn standard ways to write linear equations, which are called slope-intercept form of a line, point-slope form of a line, and standard form of a line.
The gradient of the line is the movement from one point to the next on a linear graph. It is also known as the slope.
Yes, all straight line graphs are linear graphs.
Yes, non-linear graphs form curves such as u-shape figures called parabolas and curves formed by polynomials.
There are several methods to use when graphing linear equations. One way is to make a table of values, but there are other ways you will learn that are quicker, such as graphing linear equations using slope-intercept.
A linear function is a linear equation that is represented as a straight line on a graph.
Yes, in algebra, you will learn how to graph linear inequalities.
The next lessons are
- Graphing linear equations
- Rate of change
- Systems of equations
Still stuck?
At Third Space Learning, we specialize in helping teachers and school leaders to provide personalized math support for more of their students through high-quality, online one-on-one math tutoring delivered by subject experts.
Each week, our tutors support thousands of students who are at risk of not meeting their grade-level expectations, and help accelerate their progress and boost their confidence.

Find out how we can help your students achieve success with our math tutoring programs.
[FREE] Common Core Practice Tests (3rd to 8th Grade)
Prepare for math tests in your state with these 3rd Grade to 8th Grade practice assessments for Common Core and state equivalents.
Get your 6 multiple choice practice tests with detailed answers to support test prep, created by US math teachers for US math teachers!