Election Math Activities: Real World Election Day Math For Kindergarten Through 8th Grade
Election day 2024 is almost here! Use this exciting opportunity to bring real-world math into the classroom.
These election day activities will help kindergartners to 8th grade students connect math to real life. To help you make the most of this, we’ve put together interactive, Common Core-aligned election day math activities for kindergartners to 8th graders.
Why is real-world math important?
Relating math to real life situations increases student engagement and helps them build a conceptual understanding of what they are learning. Seeing how math is used in the real world makes it more relevant to students and they become more motivated and interested in their work.
Election day is a timely opportunity to explore math concepts in a real world context, from counting votes to analyzing data. Using election-themed activities, teachers can show students that math matters in the decisions and processes that shape our society.
How to use these election related maths activities
These election math activities are divided into those more suitable for elementary school and those more suitable for middle school. But you’ll know the level your students are working at so start where it seems appropriate.
The Common Core Math Standard links are recommendations only. Many of these math resources have differentiation opportunities for different grade levels. Teachers can adapt each activity to meet individual classroom needs and state standards.
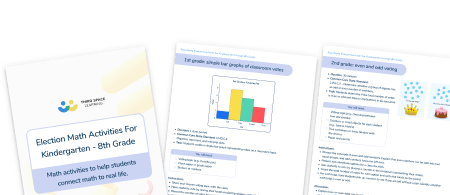
If you want a more ready-to-use version of all these math activities, the election day math resource is available for free download: Download Election Day Maths Activities
Connect math to the real world with these 9 election day math activities for your kindergarten to 8th grade students.
Download Free Now!Providing real world context to math problems is a key part of our elementary and middle school AI math tutoring. If you would like to learn more about what our AI math tutoring looks like in action, look at our math tutoring programs.
At the end of the elementary school activities, you can find links to other ‘topical’ and engaging free resources, worksheets and math activities designed for different school-related contexts.
Election math activities for elementary school
Designed to engage and educate lower and upper elementary students, these math activities align with the Common Core Math Standards. They provide pupils with practical applications of mathematical concepts which can help to deepen and solidify their understanding.
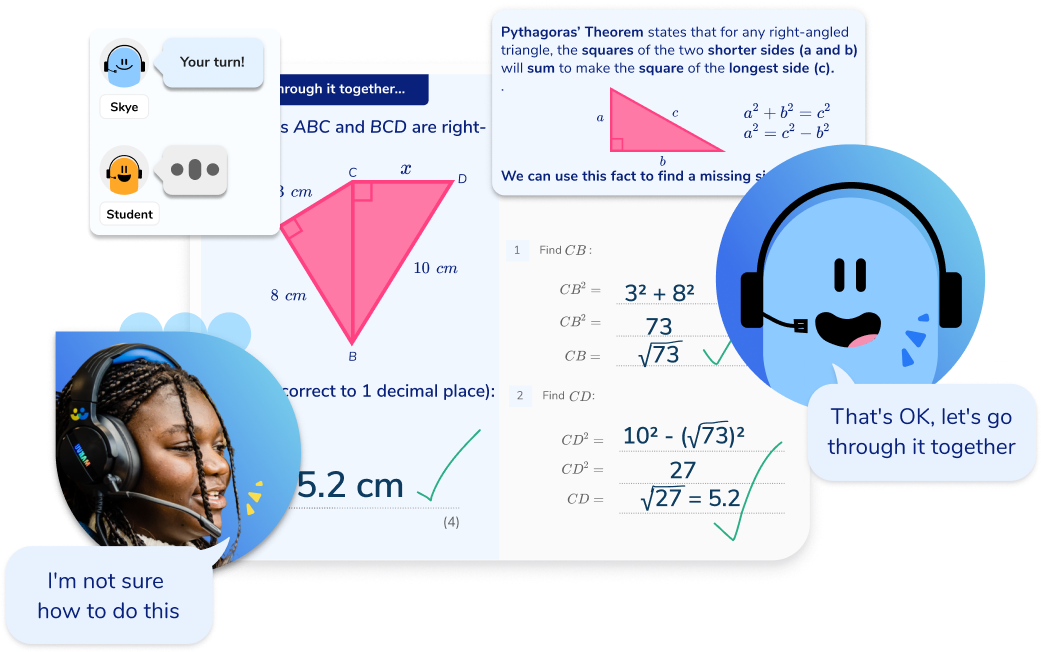
Meet Skye, the voice-based AI tutor making math success possible for every student.
Built by teachers and math experts, Skye uses the same pedagogy, curriculum and lesson structure as our traditional tutoring.
But, with more flexibility and a low cost, schools can scale online math tutoring to support every student who needs it.
Find out moreKindergarten: counting votes with objects
- Duration: 30 minutes
- Common Core State Standard: K.CC.B.4 – Understand the relationship between numbers and quantities.
- Task: Students vote on a classroom decision using objects to represent votes and practice counting.
You will need:
- Voting topic (e.g. favourite fruit)
- Colored blocks or counters
- Two containers labeled with choices (e.g., “apple” and “banana”)
Instructions:
- Introduce the concept of voting as making a choice.
- Pose a question to the class. For example, what is your favourite fruit? Show learners that the two containers have labels for their answers.
- Ask each student to place a block in the container showing their answer.
- Together count the blocks in each container.
- As a class, decide which choice has the most votes.
Discussion:
Talk about counting and quantities.

1st grade: simple bar graphs of classroom votes
- Duration: 1 class period
- Common Core State Standard: 1.MD.C.4 – Organize, represent, and interpret data.
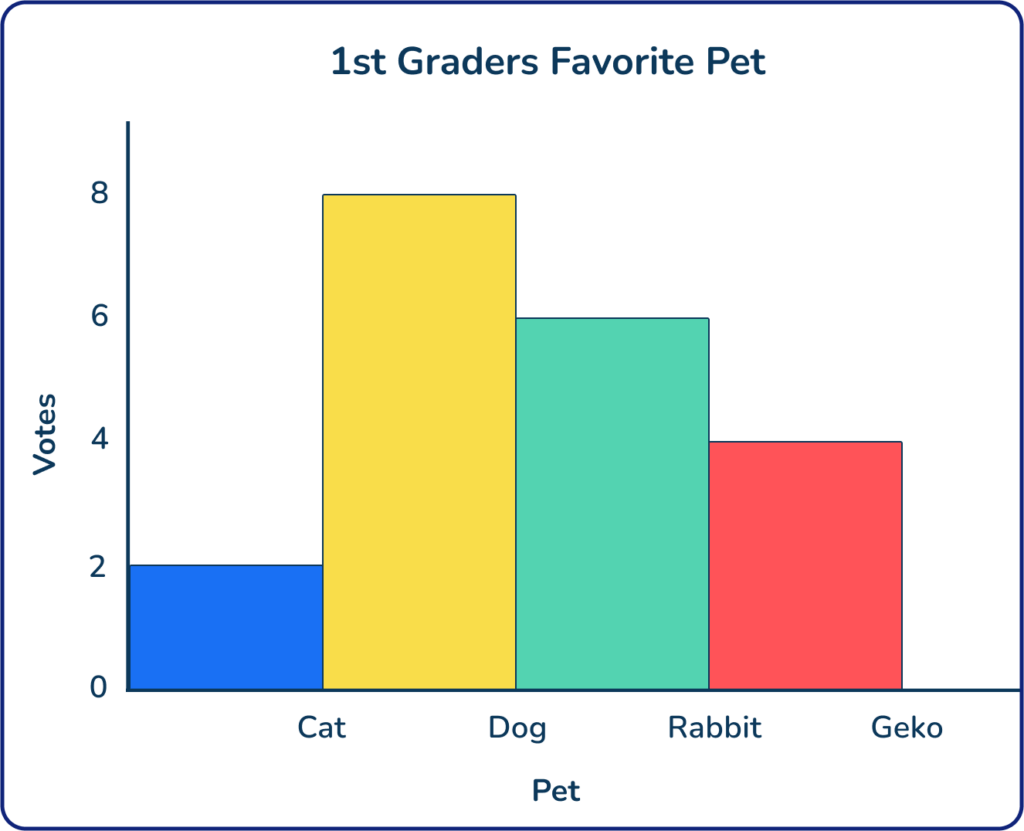
- Task: Students create a simple bar graph representing votes on a classroom topic.
You will need:
- Voting topic (e.g., favorite pet)
- Chart paper or graph paper
- Stickers or markers
Instructions:
- Share your chosen voting topic with the class.
- Have students vote by raising their hands or placing stickers under their favorite pet.
- Record the number of votes for each option as a tally.
- Talk about bar graphs and what they show.
- Guide students to draw bars representing each option.
Discussion:
Ask questions about which option is most or least popular and have students explain how they know this.
2nd grade: even and odd voting
- Duration: 30 minutes
- Common Core State Standard: 2.OA.C.3 – Determine whether a group of objects has an odd or even number of members.
- Task: Students determine if the total number of votes is even or odd and discuss implications in tie scenarios.
You will need:
- Voting topic (e.g., choosing between two storybooks)
- Counters or small objects for each student (e.g., tokens, blocks)
- Two containers or areas labeled with the choices
- Paper and pencils
Instructions:
- Review the concepts of even and odd numbers. Explain that even numbers can be split into two equal groups, and odd numbers have one left over.
- Present two storybook options for a class decision.
- Ask students to vote by placing a counter in the container representing their choice.
- Count the total number of votes for each option and write the totals on the board.
- For each total, have students pair up counters to see if any are left without a pair. Identify whether each total is even or odd.
Discussion:
- Explain how an even total can lead to a tie. Discuss what the class can do in the event of a tie (e.g., teacher decides, revote).
Extension Activity:
- Change the total number of voters (add a pretend student or remove a vote) and observe how it affects whether the total is even or odd.
- Discuss how adding or subtracting one vote changes the outcome.
Example:
If 21 students vote and 11 choose option A while 10 choose option B, discuss how 21 is odd and how that affects the possibility of a tie.
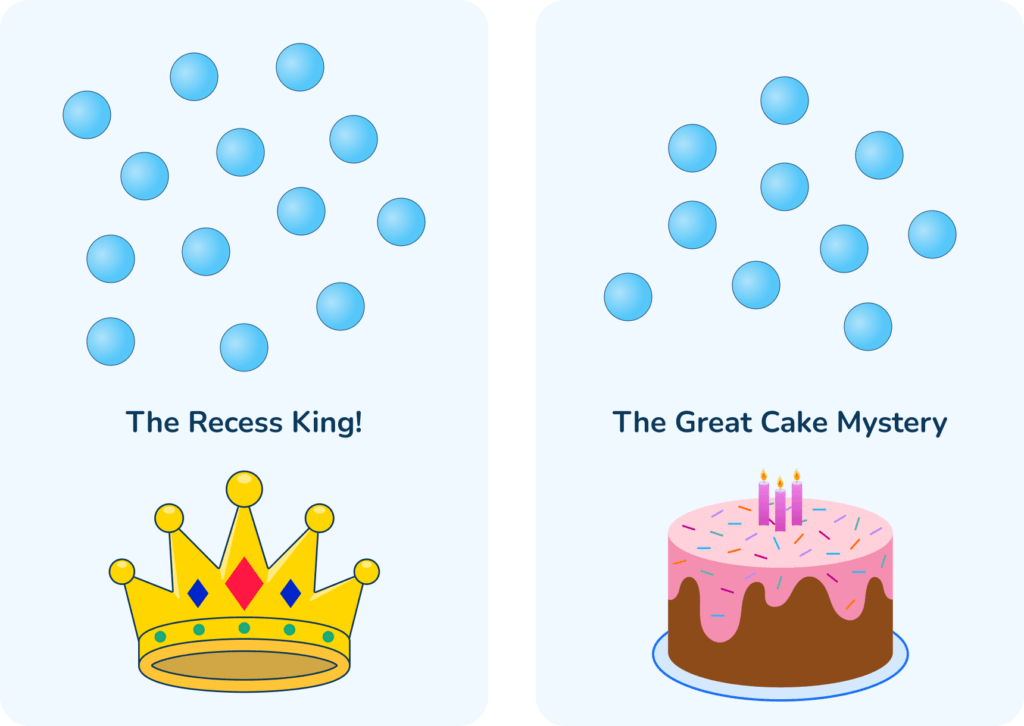
3rd grade: election results pictograph
- Duration: 1 class period
- Common Core State Standard: 3.MD.B.3 (Draw a scaled picture graph and a scaled bar graph)
- Task: Students use maps to represent election results, linking geography with data representation.
You will need:
- Voting topic (e.g., favorite animal)
- Tally charts or blank paper
- Graph paper
- Markers or pencils
Instructions:
- Discuss with students how data can be represented in different ways, such as tally charts and picture graphs.
- Discuss tally charts, including how to represent 5 in a tally.
- Pose the voting topic to the class.
- Gather the data and display it as a tally chart.
- Together, count the votes (skip counting where possible).
- Create a picture graph of the data. This could be as a whole class, in small groups or individually.
- Students could use concrete resources to create the picture graph.
Discussion:
- Compare the totals and identify which option received the most votes.
- Discuss any patterns observed in the data.
Extension Activity:
- Introduce rounding the total number of votes to the nearest 10.
- Discuss why rounding might be useful in estimating large numbers.
Example:
- If option A has 23 votes and option B has 17 votes, practice skip counting and rounding with these numbers.

4th grade: election timeline math
- Duration: 1 class period
- Common Core State Standard: 4.MD.A.2 – Solve problems involving intervals of time.
- Summary: Students create a timeline of significant election events, calculating intervals between dates.
You will need:
- List of election-related dates
- Rulers, pencils
Instructions:
- Discuss the sequence of events in an election cycle.
- Provide real or example dates for key events in the election cycle.
- Example events:
- Campaign Start: January 15
- Primary Elections: March 3
- National Convention: July 20
- Election Day: November 5
- Example events:
- Students plot these dates on a timeline and calculate the number of days or weeks between events.
Discussion:
- Discuss why certain events are spaced as they are.
Extension activity:
- Include historical election events for comparison.

5th grade: decimal representation of votes
- Duration: 1 class period
- Common Core State Standard: 5.NBT.A.3 – Read, write, and compare decimals to thousandths.
- Summary: Students convert vote counts into decimals and percentages to understand decimal representations.
What you will need:
- Voting data from a class vote
- Calculators (optional)
Instructions:
- Review the relationship between fractions, decimals, and percentages. Explain how election results are reported using percentages.
- Conduct a vote using a chosen topic with multiple options (e.g. favourite drink).
- Record the number of votes each option receives.
- Write each total number of votes as a fraction of votes. For example, option A: \frac{12}{25} votes.
- Convert the fractions to decimals by dividing the numerator by the denominator. For example, 12 ÷ 25 = 0.48
- Convert the decimal to percentages by multiplying by 100. For example, 0.48 × 100 = 48%
- Create a table with columns for option, votes, fraction, decimal, and percentage.
- Compare the decimals and percentages to determine which option was most popular.
| option | votes | fraction | decimal | percentage |
| water | 3 | |||
| Orange juice | 9 | |||
| Apple juice | 5 | |||
| Blackcurrant juice | 8 | |||
| Total | 25 |
Discussion:
- Discuss how decimals and percentages provide precise information.
Extension activity:
- Round decimals to the nearest hundredth or thousandth.
- Explore repeating decimals if applicable.
Example:
- Example Voting Results:
- Option A: 12 votes (12÷ 25 = 0.48 = 48%)
- Option B: 8 votes (8÷ 25 = 0.32 = 32%)
- Option C: 5 votes (5÷ 25 = 0.20 = 20%)
Election math activities for middle school
Designed to engage and educate lower and upper elementary students, these math activities align with the Common Core Math Standards. They provide pupils with practical applications of mathematical concepts which can help to deepen and solidify their understanding.
6th grade: understanding mean, median, and mode with election data
- Duration: 1 class period
- Common Core State Standard: 6.SP.B.5 – Summarize numerical data sets.
- Task: Students calculate mean, median, and mode using election-related data to understand measures of central tendency.
You will need:
- Data sets (e.g., voter ages, number of votes per precinct)
- Calculators
Instructions:
- Review the meaning of mean, median and mode.
- Present students with the data set. For example the number of votes from different polling stations.
- Calculate the mean, median and mode for the data set.
- Mean: (sum of all data points) ÷ (number of data points)
- Median: middle value when data is ordered
- Mode: most frequently occurring value
- Discuss what each measure tells us about the data.
Discussion:
- Compare the measures and discuss which is most representative of the data set.
7th grade: campaign budget planning
- Duration: 2 class periods
- Common Core State Standard: Content.7.EE.B.3 – Solve multi-step real-life problems.
- Summary: Students plan a mock campaign budget, allocating funds to various activities while staying within a set budget.
You will need:
- Budget table
- List of campaign activities with costs (e.g., advertisements, rallies)
- Calculators
Instructions:
- Discuss the importance of budgeting in general. Then discuss the importance of budgeting in running a campaign.
- Set a budget for an imaginary campaign (e.g. $10,000).
- Set a list of expenses such as:
- TV Ad: $2,000 each
- Radio Ad: $500 each
- Campaign Rally: $1,000
- Flyers: $100 per 1,000 copies
- Students work individually or in groups to decide how to allocate funds to different activities, ensuring that they do not exceed the budget.
- Students present their budget plans and justify their choices.
- For each activity chosen, explain why it is important for the campaign.
- Discuss how it will help reach voters and contribute to winning the election.
- Explain how you prioritized activities to stay within the budget.
- Mention any activities you wanted to include but couldn’t due to budget constraints.
Example:
Campaign activities and costs
| Campaign activity | Cost per unit | Quantity planned | Total cost |
| TV advertisement | $2,000 per ad | 3 | $6,000 |
| Radio advertisement | $500 per ad | 4 | $2,000 |
| Social media campaign | $300 per campaign | 2 | $600 |
| Printed flyers | $100 per 1,000 flyers | 4 | $400 |
| Campaign rally | $1,000 per rally | 1 | $1,000 |
| Promotional buttons | $50 per 100 buttons | 0 | $0 |
| Website development | $800 one-time fee | 0 | $0 |
| Volunteer training session | $200 per session | 0 | $0 |
| Phone banking | $150 per day | 0 | $0 |
| Door-to-door canvassing | $100 per day | 0 | $0 |
| Subtotal | $10,000 |
8th Grade: linear functions and election trends
- Duration: 2 class periods
- Common Core State Standard: 8.F.B.5 (Describe qualitatively the functional relationship between two quantities by analyzing a graph)
- Summary: Students use linear functions to model and predict election trends, analyzing relationships between variables.
You will need:
- Historical election data (e.g., campaign spending vs. votes received)
- Graphing calculators or software
Instructions:
- Introduce linear relationships and functions.
- Discuss independent and dependent variables in the context of elections.
- Provide data sets, such as:
| Campaign spending (in millions of dollars) | Votes received (in thousands) |
| 2 | 50 |
| 3 | 70 |
| 5 | 110 |
| 7 | 150 |
| 9 | 190 |
- Students plot the data on a coordinate plane.
- Use methods to draw a line that best fits the data and calculate the slope (rate of change) and y-intercept.
- Write the equation of the line in y = mx + b form. For example: y = 20x + 10
- Explain what the slope and y-intercept represent and discuss the relationship between campaign spending and votes received.
- Use the function to predict votes received for different spending amounts.
Discussion:
- Analyze the limitations of the model.
- Discuss other factors that could influence election results.
Extension activity:
- Explore nonlinear models if the data suggests a different relationship.
Note for Teachers:
For all election math activities, you can adjust the activity complexity based on grade level proficiency. If using real world data, ensure it is current and appropriate for your grade level.
- Classroom Management: Encourage group work and discussions to foster collaborative learning.
- Assessment: Use these activities as formative assessments to gauge students’ understanding of the concepts.
Do you have students who need extra support in math?
Skye—our AI math tutor built by experienced teachers—provides students with personalized one-on-one, spoken instruction that helps them master concepts, close skill gaps, and gain confidence.
Since 2013, we’ve delivered over 2 million hours of math lessons to more than 170,000 students, guiding them toward higher math achievement.
Discover how our AI math tutoring can boost student success, or see how our math programs can support your school’s goals:
– 3rd grade tutoring
– 4th grade tutoring
– 5th grade tutoring
– 6th grade tutoring
– 7th grade tutoring
– 8th grade tutoring
